


 |
市場調查報告書
商品編碼
1446891
防水產品市場:按產品類型、按應用分類:2023-2033 年全球機會分析與產業預測Waterproofing Products Market By Product Type, By Application : Global Opportunity Analysis and Industry Forecast, 2023-2033 |
||||||
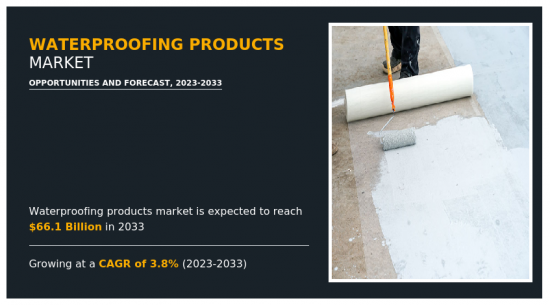
2019年全球防水產品市場價值為425億美元,預計2023年至2033年複合年成長率為3.8%,到2033年達到661億美元。
防水是使物體或結構防水或抗水的過程,使其相對不受水的影響或在某些條件下抵抗水的侵入。這些產品可在潮濕環境和水下一定深度使用。防水性和耐水性通常是指在壓力下抵抗液體進入的能力,而防潮性是指抵抗濕度或濕氣的能力。水蒸氣透過材料或結構的速率稱為水蒸氣穿透率(MVTR)。
世界各地有許多橋樑需要維修。根據《2021 年基礎建設報告卡》,美國有 614,387 座橋樑,其中約 40% 的橋樑壽命超過 50 年,接近使用壽命。在多雪地區,除冰鹽被廣泛使用以改善危險狀況。除冰鹽中的氯離子會與水一起穿過透水水泥建築物,並開始損壞下面的鋼材。這種腐蝕不僅會削弱鋼材的強度,還會導致周圍的混凝土剝落。結果,橋樑的載重能力和乘坐舒適性下降。
在橋樑中,防水膜可防止水進入結構構件。防水膜是一層薄薄的防滲層,與瀝青覆蓋層一起使用,以保護橋樑的下部結構。合成橡膠防水膜被設計用作犧牲表面,瀝青覆蓋層可以多次去除和更換,只要保護下面的膜系統,就可以提供更長的保護。因此,防水膜有助於保持橋樑的完整性。
隧道和其他埋地地下結構容易受到上方土壤滲水的影響。由於全球基礎設施和運輸需求的增加,垃圾掩埋場和隧道襯砌產業預計在預測期內將以穩定的速度發展。 LDPE 和 HDPE 是普及的隧道襯砌防水膜。為了延長隧道的使用壽命,確保其持續安全使用,需要在隧道內安裝防水膜。
防水產品(例如防水膜和化學物質)的使用會帶來環境和健康問題。以噴霧形式使用時,防水膜會對使用者和周圍工人造成危險。這些化學物質可能含有氟化合物,如果吸入,可能會導致化學性肺炎和肺部損傷等呼吸道疾病。同樣,瀝青膜的塗布可能會使員工暴露在有害煙霧中。長時間接觸這些煙霧會導致健康問題,例如支氣管炎和鼻部不適。此外,員工在公司工作的時間越長,有關鼻子和喉嚨的不明投訴就越多。溶劑、稀釋劑和其他防水膜會釋放有害氣體和揮發性有機化合物,危害環境。然而,透過使用人工呼吸器、防護設備和環保解決方案可以避免這些問題。因此,與防水產品相關的環境和健康風險預計將阻礙預測期內對防水產品的需求。
對永續城市開拓的日益關注增加了人們對綠色屋頂的興趣,為防水產品市場創造了巨大的機會。植被屋頂具有許多環境效益,包括提高能源效率、減輕城市熱島效應、加強雨水管理。隨著綠色屋頂的採用勢頭強勁,對有效防水解決方案以防止進水和結構損壞的需求變得至關重要。
防水產品市場將從這一趨勢中受益,因為綠色屋頂需要專門設計的耐用且防漏的材料。綠色屋頂需要防水膜、被覆劑和密封劑來保護建築物免受洪水和自然災害的影響。隨著人們對綠色屋頂生態學效益的認知不斷增強,建築師、建築商和城市負責人在計劃中優先考慮防水解決方案,從而增加了對高品質防水產品的需求。這一趨勢對於防水產業來說是一條雙贏的道路,同時也是解決環境問題、促進創新和促進建築實踐的永續性的道路。
全球防水產品市場按產品類型、應用和地區細分。依產品類型分為防水塗料、高分子篷布、剛性防水材料、瀝青防水卷材、建築密封防水材料等。根據應用,它們分為屋頂/牆壁、地板/地下室、水/廢棄物管理、隧道襯砌、橋樑/高速公路等。從地區來看,調查涵蓋北美、歐洲、亞太地區、南美和中東/非洲。
相關人員的主要利益
- 本報告提供了 2019 年至 2033 年防水產品市場分析的細分市場、當前趨勢、估計/趨勢分析和動態的定量分析,以確定一般防水產品市場機會。
- 我們提供市場研究以及與市場促進因素、市場限制和市場機會相關的資訊。
- 波特的五力分析強調買家和供應商幫助相關人員做出利潤驅動的商業決策並加強供應商-買家網路的潛力。
- 對防水產品市場細分的詳細分析有助於確定當前的市場機會。
- 每個地區的主要國家都根據其對全球市場的收益貢獻繪製了地圖。
- 市場參與者定位有助於基準化分析,並提供對市場參與者當前地位的清晰了解。
- 該報告包括對區域和全球防水產品市場趨勢、主要企業、細分市場、應用領域和市場成長策略的分析。
可以使用此報告進行客製化(需要額外費用和時間表)
- 製造能力
- 資本投資明細
- 產品基準/產品規格及應用
- 產品生命週期
- 供應鏈分析與供應商利潤
- 按地區分類的新參與企業
- 科技趨勢分析
- 按產品/細分市場區隔
- 新產品開發/主要企業產品矩陣
- 國家、區域和全球各級的患者/流行病學資料
- 監管指引
- 根據客戶興趣新增其他公司簡介
- 按國家或地區進行的附加分析 – 市場規模和預測
- 平均售價分析/價位分析
- 公司簡介的擴充列表
- 歷史市場資料
- 導入/匯出分析/資料
- 主要企業詳細資料(Excel 格式,包括位置、聯絡資訊、供應商/供應商網路等)
- 客戶/消費者/原料供應商名單 - 價值鏈分析
- 全球/區域/國家層級公司的市場佔有率分析
- 產品消費分析
- 成交量市場規模及預測
目錄
第1章簡介
第 2 章執行摘要
第3章市場概況
- 市場定義和範圍
- 主要發現
- 影響因素
- 主要投資機會
- 波特五力分析
- 市場動態
- 促進因素
- 防水膜在基礎設施應用中的使用增加
- 住宅建設快速成長
- 抑制因素
- 與防水產品相關的環境與健康風險
- 機會
- 屋頂綠化意識不斷增強
- 促進因素
- 價值鏈分析
- 關鍵監管分析
- 專利形勢
- 監管指引
第4章防水產品市場:依產品類型
- 概述
- 防水塗料
- 聚合物篷布
- 硬質防水材料
- 瀝青防水卷材
- 建築密封防水材料
- 其他
第5章防水產品市場:依應用分類
- 概述
- 屋頂和牆壁
- 地板和地下室
- 橋樑和高速公路
- 水和廢棄物管理
- 隧道襯砌
- 其他
第6章防水產品市場:依地區
- 概述
- 北美洲
- 美國
- 墨西哥
- 加拿大
- 歐洲
- 德國
- 法國
- 英國
- 其他
- 亞太地區
- 中國
- 日本
- 印度
- 印尼
- 越南
- 其他
- 南美洲
- 巴西
- 阿根廷
- 智利
- 南美洲其他地區
- 中東/非洲
- 南非
- 沙烏地阿拉伯
- 阿拉伯聯合大公國
- 其他中東/非洲
第7章 競爭形勢
- 介紹
- 關鍵成功策略
- 10家主要企業產品圖譜
- 競爭對手儀表板
- 競爭熱圖
- 2019年主要企業定位
第8章 公司簡介
- Henry Company
- GAF.
- Soprema
- Sika AG
- Carlisle Companies Inc.
- GCP Applied Technologies Inc.
- RPM International Inc.
- HOLCIM
- BASF SE
- Dow
The global waterproofing products market was valued at $42.5 billion in 2019 and is projected to reach $66.1 billion by 2033, growing at a CAGR of 3.8% from 2023 to 2033.
Waterproofing is the process of making an object or structure watertight or water-resistant so that it is relatively unaffected by water or resists the infiltration of water under specific conditions. These products can be utilized in damp settings or at specific depths underwater. Water-resistant and waterproof often refer to resistance to liquid water penetration, potentially under pressure, whereas dampproof refers to resistance to humidity or dampness. The rate of water vapor transmission through a substance or structure is referred to as the moisture vapor transmission rate (MVTR).
Numerous bridges globally are in dire need of repair. According to the n Infrastructure Report Card 2021, the U.S. has 614,387 bridges, of which about 40% are 50 years or older and approaching the end of their authorized service life. In snowy climates, deicing salts are widely used to remedy hazardous circumstances. Chloride ions from deicing salts can pass through permeable concrete structures with water and begin to damage the steel beneath. This attack's corrosion not only weakens the steel but can also contribute to the spalling of the surrounding concrete. This causes the bridge's load-bearing capability and riding surface quality to deteriorate.
On the bridge, waterproofing membranes prevent water from penetrating the structure's components. The waterproofing membrane is a thin, impermeable layer used in conjunction with an asphalt overlay (as the riding surface) to protect the bridge's underlying structure. Elastomeric waterproofing membranes are designed to provide longer protection, with the asphalt overlay serving as a sacrificial surface that may be removed and replaced several times so long as the underlying membrane system is protected. Therefore, waterproof membranes contribute to the preservation of the bridge's integrity.
Tunnels and other buried underground structures are susceptible to seepage water through the soil above them. Due to the increase in demand for infrastructure and transportation globally, the landfills & tunnel liners industry is anticipated develop at a stable rate during the forecast period. LDPE and HDPE are the most prevalent tunnel-lining waterproofing membranes. It is required to put waterproof membranes in tunnels to extend their lifespan and ensure their ongoing, secure use.
Usage of waterproofing products, such as membranes and chemicals, causes environmental and health problems. When employed in spray form, waterproofing membranes can be hazardous to the user and workers in the vicinity. These chemicals may contain fluorinated compounds, which, when inhaled, can lead to chemical pneumonitis, lung damage, and other respiratory issues. Similarly, the application of bitumen-based membranes might expose employees to hazardous fumes. Long-term exposure to these fumes may cause health problems such as bronchitis and nasal discomfort. In addition, personnel with longer tenures have demonstrated increase in nasal and pharyngeal complaints. Solvents, diluents, and other waterproofing membranes can harm the environment by emitting harmful gases and volatile organic compounds. However, these issues can be avoided using respirators, protective equipment, and eco-friendly solutions. Thus, the environmental and health risks associated with waterproofing products is expected to hamper the demand for waterproofing products during the forecast period.
The growing emphasis on sustainable urban development has sparked increased interest in green roofs, presenting a significant opportunity for the waterproofing products market. Green roofs, characterized by vegetation cover, offer numerous environmental benefits, such as improved energy efficiency, reduced urban heat island effect, and enhanced stormwater management. As the adoption of green roofs gains momentum, the demand for effective waterproofing solutions becomes important to prevent water infiltration and structural damage.
The waterproofing products market stands to benefit from this trend, as these roofs necessitate specialized materials to ensure durability and leak prevention. Green roof installations require waterproof membranes, coatings, and sealants to protect buildings from water ingress and provide a reliable barrier against the elements. As awareness of the ecological advantages of green roofs continues to rise, architects, builders, and urban planners are likely to prioritize waterproofing solutions in their projects, thereby fueling the demand for quality waterproofing products. This trend not only addresses environmental concerns but also represents a lucrative avenue for the waterproofing industry, driving innovation and promoting sustainability in construction practices.
The global waterproofing products market is segmented into product type, application, and region. By product type, the market is divided into waterproof paints, polymer waterproof sheets, rigid waterproof materials, asphalt waterproof rolls, building seal waterproof materials and others. By application, it is categorized into roofing and walls, floors and basements, water and waste management, tunnel liners, bridges and highways, and others. region-wise, the market is studied across North America, Europe, Asia-Pacific, South America, and Middle East and Africa.
The major players operating in the global waterproofing products market are BASF SE, Sika AG, Carlisle Companies Inc., RPM International Inc., GCP Applied Technologies Inc., HOLCIM, Soprema Group, GAF, Henry Company, and The Dow Chemical Company. Other players operating in the market are Saint-Gobain Weber GmbH, Fosroc Ltd., Maris Polymers, Pidilite Industries Ltd., and Bayer Material Science AG.
Key Benefits For Stakeholders
- This report provides a quantitative analysis of the market segments, current trends, estimations, and dynamics of the waterproofing products market analysis from 2019 to 2033 to identify the prevailing waterproofing products market opportunities.
- The market research is offered along with information related to key drivers, restraints, and opportunities.
- Porter's five forces analysis highlights the potency of buyers and suppliers to enable stakeholders make profit-oriented business decisions and strengthen their supplier-buyer network.
- In-depth analysis of the waterproofing products market segmentation assists to determine the prevailing market opportunities.
- Major countries in each region are mapped according to their revenue contribution to the global market.
- Market player positioning facilitates benchmarking and provides a clear understanding of the present position of the market players.
- The report includes the analysis of the regional as well as global waterproofing products market trends, key players, market segments, application areas, and market growth strategies.
Additional benefits you will get with this purchase are:
- Quarterly Update and* (only available with a corporate license, on listed price)
- 5 additional Company Profile of client Choice pre- or Post-purchase, as a free update.
- Free Upcoming Version on the Purchase of Five and Enterprise User License.
- 16 analyst hours of support* (post-purchase, if you find additional data requirements upon review of the report, you may receive support amounting to 16 analyst hours to solve questions, and post-sale queries)
- 15% Free Customization* (in case the scope or segment of the report does not match your requirements, 15% is equivalent to 3 working days of free work, applicable once)
- Free data Pack on the Five and Enterprise User License. (Excel version of the report)
- Free Updated report if the report is 6-12 months old or older.
- 24-hour priority response*
- Free Industry updates and white papers.
Possible Customization with this report (with additional cost and timeline, please talk to the sales executive to know more)
- Manufacturing Capacity
- Capital Investment breakdown
- Product Benchmarking / Product specification and applications
- Product Life Cycles
- Supply Chain Analysis & Vendor Margins
- Upcoming/New Entrant by Regions
- Technology Trend Analysis
- Market share analysis of players by products/segments
- New Product Development/ Product Matrix of Key Players
- Patient/epidemiology data at country, region, global level
- Regulatory Guidelines
- Additional company profiles with specific to client's interest
- Additional country or region analysis- market size and forecast
- Average Selling Price Analysis / Price Point Analysis
- Expanded list for Company Profiles
- Historic market data
- Import Export Analysis/Data
- Key player details (including location, contact details, supplier/vendor network etc. in excel format)
- List of customers/consumers/raw material suppliers- value chain analysis
- Market share analysis of players at global/region/country level
- Product Consumption Analysis
- Volume Market Size and Forecast
Key Market Segments
By Product Type
- Waterproof Paints
- Polymer Waterproof Sheets
- Rigid Waterproof Materials
- Asphalt Waterproof Rolls
- Building Seal Waterproof Materials
- Others
By Application
- Roofing and Walls
- Floors and Basements
- Bridges and Highways
- Water and Waste Management
- Tunnel Liners
- Others
By Region
- North America
- U.S.
- Mexico
- Canada
- Europe
- Germany
- France
- UK
- Rest of Europe
- Asia-Pacific
- China
- Japan
- India
- Indonesia
- Vietnam
- Rest of Asia-Pacific
- South America
- Brazil
- Argentina
- Chile
- Rest Of South America
- Middle East and Africa
- South Africa
- Saudi Arabia
- UAE
- Rest of Middle East And Africa
Key Market Players:
- Sika AG
- Carlisle Companies Inc.
- GCP Applied Technologies Inc.
- RPM International Inc.
- Henry Company
- GAF.
- Soprema
- HOLCIM
- BASF SE
- Dow
TABLE OF CONTENTS
CHAPTER 1: INTRODUCTION
- 1.1. Report description
- 1.2. Key market segments
- 1.3. Key benefits to the stakeholders
- 1.4. Research methodology
- 1.4.1. Primary research
- 1.4.2. Secondary research
- 1.4.3. Analyst tools and models
CHAPTER 2: EXECUTIVE SUMMARY
- 2.1. CXO Perspective
CHAPTER 3: MARKET OVERVIEW
- 3.1. Market definition and scope
- 3.2. Key findings
- 3.2.1. Top impacting factors
- 3.2.2. Top investment pockets
- 3.3. Porter's five forces analysis
- 3.3.1. Moderate bargaining power of suppliers
- 3.3.2. Moderate threat of new entrants
- 3.3.3. Low threat of substitutes
- 3.3.4. High intensity of rivalry
- 3.3.5. Moderate bargaining power of buyers
- 3.4. Market dynamics
- 3.4.1. Drivers
- 3.4.1.1. Increase in use of waterproofing membranes in infrastructure applications
- 3.4.1.2. Surge in residential construction
- 3.4.2. Restraints
- 3.4.2.1. Environmental and health risks associated with waterproofing products
- 3.4.3. Opportunities
- 3.4.3.1. Increase in awareness of green roofs
- 3.4.1. Drivers
- 3.5. Value Chain Analysis
- 3.6. Key Regulation Analysis
- 3.7. Patent Landscape
- 3.8. Regulatory Guidelines
CHAPTER 4: WATERPROOFING PRODUCTS MARKET, BY PRODUCT TYPE
- 4.1. Overview
- 4.1.1. Market size and forecast
- 4.2. Waterproof Paints
- 4.2.1. Key market trends, growth factors and opportunities
- 4.2.2. Market size and forecast, by region
- 4.2.3. Market share analysis by country
- 4.3. Polymer Waterproof Sheets
- 4.3.1. Key market trends, growth factors and opportunities
- 4.3.2. Market size and forecast, by region
- 4.3.3. Market share analysis by country
- 4.4. Rigid Waterproof Materials
- 4.4.1. Key market trends, growth factors and opportunities
- 4.4.2. Market size and forecast, by region
- 4.4.3. Market share analysis by country
- 4.5. Asphalt Waterproof Rolls
- 4.5.1. Key market trends, growth factors and opportunities
- 4.5.2. Market size and forecast, by region
- 4.5.3. Market share analysis by country
- 4.6. Building Seal Waterproof Materials
- 4.6.1. Key market trends, growth factors and opportunities
- 4.6.2. Market size and forecast, by region
- 4.6.3. Market share analysis by country
- 4.7. Others
- 4.7.1. Key market trends, growth factors and opportunities
- 4.7.2. Market size and forecast, by region
- 4.7.3. Market share analysis by country
CHAPTER 5: WATERPROOFING PRODUCTS MARKET, BY APPLICATION
- 5.1. Overview
- 5.1.1. Market size and forecast
- 5.2. Roofing and Walls
- 5.2.1. Key market trends, growth factors and opportunities
- 5.2.2. Market size and forecast, by region
- 5.2.3. Market share analysis by country
- 5.3. Floors and Basements
- 5.3.1. Key market trends, growth factors and opportunities
- 5.3.2. Market size and forecast, by region
- 5.3.3. Market share analysis by country
- 5.4. Bridges and Highways
- 5.4.1. Key market trends, growth factors and opportunities
- 5.4.2. Market size and forecast, by region
- 5.4.3. Market share analysis by country
- 5.5. Water and Waste Management
- 5.5.1. Key market trends, growth factors and opportunities
- 5.5.2. Market size and forecast, by region
- 5.5.3. Market share analysis by country
- 5.6. Tunnel Liners
- 5.6.1. Key market trends, growth factors and opportunities
- 5.6.2. Market size and forecast, by region
- 5.6.3. Market share analysis by country
- 5.7. Others
- 5.7.1. Key market trends, growth factors and opportunities
- 5.7.2. Market size and forecast, by region
- 5.7.3. Market share analysis by country
CHAPTER 6: WATERPROOFING PRODUCTS MARKET, BY REGION
- 6.1. Overview
- 6.1.1. Market size and forecast By Region
- 6.2. North America
- 6.2.1. Key market trends, growth factors and opportunities
- 6.2.2. Market size and forecast, by Product Type
- 6.2.3. Market size and forecast, by Application
- 6.2.4. Market size and forecast, by country
- 6.2.4.1. U.S.
- 6.2.4.1.1. Market size and forecast, by Product Type
- 6.2.4.1.2. Market size and forecast, by Application
- 6.2.4.2. Mexico
- 6.2.4.2.1. Market size and forecast, by Product Type
- 6.2.4.2.2. Market size and forecast, by Application
- 6.2.4.3. Canada
- 6.2.4.3.1. Market size and forecast, by Product Type
- 6.2.4.3.2. Market size and forecast, by Application
- 6.3. Europe
- 6.3.1. Key market trends, growth factors and opportunities
- 6.3.2. Market size and forecast, by Product Type
- 6.3.3. Market size and forecast, by Application
- 6.3.4. Market size and forecast, by country
- 6.3.4.1. Germany
- 6.3.4.1.1. Market size and forecast, by Product Type
- 6.3.4.1.2. Market size and forecast, by Application
- 6.3.4.2. France
- 6.3.4.2.1. Market size and forecast, by Product Type
- 6.3.4.2.2. Market size and forecast, by Application
- 6.3.4.3. UK
- 6.3.4.3.1. Market size and forecast, by Product Type
- 6.3.4.3.2. Market size and forecast, by Application
- 6.3.4.4. Rest of Europe
- 6.3.4.4.1. Market size and forecast, by Product Type
- 6.3.4.4.2. Market size and forecast, by Application
- 6.4. Asia-Pacific
- 6.4.1. Key market trends, growth factors and opportunities
- 6.4.2. Market size and forecast, by Product Type
- 6.4.3. Market size and forecast, by Application
- 6.4.4. Market size and forecast, by country
- 6.4.4.1. China
- 6.4.4.1.1. Market size and forecast, by Product Type
- 6.4.4.1.2. Market size and forecast, by Application
- 6.4.4.2. Japan
- 6.4.4.2.1. Market size and forecast, by Product Type
- 6.4.4.2.2. Market size and forecast, by Application
- 6.4.4.3. India
- 6.4.4.3.1. Market size and forecast, by Product Type
- 6.4.4.3.2. Market size and forecast, by Application
- 6.4.4.4. Indonesia
- 6.4.4.4.1. Market size and forecast, by Product Type
- 6.4.4.4.2. Market size and forecast, by Application
- 6.4.4.5. Vietnam
- 6.4.4.5.1. Market size and forecast, by Product Type
- 6.4.4.5.2. Market size and forecast, by Application
- 6.4.4.6. Rest of Asia-Pacific
- 6.4.4.6.1. Market size and forecast, by Product Type
- 6.4.4.6.2. Market size and forecast, by Application
- 6.5. South America
- 6.5.1. Key market trends, growth factors and opportunities
- 6.5.2. Market size and forecast, by Product Type
- 6.5.3. Market size and forecast, by Application
- 6.5.4. Market size and forecast, by country
- 6.5.4.1. Brazil
- 6.5.4.1.1. Market size and forecast, by Product Type
- 6.5.4.1.2. Market size and forecast, by Application
- 6.5.4.2. Argentina
- 6.5.4.2.1. Market size and forecast, by Product Type
- 6.5.4.2.2. Market size and forecast, by Application
- 6.5.4.3. Chile
- 6.5.4.3.1. Market size and forecast, by Product Type
- 6.5.4.3.2. Market size and forecast, by Application
- 6.5.4.4. Rest Of South America
- 6.5.4.4.1. Market size and forecast, by Product Type
- 6.5.4.4.2. Market size and forecast, by Application
- 6.6. Middle East and Africa
- 6.6.1. Key market trends, growth factors and opportunities
- 6.6.2. Market size and forecast, by Product Type
- 6.6.3. Market size and forecast, by Application
- 6.6.4. Market size and forecast, by country
- 6.6.4.1. South Africa
- 6.6.4.1.1. Market size and forecast, by Product Type
- 6.6.4.1.2. Market size and forecast, by Application
- 6.6.4.2. Saudi Arabia
- 6.6.4.2.1. Market size and forecast, by Product Type
- 6.6.4.2.2. Market size and forecast, by Application
- 6.6.4.3. UAE
- 6.6.4.3.1. Market size and forecast, by Product Type
- 6.6.4.3.2. Market size and forecast, by Application
- 6.6.4.4. Rest of Middle East And Africa
- 6.6.4.4.1. Market size and forecast, by Product Type
- 6.6.4.4.2. Market size and forecast, by Application
CHAPTER 7: COMPETITIVE LANDSCAPE
- 7.1. Introduction
- 7.2. Top winning strategies
- 7.3. Product mapping of top 10 player
- 7.4. Competitive dashboard
- 7.5. Competitive heatmap
- 7.6. Top player positioning, 2019
CHAPTER 8: COMPANY PROFILES
- 8.1. Henry Company
- 8.1.1. Company overview
- 8.1.2. Key executives
- 8.1.3. Company snapshot
- 8.1.4. Operating business segments
- 8.1.5. Product portfolio
- 8.1.6. Key strategic moves and developments
- 8.2. GAF.
- 8.2.1. Company overview
- 8.2.2. Key executives
- 8.2.3. Company snapshot
- 8.2.4. Operating business segments
- 8.2.5. Product portfolio
- 8.3. Soprema
- 8.3.1. Company overview
- 8.3.2. Key executives
- 8.3.3. Company snapshot
- 8.3.4. Operating business segments
- 8.3.5. Product portfolio
- 8.4. Sika AG
- 8.4.1. Company overview
- 8.4.2. Key executives
- 8.4.3. Company snapshot
- 8.4.4. Operating business segments
- 8.4.5. Product portfolio
- 8.4.6. Business performance
- 8.4.7. Key strategic moves and developments
- 8.5. Carlisle Companies Inc.
- 8.5.1. Company overview
- 8.5.2. Key executives
- 8.5.3. Company snapshot
- 8.5.4. Operating business segments
- 8.5.5. Product portfolio
- 8.5.6. Business performance
- 8.6. GCP Applied Technologies Inc.
- 8.6.1. Company overview
- 8.6.2. Key executives
- 8.6.3. Company snapshot
- 8.6.4. Operating business segments
- 8.6.5. Product portfolio
- 8.6.6. Business performance
- 8.7. RPM International Inc.
- 8.7.1. Company overview
- 8.7.2. Key executives
- 8.7.3. Company snapshot
- 8.7.4. Operating business segments
- 8.7.5. Product portfolio
- 8.7.6. Business performance
- 8.8. HOLCIM
- 8.8.1. Company overview
- 8.8.2. Key executives
- 8.8.3. Company snapshot
- 8.8.4. Operating business segments
- 8.8.5. Product portfolio
- 8.8.6. Business performance
- 8.8.7. Key strategic moves and developments
- 8.9. BASF SE
- 8.9.1. Company overview
- 8.9.2. Key executives
- 8.9.3. Company snapshot
- 8.9.4. Operating business segments
- 8.9.5. Product portfolio
- 8.9.6. Business performance
- 8.9.7. Key strategic moves and developments
- 8.10. Dow
- 8.10.1. Company overview
- 8.10.2. Key executives
- 8.10.3. Company snapshot
- 8.10.4. Operating business segments
- 8.10.5. Product portfolio
- 8.10.6. Business performance
LIST OF TABLES
- TABLE 01. GLOBAL WATERPROOFING PRODUCTS MARKET, BY PRODUCT TYPE, 2019-2033 ($MILLION)
- TABLE 02. WATERPROOFING PRODUCTS MARKET FOR WATERPROOF PAINTS, BY REGION, 2019-2033 ($MILLION)
- TABLE 03. WATERPROOFING PRODUCTS MARKET FOR POLYMER WATERPROOF SHEETS, BY REGION, 2019-2033 ($MILLION)
- TABLE 04. WATERPROOFING PRODUCTS MARKET FOR RIGID WATERPROOF MATERIALS, BY REGION, 2019-2033 ($MILLION)
- TABLE 05. WATERPROOFING PRODUCTS MARKET FOR ASPHALT WATERPROOF ROLLS, BY REGION, 2019-2033 ($MILLION)
- TABLE 06. WATERPROOFING PRODUCTS MARKET FOR BUILDING SEAL WATERPROOF MATERIALS, BY REGION, 2019-2033 ($MILLION)
- TABLE 07. WATERPROOFING PRODUCTS MARKET FOR OTHERS, BY REGION, 2019-2033 ($MILLION)
- TABLE 08. GLOBAL WATERPROOFING PRODUCTS MARKET, BY APPLICATION, 2019-2033 ($MILLION)
- TABLE 09. WATERPROOFING PRODUCTS MARKET FOR ROOFING AND WALLS, BY REGION, 2019-2033 ($MILLION)
- TABLE 10. WATERPROOFING PRODUCTS MARKET FOR FLOORS AND BASEMENTS, BY REGION, 2019-2033 ($MILLION)
- TABLE 11. WATERPROOFING PRODUCTS MARKET FOR BRIDGES AND HIGHWAYS, BY REGION, 2019-2033 ($MILLION)
- TABLE 12. WATERPROOFING PRODUCTS MARKET FOR WATER AND WASTE MANAGEMENT, BY REGION, 2019-2033 ($MILLION)
- TABLE 13. WATERPROOFING PRODUCTS MARKET FOR TUNNEL LINERS, BY REGION, 2019-2033 ($MILLION)
- TABLE 14. WATERPROOFING PRODUCTS MARKET FOR OTHERS, BY REGION, 2019-2033 ($MILLION)
- TABLE 15. WATERPROOFING PRODUCTS MARKET, BY REGION, 2019-2033 ($MILLION)
- TABLE 16. NORTH AMERICA WATERPROOFING PRODUCTS MARKET, BY PRODUCT TYPE, 2019-2033 ($MILLION)
- TABLE 17. NORTH AMERICA WATERPROOFING PRODUCTS MARKET, BY APPLICATION, 2019-2033 ($MILLION)
- TABLE 18. NORTH AMERICA WATERPROOFING PRODUCTS MARKET, BY COUNTRY, 2019-2033 ($MILLION)
- TABLE 19. U.S. WATERPROOFING PRODUCTS MARKET, BY PRODUCT TYPE, 2019-2033 ($MILLION)
- TABLE 20. U.S. WATERPROOFING PRODUCTS MARKET, BY APPLICATION, 2019-2033 ($MILLION)
- TABLE 21. MEXICO WATERPROOFING PRODUCTS MARKET, BY PRODUCT TYPE, 2019-2033 ($MILLION)
- TABLE 22. MEXICO WATERPROOFING PRODUCTS MARKET, BY APPLICATION, 2019-2033 ($MILLION)
- TABLE 23. CANADA WATERPROOFING PRODUCTS MARKET, BY PRODUCT TYPE, 2019-2033 ($MILLION)
- TABLE 24. CANADA WATERPROOFING PRODUCTS MARKET, BY APPLICATION, 2019-2033 ($MILLION)
- TABLE 25. EUROPE WATERPROOFING PRODUCTS MARKET, BY PRODUCT TYPE, 2019-2033 ($MILLION)
- TABLE 26. EUROPE WATERPROOFING PRODUCTS MARKET, BY APPLICATION, 2019-2033 ($MILLION)
- TABLE 27. EUROPE WATERPROOFING PRODUCTS MARKET, BY COUNTRY, 2019-2033 ($MILLION)
- TABLE 28. GERMANY WATERPROOFING PRODUCTS MARKET, BY PRODUCT TYPE, 2019-2033 ($MILLION)
- TABLE 29. GERMANY WATERPROOFING PRODUCTS MARKET, BY APPLICATION, 2019-2033 ($MILLION)
- TABLE 30. FRANCE WATERPROOFING PRODUCTS MARKET, BY PRODUCT TYPE, 2019-2033 ($MILLION)
- TABLE 31. FRANCE WATERPROOFING PRODUCTS MARKET, BY APPLICATION, 2019-2033 ($MILLION)
- TABLE 32. UK WATERPROOFING PRODUCTS MARKET, BY PRODUCT TYPE, 2019-2033 ($MILLION)
- TABLE 33. UK WATERPROOFING PRODUCTS MARKET, BY APPLICATION, 2019-2033 ($MILLION)
- TABLE 34. REST OF EUROPE WATERPROOFING PRODUCTS MARKET, BY PRODUCT TYPE, 2019-2033 ($MILLION)
- TABLE 35. REST OF EUROPE WATERPROOFING PRODUCTS MARKET, BY APPLICATION, 2019-2033 ($MILLION)
- TABLE 36. ASIA-PACIFIC WATERPROOFING PRODUCTS MARKET, BY PRODUCT TYPE, 2019-2033 ($MILLION)
- TABLE 37. ASIA-PACIFIC WATERPROOFING PRODUCTS MARKET, BY APPLICATION, 2019-2033 ($MILLION)
- TABLE 38. ASIA-PACIFIC WATERPROOFING PRODUCTS MARKET, BY COUNTRY, 2019-2033 ($MILLION)
- TABLE 39. CHINA WATERPROOFING PRODUCTS MARKET, BY PRODUCT TYPE, 2019-2033 ($MILLION)
- TABLE 40. CHINA WATERPROOFING PRODUCTS MARKET, BY APPLICATION, 2019-2033 ($MILLION)
- TABLE 41. JAPAN WATERPROOFING PRODUCTS MARKET, BY PRODUCT TYPE, 2019-2033 ($MILLION)
- TABLE 42. JAPAN WATERPROOFING PRODUCTS MARKET, BY APPLICATION, 2019-2033 ($MILLION)
- TABLE 43. INDIA WATERPROOFING PRODUCTS MARKET, BY PRODUCT TYPE, 2019-2033 ($MILLION)
- TABLE 44. INDIA WATERPROOFING PRODUCTS MARKET, BY APPLICATION, 2019-2033 ($MILLION)
- TABLE 45. INDONESIA WATERPROOFING PRODUCTS MARKET, BY PRODUCT TYPE, 2019-2033 ($MILLION)
- TABLE 46. INDONESIA WATERPROOFING PRODUCTS MARKET, BY APPLICATION, 2019-2033 ($MILLION)
- TABLE 47. VIETNAM WATERPROOFING PRODUCTS MARKET, BY PRODUCT TYPE, 2019-2033 ($MILLION)
- TABLE 48. VIETNAM WATERPROOFING PRODUCTS MARKET, BY APPLICATION, 2019-2033 ($MILLION)
- TABLE 49. REST OF ASIA-PACIFIC WATERPROOFING PRODUCTS MARKET, BY PRODUCT TYPE, 2019-2033 ($MILLION)
- TABLE 50. REST OF ASIA-PACIFIC WATERPROOFING PRODUCTS MARKET, BY APPLICATION, 2019-2033 ($MILLION)
- TABLE 51. SOUTH AMERICA WATERPROOFING PRODUCTS MARKET, BY PRODUCT TYPE, 2019-2033 ($MILLION)
- TABLE 52. SOUTH AMERICA WATERPROOFING PRODUCTS MARKET, BY APPLICATION, 2019-2033 ($MILLION)
- TABLE 53. SOUTH AMERICA WATERPROOFING PRODUCTS MARKET, BY COUNTRY, 2019-2033 ($MILLION)
- TABLE 54. BRAZIL WATERPROOFING PRODUCTS MARKET, BY PRODUCT TYPE, 2019-2033 ($MILLION)
- TABLE 55. BRAZIL WATERPROOFING PRODUCTS MARKET, BY APPLICATION, 2019-2033 ($MILLION)
- TABLE 56. ARGENTINA WATERPROOFING PRODUCTS MARKET, BY PRODUCT TYPE, 2019-2033 ($MILLION)
- TABLE 57. ARGENTINA WATERPROOFING PRODUCTS MARKET, BY APPLICATION, 2019-2033 ($MILLION)
- TABLE 58. CHILE WATERPROOFING PRODUCTS MARKET, BY PRODUCT TYPE, 2019-2033 ($MILLION)
- TABLE 59. CHILE WATERPROOFING PRODUCTS MARKET, BY APPLICATION, 2019-2033 ($MILLION)
- TABLE 60. REST OF SOUTH AMERICA WATERPROOFING PRODUCTS MARKET, BY PRODUCT TYPE, 2019-2033 ($MILLION)
- TABLE 61. REST OF SOUTH AMERICA WATERPROOFING PRODUCTS MARKET, BY APPLICATION, 2019-2033 ($MILLION)
- TABLE 62. MIDDLE EAST AND AFRICA WATERPROOFING PRODUCTS MARKET, BY PRODUCT TYPE, 2019-2033 ($MILLION)
- TABLE 63. MIDDLE EAST AND AFRICA WATERPROOFING PRODUCTS MARKET, BY APPLICATION, 2019-2033 ($MILLION)
- TABLE 64. MIDDLE EAST AND AFRICA WATERPROOFING PRODUCTS MARKET, BY COUNTRY, 2019-2033 ($MILLION)
- TABLE 65. SOUTH AFRICA WATERPROOFING PRODUCTS MARKET, BY PRODUCT TYPE, 2019-2033 ($MILLION)
- TABLE 66. SOUTH AFRICA WATERPROOFING PRODUCTS MARKET, BY APPLICATION, 2019-2033 ($MILLION)
- TABLE 67. SAUDI ARABIA WATERPROOFING PRODUCTS MARKET, BY PRODUCT TYPE, 2019-2033 ($MILLION)
- TABLE 68. SAUDI ARABIA WATERPROOFING PRODUCTS MARKET, BY APPLICATION, 2019-2033 ($MILLION)
- TABLE 69. UAE WATERPROOFING PRODUCTS MARKET, BY PRODUCT TYPE, 2019-2033 ($MILLION)
- TABLE 70. UAE WATERPROOFING PRODUCTS MARKET, BY APPLICATION, 2019-2033 ($MILLION)
- TABLE 71. REST OF MIDDLE EAST AND AFRICA WATERPROOFING PRODUCTS MARKET, BY PRODUCT TYPE, 2019-2033 ($MILLION)
- TABLE 72. REST OF MIDDLE EAST AND AFRICA WATERPROOFING PRODUCTS MARKET, BY APPLICATION, 2019-2033 ($MILLION)
- TABLE 73. HENRY COMPANY: KEY EXECUTIVES
- TABLE 74. HENRY COMPANY: COMPANY SNAPSHOT
- TABLE 75. HENRY COMPANY: PRODUCT SEGMENTS
- TABLE 76. HENRY COMPANY: PRODUCT PORTFOLIO
- TABLE 77. HENRY COMPANY: KEY STRATERGIES
- TABLE 78. GAF.: KEY EXECUTIVES
- TABLE 79. GAF.: COMPANY SNAPSHOT
- TABLE 80. GAF.: PRODUCT SEGMENTS
- TABLE 81. GAF.: PRODUCT PORTFOLIO
- TABLE 82. SOPREMA: KEY EXECUTIVES
- TABLE 83. SOPREMA: COMPANY SNAPSHOT
- TABLE 84. SOPREMA: PRODUCT SEGMENTS
- TABLE 85. SOPREMA: PRODUCT PORTFOLIO
- TABLE 86. SIKA AG: KEY EXECUTIVES
- TABLE 87. SIKA AG: COMPANY SNAPSHOT
- TABLE 88. SIKA AG: PRODUCT SEGMENTS
- TABLE 89. SIKA AG: PRODUCT PORTFOLIO
- TABLE 90. SIKA AG: KEY STRATERGIES
- TABLE 91. CARLISLE COMPANIES INC.: KEY EXECUTIVES
- TABLE 92. CARLISLE COMPANIES INC.: COMPANY SNAPSHOT
- TABLE 93. CARLISLE COMPANIES INC.: PRODUCT SEGMENTS
- TABLE 94. CARLISLE COMPANIES INC.: PRODUCT PORTFOLIO
- TABLE 95. GCP APPLIED TECHNOLOGIES INC.: KEY EXECUTIVES
- TABLE 96. GCP APPLIED TECHNOLOGIES INC.: COMPANY SNAPSHOT
- TABLE 97. GCP APPLIED TECHNOLOGIES INC.: PRODUCT SEGMENTS
- TABLE 98. GCP APPLIED TECHNOLOGIES INC.: PRODUCT PORTFOLIO
- TABLE 99. RPM INTERNATIONAL INC.: KEY EXECUTIVES
- TABLE 100. RPM INTERNATIONAL INC.: COMPANY SNAPSHOT
- TABLE 101. RPM INTERNATIONAL INC.: PRODUCT SEGMENTS
- TABLE 102. RPM INTERNATIONAL INC.: PRODUCT PORTFOLIO
- TABLE 103. HOLCIM: KEY EXECUTIVES
- TABLE 104. HOLCIM: COMPANY SNAPSHOT
- TABLE 105. HOLCIM: PRODUCT SEGMENTS
- TABLE 106. HOLCIM: PRODUCT PORTFOLIO
- TABLE 107. HOLCIM: KEY STRATERGIES
- TABLE 108. BASF SE: KEY EXECUTIVES
- TABLE 109. BASF SE: COMPANY SNAPSHOT
- TABLE 110. BASF SE: PRODUCT SEGMENTS
- TABLE 111. BASF SE: PRODUCT PORTFOLIO
- TABLE 112. BASF SE: KEY STRATERGIES
- TABLE 113. DOW: KEY EXECUTIVES
- TABLE 114. DOW: COMPANY SNAPSHOT
- TABLE 115. DOW: PRODUCT SEGMENTS
- TABLE 116. DOW: PRODUCT PORTFOLIO
LIST OF FIGURES
- FIGURE 01. WATERPROOFING PRODUCTS MARKET, 2019-2033
- FIGURE 02. SEGMENTATION OF WATERPROOFING PRODUCTS MARKET,2019-2033
- FIGURE 03. TOP IMPACTING FACTORS IN WATERPROOFING PRODUCTS MARKET (2019 TO 2033)
- FIGURE 04. TOP INVESTMENT POCKETS IN WATERPROOFING PRODUCTS MARKET (2023-2033)
- FIGURE 05. MODERATE BARGAINING POWER OF SUPPLIERS
- FIGURE 06. MODERATE THREAT OF NEW ENTRANTS
- FIGURE 07. LOW THREAT OF SUBSTITUTES
- FIGURE 08. HIGH INTENSITY OF RIVALRY
- FIGURE 09. MODERATE BARGAINING POWER OF BUYERS
- FIGURE 10. GLOBAL WATERPROOFING PRODUCTS MARKET:DRIVERS, RESTRAINTS AND OPPORTUNITIES
- FIGURE 11. IMPACT OF KEY REGULATION: WATERPROOFING PRODUCTS MARKET
- FIGURE 12. PATENT ANALYSIS BY COMPANY
- FIGURE 13. PATENT ANALYSIS BY COUNTRY
- FIGURE 14. REGULATORY GUIDELINES: WATERPROOFING PRODUCTS MARKET
- FIGURE 15. WATERPROOFING PRODUCTS MARKET, BY PRODUCT TYPE, 2019 AND 2033(%)
- FIGURE 16. COMPARATIVE SHARE ANALYSIS OF WATERPROOFING PRODUCTS MARKET FOR WATERPROOF PAINTS, BY COUNTRY 2019 AND 2033(%)
- FIGURE 17. COMPARATIVE SHARE ANALYSIS OF WATERPROOFING PRODUCTS MARKET FOR POLYMER WATERPROOF SHEETS, BY COUNTRY 2019 AND 2033(%)
- FIGURE 18. COMPARATIVE SHARE ANALYSIS OF WATERPROOFING PRODUCTS MARKET FOR RIGID WATERPROOF MATERIALS, BY COUNTRY 2019 AND 2033(%)
- FIGURE 19. COMPARATIVE SHARE ANALYSIS OF WATERPROOFING PRODUCTS MARKET FOR ASPHALT WATERPROOF ROLLS, BY COUNTRY 2019 AND 2033(%)
- FIGURE 20. COMPARATIVE SHARE ANALYSIS OF WATERPROOFING PRODUCTS MARKET FOR BUILDING SEAL WATERPROOF MATERIALS, BY COUNTRY 2019 AND 2033(%)
- FIGURE 21. COMPARATIVE SHARE ANALYSIS OF WATERPROOFING PRODUCTS MARKET FOR OTHERS, BY COUNTRY 2019 AND 2033(%)
- FIGURE 22. WATERPROOFING PRODUCTS MARKET, BY APPLICATION, 2019 AND 2033(%)
- FIGURE 23. COMPARATIVE SHARE ANALYSIS OF WATERPROOFING PRODUCTS MARKET FOR ROOFING AND WALLS, BY COUNTRY 2019 AND 2033(%)
- FIGURE 24. COMPARATIVE SHARE ANALYSIS OF WATERPROOFING PRODUCTS MARKET FOR FLOORS AND BASEMENTS, BY COUNTRY 2019 AND 2033(%)
- FIGURE 25. COMPARATIVE SHARE ANALYSIS OF WATERPROOFING PRODUCTS MARKET FOR BRIDGES AND HIGHWAYS, BY COUNTRY 2019 AND 2033(%)
- FIGURE 26. COMPARATIVE SHARE ANALYSIS OF WATERPROOFING PRODUCTS MARKET FOR WATER AND WASTE MANAGEMENT, BY COUNTRY 2019 AND 2033(%)
- FIGURE 27. COMPARATIVE SHARE ANALYSIS OF WATERPROOFING PRODUCTS MARKET FOR TUNNEL LINERS, BY COUNTRY 2019 AND 2033(%)
- FIGURE 28. COMPARATIVE SHARE ANALYSIS OF WATERPROOFING PRODUCTS MARKET FOR OTHERS, BY COUNTRY 2019 AND 2033(%)
- FIGURE 29. WATERPROOFING PRODUCTS MARKET BY REGION, 2019 AND 2033(%)
- FIGURE 30. U.S. WATERPROOFING PRODUCTS MARKET, 2019-2033 ($MILLION)
- FIGURE 31. MEXICO WATERPROOFING PRODUCTS MARKET, 2019-2033 ($MILLION)
- FIGURE 32. CANADA WATERPROOFING PRODUCTS MARKET, 2019-2033 ($MILLION)
- FIGURE 33. GERMANY WATERPROOFING PRODUCTS MARKET, 2019-2033 ($MILLION)
- FIGURE 34. FRANCE WATERPROOFING PRODUCTS MARKET, 2019-2033 ($MILLION)
- FIGURE 35. UK WATERPROOFING PRODUCTS MARKET, 2019-2033 ($MILLION)
- FIGURE 36. REST OF EUROPE WATERPROOFING PRODUCTS MARKET, 2019-2033 ($MILLION)
- FIGURE 37. CHINA WATERPROOFING PRODUCTS MARKET, 2019-2033 ($MILLION)
- FIGURE 38. JAPAN WATERPROOFING PRODUCTS MARKET, 2019-2033 ($MILLION)
- FIGURE 39. INDIA WATERPROOFING PRODUCTS MARKET, 2019-2033 ($MILLION)
- FIGURE 40. INDONESIA WATERPROOFING PRODUCTS MARKET, 2019-2033 ($MILLION)
- FIGURE 41. VIETNAM WATERPROOFING PRODUCTS MARKET, 2019-2033 ($MILLION)
- FIGURE 42. REST OF ASIA-PACIFIC WATERPROOFING PRODUCTS MARKET, 2019-2033 ($MILLION)
- FIGURE 43. BRAZIL WATERPROOFING PRODUCTS MARKET, 2019-2033 ($MILLION)
- FIGURE 44. ARGENTINA WATERPROOFING PRODUCTS MARKET, 2019-2033 ($MILLION)
- FIGURE 45. CHILE WATERPROOFING PRODUCTS MARKET, 2019-2033 ($MILLION)
- FIGURE 46. REST OF SOUTH AMERICA WATERPROOFING PRODUCTS MARKET, 2019-2033 ($MILLION)
- FIGURE 47. SOUTH AFRICA WATERPROOFING PRODUCTS MARKET, 2019-2033 ($MILLION)
- FIGURE 48. SAUDI ARABIA WATERPROOFING PRODUCTS MARKET, 2019-2033 ($MILLION)
- FIGURE 49. UAE WATERPROOFING PRODUCTS MARKET, 2019-2033 ($MILLION)
- FIGURE 50. REST OF MIDDLE EAST AND AFRICA WATERPROOFING PRODUCTS MARKET, 2019-2033 ($MILLION)
- FIGURE 51. TOP WINNING STRATEGIES, BY YEAR (2020-2023)
- FIGURE 52. TOP WINNING STRATEGIES, BY DEVELOPMENT (2020-2023)
- FIGURE 53. TOP WINNING STRATEGIES, BY COMPANY (2020-2023)
- FIGURE 54. PRODUCT MAPPING OF TOP 10 PLAYERS
- FIGURE 55. COMPETITIVE DASHBOARD
- FIGURE 56. COMPETITIVE HEATMAP: WATERPROOFING PRODUCTS MARKET
- FIGURE 57. TOP PLAYER POSITIONING, 2019
- FIGURE 58. SIKA AG: NET SALES, 2020-2022 ($MILLION)
- FIGURE 59. SIKA AG: REVENUE SHARE BY SEGMENT, 2022 (%)
- FIGURE 60. SIKA AG: REVENUE SHARE BY REGION, 2022 (%)
- FIGURE 61. CARLISLE COMPANIES INC.: NET REVENUE, 2020-2022 ($MILLION)
- FIGURE 62. CARLISLE COMPANIES INC.: REVENUE SHARE BY REGION, 2022 (%)
- FIGURE 63. GCP APPLIED TECHNOLOGIES INC.: NET REVENUE, 2019-2021 ($MILLION)
- FIGURE 64. GCP APPLIED TECHNOLOGIES INC.: REVENUE SHARE BY SEGMENT, 2021 (%)
- FIGURE 65. GCP APPLIED TECHNOLOGIES INC.: REVENUE SHARE BY REGION, 2021 (%)
- FIGURE 66. RPM INTERNATIONAL INC.: NET REVENUE, 2020-2022 ($MILLION)
- FIGURE 67. RPM INTERNATIONAL INC.: REVENUE SHARE BY SEGMENT, 2022 (%)
- FIGURE 68. RPM INTERNATIONAL INC.: REVENUE SHARE BY REGION, 2022 (%)
- FIGURE 69. HOLCIM: NET SALES, 2020-2022 ($MILLION)
- FIGURE 70. HOLCIM: RESEARCH & DEVELOPMENT EXPENDITURE, 2020-2022 ($MILLION)
- FIGURE 71. HOLCIM: REVENUE SHARE BY SEGMENT, 2022 (%)
- FIGURE 72. HOLCIM: REVENUE SHARE BY REGION, 2022 (%)
- FIGURE 73. BASF SE: NET SALES, 2020-2022 ($MILLION)
- FIGURE 74. BASF SE: RESEARCH & DEVELOPMENT EXPENDITURE, 2020-2022 ($MILLION)
- FIGURE 75. BASF SE: REVENUE SHARE BY SEGMENT, 2022 (%)
- FIGURE 76. BASF SE: REVENUE SHARE BY REGION, 2022 (%)
- FIGURE 77. DOW: NET SALES, 2020-2022 ($MILLION)
- FIGURE 78. DOW: REVENUE SHARE BY SEGMENT, 2022 (%)
- FIGURE 79. DOW: REVENUE SHARE BY REGION, 2022 (%)
 防水系統市場 – 2024 年至 2029 年預測
 2024年世界防水劑市場報告
 防水外加劑市場:全球與區域分析(2023-2033)
 濕室防水解決方案的全球市場:市場規模、佔有率、趨勢分析、機會和預測(2019-2029)
 全球防水外加劑市場:按類型、應用和地區分類 – 預測(截至 2028 年)
 混凝土應用結晶防水市場(類型:整體結晶防水和局部結晶防水)- 2023-2031 年全球產業分析、規模、佔有率、成長、趨勢和預測
 全球結晶防水市場研究報告 - 2023年至2030年產業分析、規模、佔有率、成長、趨勢與預測
 防水外加劑市場:按類型、配方、應用分類 - 2023-2030 年全球預測
 濕室防水解決方案市場 - 2018-2028 年全球產業規模、佔有率、趨勢、機會和預測,按類型、原料、地區和競爭細分
 濕室防水解決方案的全球市場(~2028):按類型(織物/羊毛背襯膜、防水基板、淋浴盤襯墊)、原料(聚氨酯、PVC、聚脲、丙烯酸、ABS、聚苯乙烯)、應用、地區