


 |
市場調查報告書
商品編碼
1446417
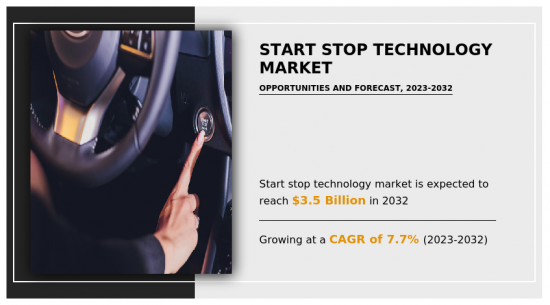
起停技術市場:按類型、按應用分類:2023-2032 年全球機會分析與產業預測Start Stop Technology Market By Type (Enhanced Starter, Belt-Driven Alternator Starter, Direct Starter, Integrated Starter Generator ), By Application : Global Opportunity Analysis and Industry Forecast, 2023-2032 |
||||||
啟動/停止技術代表了汽車行業的模式轉移,改變了汽車的駕駛方式並顯著提高了燃油效率。
這項非凡的發明也被稱為怠速熄火、微混合或啟動停止技術,當車輛停止時(例如在紅綠燈處或交通堵塞時)會自動關閉引擎,並在加速因素時無縫重新啟動踩下踏板。其主要目標是減少怠速熄火期間不必要的燃料使用和排放,為更綠色、更永續的交通未來做出貢獻。
啟停技術開發和整合的主要驅動力之一是人們對環境永續性的認知不斷增強。隨著社會越來越意識到氣候變遷和減少溫室氣體的必要性,汽車製造商被要求採用環保解決方案。啟停技術透過顯著減少車輛等待時間、減少消費量和排放解決這個問題。為了解決汽車產業對環境的影響,世界各地的監管機構推出了嚴格的燃油經濟性和排放標準。啟停技術已成為製造商滿足這些法律並避免巨額罰款的重要工具。該技術透過在車輛停車時自動關閉引擎來幫助製造商實現更高的燃油效率和更低的排放氣體。
頻繁啟動和停止引擎可能會導致振動和噪音,讓某些促銷員感到不舒服。此外,引擎突然重新啟動可能會導致加速輕微延遲並損害駕駛平穩性。這在需要快速且完美加速的情況下尤其重要,例如併入高速公路或在交通堵塞中行駛。
實施啟停技術需要複雜的控制系統、智慧感測器和創新演算法,代表汽車工程的重大發展。製造商正在投資研發,以提高怠速熄火系統的可靠性和效率,這些系統通常與再生煞車和輕度混合系統等其他先進技術結合使用。這種創新驅動力正在推動汽車技術的發展,創造了一個競爭激烈的產業,各家公司競相生產摩擦更小、反應更靈敏、更聰明的啟停系統。因此,技術突破不僅改變汽車產業,也為跨產業合作和夥伴關係創造了機會。此外,啟停技術的引入凸顯了現代車輛對軟體整合的需求。
封鎖和旅行限制大大減少了駕駛活動。怠速熄火系統潛在的燃油節省並不顯著,因為道路上的汽車較少,都市區的交通堵塞也較少。由於無需反覆停止和重新啟動引擎,因此削弱了該技術明顯的直接效益,從而降低了它對客戶和生產商的吸引力。由於經濟不穩定並專注於基本支出,消費者偏好在整個大流行期間發生了變化。許多潛在的購車者對安全性、可靠性和價格等品質比對燃油經濟性更感興趣。
相關人員的主要利益
- 本報告定量分析了 2022 年至 2032 年啟停技術市場分析的細分市場、當前趨勢、估計/趨勢和動態,並確定了一般啟停技術市場的機會。
- 我們提供市場研究以及與市場促進因素、市場限制和市場機會相關的資訊。
- 波特的五力分析揭示了買家和供應商的潛力,幫助相關人員做出利潤驅動的業務決策並加強供應商和買家網路。
- 對啟停技術市場細分的詳細分析有助於識別市場機會。
- 每個地區的主要國家都根據其對全球市場的收益貢獻繪製了地圖。
- 市場參與者定位有助於基準化分析,並提供對市場參與者當前地位的清晰了解。
- 該報告包括對區域和全球啟動停止技術市場趨勢、主要企業、細分市場、應用領域和市場成長策略的分析。
可以使用此報告進行客製化
- 製造能力
- 投資機會
- 科技趨勢分析
- 打入市場策略
- 新品開發/各大廠商產品矩陣
- 痛點分析
- 監管指引
- 針對客戶興趣的其他公司簡介
- 按國家或地區進行的附加分析 – 市場規模和預測
- 十字交叉細分市場分析—市場規模與預測
- 歷史市場資料
- 主要參與者的詳細資料(Excel格式,包括位置、聯絡資訊、供應商/供應商網路等)
- 客戶/消費者/原料供應商名單-價值鏈分析
- SWOT分析
目錄
第1章簡介
第 2 章執行摘要
第3章市場概況
- 市場定義和範圍
- 主要發現
- 影響因素
- 主要投資機會
- 波特五力分析
- 市場動態
- 促進因素
- 抑制因素
- 機會
- 市場佔有率分析
- 價值鏈分析
- 監管指引
- 專利情況
第4章啟停技術市場:按類型
- 概述
- 增強型啟動器
- 皮帶驅動交流發電機起動機 (BAS)
- 直接啟動器
- 整合啟動發電機 (ISG)
第5章啟停技術市場:依應用分類
- 概述
- 小客車
- 商用車
第6章起停技術市場:按地區
- 概述
- 北美洲
- 美國
- 加拿大
- 墨西哥
- 歐洲
- 德國
- 英國
- 法國
- 西班牙
- 義大利
- 其他
- 亞太地區
- 中國
- 日本
- 印度
- 韓國
- 澳洲
- 其他
- 拉丁美洲/中東/非洲
- 巴西
- 沙烏地阿拉伯
- UAE
- 南非
- 其他
第7章 競爭格局
- 介紹
- 關鍵成功策略
- 10家主要企業產品圖譜
- 競爭對手儀表板
- 競爭熱圖
- 2022年主要企業定位
第8章 公司簡介
- Continental AG
- Robert Bosch GmbH
- AISIN SEIKI Co., Ltd.
- Delphi Automotive LLP
- BorgWarner Inc.
- hitachi automotive systems, ltd.
- DENSO CORPORATION
- Johnson Controls
- Valeo
Start-stop technology represents a paradigm shift in the automotive industry, transforming how vehicles operate and significantly enhancing fuel efficiency. This remarkable invention, also known as idle-stop, micro-hybrid, or stop-start technology, automatically shuts off the engine when the vehicle comes to a halt, such as at traffic lights or in heavy traffic, and restarts it seamlessly when the driver presses the pedal. The major goal is to reduce unnecessary fuel use and exhaust emissions during idle periods, therefore contributing to a greener and more sustainable transportation future.
One of the primary driving factors for the development and integration of start-stop technology is a growing awareness regarding environmental sustainability. As public awareness regarding climate change and the need to reduce greenhouse gases develops, automakers are being pressured to incorporate eco-friendly solutions. Start-stop technology addresses this issue by drastically reducing the amount of time a vehicle spends waiting, resulting in lower fuel consumption and emissions. To combat the environmental impact of the automobile industry, worldwide regulatory organizations implemented stringent fuel efficiency and emission standards. Start-stop technology has become an indispensable tool for producers to meet these laws and avoid huge fines. This technology assists manufacturers in achieving higher fuel efficiency and lower emissions by automatically turning off the engine while the vehicle is parked.
The engine's frequent starting and stopping may result in apparent vibrations and noise, which may be unpleasant for certain drivers. Rapid engine restarts may also result in a small lag in acceleration, which reduces the smoothness of the driving experience. This is especially essential in situations where quick and perfect acceleration is required, such as merging into highways or driving through crowded traffic.
Implementing start-stop technology necessitates complicated control systems, intelligent sensors, and innovative algorithms, and represents an important development in automotive engineering. Manufacturers are investing in R&D to increase the reliability and efficiency of start-stop systems, which are typically paired with other advanced technologies like regenerative braking and mild-hybrid systems. This urge for innovation is pushing the evolution of automotive technology, creating a competitive industry in which enterprises compete to produce more frictionless, responsive, and intelligent start-stop systems. Therefore, technological breakthroughs are not only changing the automotive industry, but also creating opportunities for cross-industry collaborations and partnerships. Furthermore, the introduction of start-stop technology emphasizes the need of software integration in modern automobiles.
Lockdowns and travel restrictions reduced driving activity significantly. The potential fuel savings from start-stop systems were not as large since there were fewer automobiles on the road and less urban congestion. The elimination of the need for repeated engine stops and restarts diminished the obvious immediate benefits of this technology, making it less enticing to both customers and producers. Because of economic instability and a focus on essential spending, consumer preferences changed throughout the pandemic. Many potential car buyers were more concerned with qualities like safety, dependability, and price than with fuel efficiency.
The key players profiled in this report include Valeo, Robert Bosch GmbH, Continental AG, DENSO CORPORATION, Mitsubishi Electric Corporation, BorgWarner Inc., AISIN SEIKI Co., Ltd., Delphi Automotive LLP, Johnson Controls, and Hitachi Automotive Systems, Ltd.
Key Benefits For Stakeholders
- This report provides a quantitative analysis of the market segments, current trends, estimations, and dynamics of the start stop technology market analysis from 2022 to 2032 to identify the prevailing start stop technology market opportunities.
- The market research is offered along with information related to key drivers, restraints, and opportunities.
- Porter's five forces analysis highlights the potency of buyers and suppliers to enable stakeholders make profit-oriented business decisions and strengthen their supplier-buyer network.
- In-depth analysis of the start stop technology market segmentation assists to determine the prevailing market opportunities.
- Major countries in each region are mapped according to their revenue contribution to the global market.
- Market player positioning facilitates benchmarking and provides a clear understanding of the present position of the market players.
- The report includes the analysis of the regional as well as global start stop technology market trends, key players, market segments, application areas, and market growth strategies.
Additional benefits you will get with this purchase are:
- Quarterly Update and* (only available with a corporate license, on listed price)
- 5 additional Company Profile of client Choice pre- or Post-purchase, as a free update.
- Free Upcoming Version on the Purchase of Five and Enterprise User License.
- 16 analyst hours of support* (post-purchase, if you find additional data requirements upon review of the report, you may receive support amounting to 16 analyst hours to solve questions, and post-sale queries)
- 15% Free Customization* (in case the scope or segment of the report does not match your requirements, 15% is equivalent to 3 working days of free work, applicable once)
- Free data Pack on the Five and Enterprise User License. (Excel version of the report)
- Free Updated report if the report is 6-12 months old or older.
- 24-hour priority response*
- Free Industry updates and white papers.
Possible Customization with this report (with additional cost and timeline, please talk to the sales executive to know more)
- Manufacturing Capacity
- Investment Opportunities
- Technology Trend Analysis
- Go To Market Strategy
- New Product Development/ Product Matrix of Key Players
- Pain Point Analysis
- Regulatory Guidelines
- Additional company profiles with specific to client's interest
- Additional country or region analysis- market size and forecast
- Criss-cross segment analysis- market size and forecast
- Historic market data
- Key player details (including location, contact details, supplier/vendor network etc. in excel format)
- List of customers/consumers/raw material suppliers- value chain analysis
- SWOT Analysis
Key Market Segments
By Type
- Enhanced Starter
- Belt-Driven Alternator Starter (BAS)
- Direct Starter
- Integrated Starter Generator (ISG)
By Application
- Commercial Car
- Passenger Car
By Region
- North America
- U.S.
- Canada
- Mexico
- Europe
- Germany
- UK
- France
- Spain
- Italy
- Rest of Europe
- Asia-Pacific
- China
- Japan
- India
- South Korea
- Australia
- Rest of Asia-Pacific
- LAMEA
- Brazil
- Saudi Arabia
- UAE
- South Africa
- Rest of LAMEA
Key Market Players:
- Continental AG
- Robert Bosch GmbH
- AISIN SEIKI Co., Ltd.
- Delphi Automotive LLP
- BorgWarner Inc.
- hitachi automotive systems, ltd.
- DENSO CORPORATION
- Johnson Controls
- Valeo
TABLE OF CONTENTS
CHAPTER 1: INTRODUCTION
- 1.1. Report description
- 1.2. Key market segments
- 1.3. Key benefits to the stakeholders
- 1.4. Research methodology
- 1.4.1. Primary research
- 1.4.2. Secondary research
- 1.4.3. Analyst tools and models
CHAPTER 2: EXECUTIVE SUMMARY
- 2.1. CXO Perspective
CHAPTER 3: MARKET OVERVIEW
- 3.1. Market definition and scope
- 3.2. Key findings
- 3.2.1. Top impacting factors
- 3.2.2. Top investment pockets
- 3.3. Porter's five forces analysis
- 3.4. Market dynamics
- 3.4.1. Drivers
- 3.4.2. Restraints
- 3.4.3. Opportunities
- 3.5. Market Share Analysis
- 3.6. Value Chain Analysis
- 3.7. Regulatory Guidelines
- 3.8. Patent Landscape
CHAPTER 4: START STOP TECHNOLOGY MARKET, BY TYPE
- 4.1. Overview
- 4.1.1. Market size and forecast
- 4.2. Enhanced Starter
- 4.2.1. Key market trends, growth factors and opportunities
- 4.2.2. Market size and forecast, by region
- 4.2.3. Market share analysis by country
- 4.3. Belt-Driven Alternator Starter (BAS)
- 4.3.1. Key market trends, growth factors and opportunities
- 4.3.2. Market size and forecast, by region
- 4.3.3. Market share analysis by country
- 4.4. Direct Starter
- 4.4.1. Key market trends, growth factors and opportunities
- 4.4.2. Market size and forecast, by region
- 4.4.3. Market share analysis by country
- 4.5. Integrated Starter Generator (ISG)
- 4.5.1. Key market trends, growth factors and opportunities
- 4.5.2. Market size and forecast, by region
- 4.5.3. Market share analysis by country
CHAPTER 5: START STOP TECHNOLOGY MARKET, BY APPLICATION
- 5.1. Overview
- 5.1.1. Market size and forecast
- 5.2. Passenger Car
- 5.2.1. Key market trends, growth factors and opportunities
- 5.2.2. Market size and forecast, by region
- 5.2.3. Market share analysis by country
- 5.3. Commercial Car
- 5.3.1. Key market trends, growth factors and opportunities
- 5.3.2. Market size and forecast, by region
- 5.3.3. Market share analysis by country
CHAPTER 6: START STOP TECHNOLOGY MARKET, BY REGION
- 6.1. Overview
- 6.1.1. Market size and forecast By Region
- 6.2. North America
- 6.2.1. Key market trends, growth factors and opportunities
- 6.2.2. Market size and forecast, by Type
- 6.2.3. Market size and forecast, by Application
- 6.2.4. Market size and forecast, by country
- 6.2.4.1. U.S.
- 6.2.4.1.1. Market size and forecast, by Type
- 6.2.4.1.2. Market size and forecast, by Application
- 6.2.4.2. Canada
- 6.2.4.2.1. Market size and forecast, by Type
- 6.2.4.2.2. Market size and forecast, by Application
- 6.2.4.3. Mexico
- 6.2.4.3.1. Market size and forecast, by Type
- 6.2.4.3.2. Market size and forecast, by Application
- 6.3. Europe
- 6.3.1. Key market trends, growth factors and opportunities
- 6.3.2. Market size and forecast, by Type
- 6.3.3. Market size and forecast, by Application
- 6.3.4. Market size and forecast, by country
- 6.3.4.1. Germany
- 6.3.4.1.1. Market size and forecast, by Type
- 6.3.4.1.2. Market size and forecast, by Application
- 6.3.4.2. UK
- 6.3.4.2.1. Market size and forecast, by Type
- 6.3.4.2.2. Market size and forecast, by Application
- 6.3.4.3. France
- 6.3.4.3.1. Market size and forecast, by Type
- 6.3.4.3.2. Market size and forecast, by Application
- 6.3.4.4. Spain
- 6.3.4.4.1. Market size and forecast, by Type
- 6.3.4.4.2. Market size and forecast, by Application
- 6.3.4.5. Italy
- 6.3.4.5.1. Market size and forecast, by Type
- 6.3.4.5.2. Market size and forecast, by Application
- 6.3.4.6. Rest of Europe
- 6.3.4.6.1. Market size and forecast, by Type
- 6.3.4.6.2. Market size and forecast, by Application
- 6.4. Asia-Pacific
- 6.4.1. Key market trends, growth factors and opportunities
- 6.4.2. Market size and forecast, by Type
- 6.4.3. Market size and forecast, by Application
- 6.4.4. Market size and forecast, by country
- 6.4.4.1. China
- 6.4.4.1.1. Market size and forecast, by Type
- 6.4.4.1.2. Market size and forecast, by Application
- 6.4.4.2. Japan
- 6.4.4.2.1. Market size and forecast, by Type
- 6.4.4.2.2. Market size and forecast, by Application
- 6.4.4.3. India
- 6.4.4.3.1. Market size and forecast, by Type
- 6.4.4.3.2. Market size and forecast, by Application
- 6.4.4.4. South Korea
- 6.4.4.4.1. Market size and forecast, by Type
- 6.4.4.4.2. Market size and forecast, by Application
- 6.4.4.5. Australia
- 6.4.4.5.1. Market size and forecast, by Type
- 6.4.4.5.2. Market size and forecast, by Application
- 6.4.4.6. Rest of Asia-Pacific
- 6.4.4.6.1. Market size and forecast, by Type
- 6.4.4.6.2. Market size and forecast, by Application
- 6.5. LAMEA
- 6.5.1. Key market trends, growth factors and opportunities
- 6.5.2. Market size and forecast, by Type
- 6.5.3. Market size and forecast, by Application
- 6.5.4. Market size and forecast, by country
- 6.5.4.1. Brazil
- 6.5.4.1.1. Market size and forecast, by Type
- 6.5.4.1.2. Market size and forecast, by Application
- 6.5.4.2. Saudi Arabia
- 6.5.4.2.1. Market size and forecast, by Type
- 6.5.4.2.2. Market size and forecast, by Application
- 6.5.4.3. UAE
- 6.5.4.3.1. Market size and forecast, by Type
- 6.5.4.3.2. Market size and forecast, by Application
- 6.5.4.4. South Africa
- 6.5.4.4.1. Market size and forecast, by Type
- 6.5.4.4.2. Market size and forecast, by Application
- 6.5.4.5. Rest of LAMEA
- 6.5.4.5.1. Market size and forecast, by Type
- 6.5.4.5.2. Market size and forecast, by Application
CHAPTER 7: COMPETITIVE LANDSCAPE
- 7.1. Introduction
- 7.2. Top winning strategies
- 7.3. Product mapping of top 10 player
- 7.4. Competitive dashboard
- 7.5. Competitive heatmap
- 7.6. Top player positioning, 2022
CHAPTER 8: COMPANY PROFILES
- 8.1. Continental AG
- 8.1.1. Company overview
- 8.1.2. Key executives
- 8.1.3. Company snapshot
- 8.1.4. Operating business segments
- 8.1.5. Product portfolio
- 8.1.6. Business performance
- 8.1.7. Key strategic moves and developments
- 8.2. Robert Bosch GmbH
- 8.2.1. Company overview
- 8.2.2. Key executives
- 8.2.3. Company snapshot
- 8.2.4. Operating business segments
- 8.2.5. Product portfolio
- 8.2.6. Business performance
- 8.2.7. Key strategic moves and developments
- 8.3. AISIN SEIKI Co., Ltd.
- 8.3.1. Company overview
- 8.3.2. Key executives
- 8.3.3. Company snapshot
- 8.3.4. Operating business segments
- 8.3.5. Product portfolio
- 8.3.6. Business performance
- 8.3.7. Key strategic moves and developments
- 8.4. Delphi Automotive LLP
- 8.4.1. Company overview
- 8.4.2. Key executives
- 8.4.3. Company snapshot
- 8.4.4. Operating business segments
- 8.4.5. Product portfolio
- 8.4.6. Business performance
- 8.4.7. Key strategic moves and developments
- 8.5. BorgWarner Inc.
- 8.5.1. Company overview
- 8.5.2. Key executives
- 8.5.3. Company snapshot
- 8.5.4. Operating business segments
- 8.5.5. Product portfolio
- 8.5.6. Business performance
- 8.5.7. Key strategic moves and developments
- 8.6. hitachi automotive systems, ltd.
- 8.6.1. Company overview
- 8.6.2. Key executives
- 8.6.3. Company snapshot
- 8.6.4. Operating business segments
- 8.6.5. Product portfolio
- 8.6.6. Business performance
- 8.6.7. Key strategic moves and developments
- 8.7. DENSO CORPORATION
- 8.7.1. Company overview
- 8.7.2. Key executives
- 8.7.3. Company snapshot
- 8.7.4. Operating business segments
- 8.7.5. Product portfolio
- 8.7.6. Business performance
- 8.7.7. Key strategic moves and developments
- 8.8. Johnson Controls
- 8.8.1. Company overview
- 8.8.2. Key executives
- 8.8.3. Company snapshot
- 8.8.4. Operating business segments
- 8.8.5. Product portfolio
- 8.8.6. Business performance
- 8.8.7. Key strategic moves and developments
- 8.9. Valeo
- 8.9.1. Company overview
- 8.9.2. Key executives
- 8.9.3. Company snapshot
- 8.9.4. Operating business segments
- 8.9.5. Product portfolio
- 8.9.6. Business performance
- 8.9.7. Key strategic moves and developments
LIST OF TABLES
- TABLE 01. GLOBAL START STOP TECHNOLOGY MARKET, BY TYPE, 2022-2032 ($MILLION)
- TABLE 02. START STOP TECHNOLOGY MARKET FOR ENHANCED STARTER, BY REGION, 2022-2032 ($MILLION)
- TABLE 03. START STOP TECHNOLOGY MARKET FOR BELT-DRIVEN ALTERNATOR STARTER (BAS), BY REGION, 2022-2032 ($MILLION)
- TABLE 04. START STOP TECHNOLOGY MARKET FOR DIRECT STARTER, BY REGION, 2022-2032 ($MILLION)
- TABLE 05. START STOP TECHNOLOGY MARKET FOR INTEGRATED STARTER GENERATOR (ISG), BY REGION, 2022-2032 ($MILLION)
- TABLE 06. GLOBAL START STOP TECHNOLOGY MARKET, BY APPLICATION, 2022-2032 ($MILLION)
- TABLE 07. START STOP TECHNOLOGY MARKET FOR PASSENGER CAR, BY REGION, 2022-2032 ($MILLION)
- TABLE 08. START STOP TECHNOLOGY MARKET FOR COMMERCIAL CAR, BY REGION, 2022-2032 ($MILLION)
- TABLE 09. START STOP TECHNOLOGY MARKET, BY REGION, 2022-2032 ($MILLION)
- TABLE 10. NORTH AMERICA START STOP TECHNOLOGY MARKET, BY TYPE, 2022-2032 ($MILLION)
- TABLE 11. NORTH AMERICA START STOP TECHNOLOGY MARKET, BY APPLICATION, 2022-2032 ($MILLION)
- TABLE 12. NORTH AMERICA START STOP TECHNOLOGY MARKET, BY COUNTRY, 2022-2032 ($MILLION)
- TABLE 13. U.S. START STOP TECHNOLOGY MARKET, BY TYPE, 2022-2032 ($MILLION)
- TABLE 14. U.S. START STOP TECHNOLOGY MARKET, BY APPLICATION, 2022-2032 ($MILLION)
- TABLE 15. CANADA START STOP TECHNOLOGY MARKET, BY TYPE, 2022-2032 ($MILLION)
- TABLE 16. CANADA START STOP TECHNOLOGY MARKET, BY APPLICATION, 2022-2032 ($MILLION)
- TABLE 17. MEXICO START STOP TECHNOLOGY MARKET, BY TYPE, 2022-2032 ($MILLION)
- TABLE 18. MEXICO START STOP TECHNOLOGY MARKET, BY APPLICATION, 2022-2032 ($MILLION)
- TABLE 19. EUROPE START STOP TECHNOLOGY MARKET, BY TYPE, 2022-2032 ($MILLION)
- TABLE 20. EUROPE START STOP TECHNOLOGY MARKET, BY APPLICATION, 2022-2032 ($MILLION)
- TABLE 21. EUROPE START STOP TECHNOLOGY MARKET, BY COUNTRY, 2022-2032 ($MILLION)
- TABLE 22. GERMANY START STOP TECHNOLOGY MARKET, BY TYPE, 2022-2032 ($MILLION)
- TABLE 23. GERMANY START STOP TECHNOLOGY MARKET, BY APPLICATION, 2022-2032 ($MILLION)
- TABLE 24. UK START STOP TECHNOLOGY MARKET, BY TYPE, 2022-2032 ($MILLION)
- TABLE 25. UK START STOP TECHNOLOGY MARKET, BY APPLICATION, 2022-2032 ($MILLION)
- TABLE 26. FRANCE START STOP TECHNOLOGY MARKET, BY TYPE, 2022-2032 ($MILLION)
- TABLE 27. FRANCE START STOP TECHNOLOGY MARKET, BY APPLICATION, 2022-2032 ($MILLION)
- TABLE 28. SPAIN START STOP TECHNOLOGY MARKET, BY TYPE, 2022-2032 ($MILLION)
- TABLE 29. SPAIN START STOP TECHNOLOGY MARKET, BY APPLICATION, 2022-2032 ($MILLION)
- TABLE 30. ITALY START STOP TECHNOLOGY MARKET, BY TYPE, 2022-2032 ($MILLION)
- TABLE 31. ITALY START STOP TECHNOLOGY MARKET, BY APPLICATION, 2022-2032 ($MILLION)
- TABLE 32. REST OF EUROPE START STOP TECHNOLOGY MARKET, BY TYPE, 2022-2032 ($MILLION)
- TABLE 33. REST OF EUROPE START STOP TECHNOLOGY MARKET, BY APPLICATION, 2022-2032 ($MILLION)
- TABLE 34. ASIA-PACIFIC START STOP TECHNOLOGY MARKET, BY TYPE, 2022-2032 ($MILLION)
- TABLE 35. ASIA-PACIFIC START STOP TECHNOLOGY MARKET, BY APPLICATION, 2022-2032 ($MILLION)
- TABLE 36. ASIA-PACIFIC START STOP TECHNOLOGY MARKET, BY COUNTRY, 2022-2032 ($MILLION)
- TABLE 37. CHINA START STOP TECHNOLOGY MARKET, BY TYPE, 2022-2032 ($MILLION)
- TABLE 38. CHINA START STOP TECHNOLOGY MARKET, BY APPLICATION, 2022-2032 ($MILLION)
- TABLE 39. JAPAN START STOP TECHNOLOGY MARKET, BY TYPE, 2022-2032 ($MILLION)
- TABLE 40. JAPAN START STOP TECHNOLOGY MARKET, BY APPLICATION, 2022-2032 ($MILLION)
- TABLE 41. INDIA START STOP TECHNOLOGY MARKET, BY TYPE, 2022-2032 ($MILLION)
- TABLE 42. INDIA START STOP TECHNOLOGY MARKET, BY APPLICATION, 2022-2032 ($MILLION)
- TABLE 43. SOUTH KOREA START STOP TECHNOLOGY MARKET, BY TYPE, 2022-2032 ($MILLION)
- TABLE 44. SOUTH KOREA START STOP TECHNOLOGY MARKET, BY APPLICATION, 2022-2032 ($MILLION)
- TABLE 45. AUSTRALIA START STOP TECHNOLOGY MARKET, BY TYPE, 2022-2032 ($MILLION)
- TABLE 46. AUSTRALIA START STOP TECHNOLOGY MARKET, BY APPLICATION, 2022-2032 ($MILLION)
- TABLE 47. REST OF ASIA-PACIFIC START STOP TECHNOLOGY MARKET, BY TYPE, 2022-2032 ($MILLION)
- TABLE 48. REST OF ASIA-PACIFIC START STOP TECHNOLOGY MARKET, BY APPLICATION, 2022-2032 ($MILLION)
- TABLE 49. LAMEA START STOP TECHNOLOGY MARKET, BY TYPE, 2022-2032 ($MILLION)
- TABLE 50. LAMEA START STOP TECHNOLOGY MARKET, BY APPLICATION, 2022-2032 ($MILLION)
- TABLE 51. LAMEA START STOP TECHNOLOGY MARKET, BY COUNTRY, 2022-2032 ($MILLION)
- TABLE 52. BRAZIL START STOP TECHNOLOGY MARKET, BY TYPE, 2022-2032 ($MILLION)
- TABLE 53. BRAZIL START STOP TECHNOLOGY MARKET, BY APPLICATION, 2022-2032 ($MILLION)
- TABLE 54. SAUDI ARABIA START STOP TECHNOLOGY MARKET, BY TYPE, 2022-2032 ($MILLION)
- TABLE 55. SAUDI ARABIA START STOP TECHNOLOGY MARKET, BY APPLICATION, 2022-2032 ($MILLION)
- TABLE 56. UAE START STOP TECHNOLOGY MARKET, BY TYPE, 2022-2032 ($MILLION)
- TABLE 57. UAE START STOP TECHNOLOGY MARKET, BY APPLICATION, 2022-2032 ($MILLION)
- TABLE 58. SOUTH AFRICA START STOP TECHNOLOGY MARKET, BY TYPE, 2022-2032 ($MILLION)
- TABLE 59. SOUTH AFRICA START STOP TECHNOLOGY MARKET, BY APPLICATION, 2022-2032 ($MILLION)
- TABLE 60. REST OF LAMEA START STOP TECHNOLOGY MARKET, BY TYPE, 2022-2032 ($MILLION)
- TABLE 61. REST OF LAMEA START STOP TECHNOLOGY MARKET, BY APPLICATION, 2022-2032 ($MILLION)
- TABLE 62. CONTINENTAL AG: KEY EXECUTIVES
- TABLE 63. CONTINENTAL AG: COMPANY SNAPSHOT
- TABLE 64. CONTINENTAL AG: PRODUCT SEGMENTS
- TABLE 65. CONTINENTAL AG: SERVICE SEGMENTS
- TABLE 66. CONTINENTAL AG: PRODUCT PORTFOLIO
- TABLE 67. CONTINENTAL AG: KEY STRATERGIES
- TABLE 68. ROBERT BOSCH GMBH: KEY EXECUTIVES
- TABLE 69. ROBERT BOSCH GMBH: COMPANY SNAPSHOT
- TABLE 70. ROBERT BOSCH GMBH: PRODUCT SEGMENTS
- TABLE 71. ROBERT BOSCH GMBH: SERVICE SEGMENTS
- TABLE 72. ROBERT BOSCH GMBH: PRODUCT PORTFOLIO
- TABLE 73. ROBERT BOSCH GMBH: KEY STRATERGIES
- TABLE 74. AISIN SEIKI CO., LTD.: KEY EXECUTIVES
- TABLE 75. AISIN SEIKI CO., LTD.: COMPANY SNAPSHOT
- TABLE 76. AISIN SEIKI CO., LTD.: PRODUCT SEGMENTS
- TABLE 77. AISIN SEIKI CO., LTD.: SERVICE SEGMENTS
- TABLE 78. AISIN SEIKI CO., LTD.: PRODUCT PORTFOLIO
- TABLE 79. AISIN SEIKI CO., LTD.: KEY STRATERGIES
- TABLE 80. DELPHI AUTOMOTIVE LLP: KEY EXECUTIVES
- TABLE 81. DELPHI AUTOMOTIVE LLP: COMPANY SNAPSHOT
- TABLE 82. DELPHI AUTOMOTIVE LLP: PRODUCT SEGMENTS
- TABLE 83. DELPHI AUTOMOTIVE LLP: SERVICE SEGMENTS
- TABLE 84. DELPHI AUTOMOTIVE LLP: PRODUCT PORTFOLIO
- TABLE 85. DELPHI AUTOMOTIVE LLP: KEY STRATERGIES
- TABLE 86. BORGWARNER INC.: KEY EXECUTIVES
- TABLE 87. BORGWARNER INC.: COMPANY SNAPSHOT
- TABLE 88. BORGWARNER INC.: PRODUCT SEGMENTS
- TABLE 89. BORGWARNER INC.: SERVICE SEGMENTS
- TABLE 90. BORGWARNER INC.: PRODUCT PORTFOLIO
- TABLE 91. BORGWARNER INC.: KEY STRATERGIES
- TABLE 92. HITACHI AUTOMOTIVE SYSTEMS, LTD.: KEY EXECUTIVES
- TABLE 93. HITACHI AUTOMOTIVE SYSTEMS, LTD.: COMPANY SNAPSHOT
- TABLE 94. HITACHI AUTOMOTIVE SYSTEMS, LTD.: PRODUCT SEGMENTS
- TABLE 95. HITACHI AUTOMOTIVE SYSTEMS, LTD.: SERVICE SEGMENTS
- TABLE 96. HITACHI AUTOMOTIVE SYSTEMS, LTD.: PRODUCT PORTFOLIO
- TABLE 97. HITACHI AUTOMOTIVE SYSTEMS, LTD.: KEY STRATERGIES
- TABLE 98. DENSO CORPORATION: KEY EXECUTIVES
- TABLE 99. DENSO CORPORATION: COMPANY SNAPSHOT
- TABLE 100. DENSO CORPORATION: PRODUCT SEGMENTS
- TABLE 101. DENSO CORPORATION: SERVICE SEGMENTS
- TABLE 102. DENSO CORPORATION: PRODUCT PORTFOLIO
- TABLE 103. DENSO CORPORATION: KEY STRATERGIES
- TABLE 104. JOHNSON CONTROLS: KEY EXECUTIVES
- TABLE 105. JOHNSON CONTROLS: COMPANY SNAPSHOT
- TABLE 106. JOHNSON CONTROLS: PRODUCT SEGMENTS
- TABLE 107. JOHNSON CONTROLS: SERVICE SEGMENTS
- TABLE 108. JOHNSON CONTROLS: PRODUCT PORTFOLIO
- TABLE 109. JOHNSON CONTROLS: KEY STRATERGIES
- TABLE 110. VALEO: KEY EXECUTIVES
- TABLE 111. VALEO: COMPANY SNAPSHOT
- TABLE 112. VALEO: PRODUCT SEGMENTS
- TABLE 113. VALEO: SERVICE SEGMENTS
- TABLE 114. VALEO: PRODUCT PORTFOLIO
- TABLE 115. VALEO: KEY STRATERGIES
LIST OF FIGURES
- FIGURE 01. START STOP TECHNOLOGY MARKET, 2022-2032
- FIGURE 02. SEGMENTATION OF START STOP TECHNOLOGY MARKET,2022-2032
- FIGURE 03. TOP IMPACTING FACTORS IN START STOP TECHNOLOGY MARKET
- FIGURE 04. TOP INVESTMENT POCKETS IN START STOP TECHNOLOGY MARKET (2023-2032)
- FIGURE 05. BARGAINING POWER OF SUPPLIERS
- FIGURE 06. BARGAINING POWER OF BUYERS
- FIGURE 07. THREAT OF SUBSTITUTION
- FIGURE 08. THREAT OF SUBSTITUTION
- FIGURE 09. COMPETITIVE RIVALRY
- FIGURE 10. GLOBAL START STOP TECHNOLOGY MARKET:DRIVERS, RESTRAINTS AND OPPORTUNITIES
- FIGURE 11. REGULATORY GUIDELINES: START STOP TECHNOLOGY MARKET
- FIGURE 12. PATENT ANALYSIS BY COMPANY
- FIGURE 13. PATENT ANALYSIS BY COUNTRY
- FIGURE 14. START STOP TECHNOLOGY MARKET, BY TYPE, 2022 AND 2032(%)
- FIGURE 15. COMPARATIVE SHARE ANALYSIS OF START STOP TECHNOLOGY MARKET FOR ENHANCED STARTER, BY COUNTRY 2022 AND 2032(%)
- FIGURE 16. COMPARATIVE SHARE ANALYSIS OF START STOP TECHNOLOGY MARKET FOR BELT-DRIVEN ALTERNATOR STARTER (BAS), BY COUNTRY 2022 AND 2032(%)
- FIGURE 17. COMPARATIVE SHARE ANALYSIS OF START STOP TECHNOLOGY MARKET FOR DIRECT STARTER, BY COUNTRY 2022 AND 2032(%)
- FIGURE 18. COMPARATIVE SHARE ANALYSIS OF START STOP TECHNOLOGY MARKET FOR INTEGRATED STARTER GENERATOR (ISG), BY COUNTRY 2022 AND 2032(%)
- FIGURE 19. START STOP TECHNOLOGY MARKET, BY APPLICATION, 2022 AND 2032(%)
- FIGURE 20. COMPARATIVE SHARE ANALYSIS OF START STOP TECHNOLOGY MARKET FOR PASSENGER CAR, BY COUNTRY 2022 AND 2032(%)
- FIGURE 21. COMPARATIVE SHARE ANALYSIS OF START STOP TECHNOLOGY MARKET FOR COMMERCIAL CAR, BY COUNTRY 2022 AND 2032(%)
- FIGURE 22. START STOP TECHNOLOGY MARKET BY REGION, 2022 AND 2032(%)
- FIGURE 23. U.S. START STOP TECHNOLOGY MARKET, 2022-2032 ($MILLION)
- FIGURE 24. CANADA START STOP TECHNOLOGY MARKET, 2022-2032 ($MILLION)
- FIGURE 25. MEXICO START STOP TECHNOLOGY MARKET, 2022-2032 ($MILLION)
- FIGURE 26. GERMANY START STOP TECHNOLOGY MARKET, 2022-2032 ($MILLION)
- FIGURE 27. UK START STOP TECHNOLOGY MARKET, 2022-2032 ($MILLION)
- FIGURE 28. FRANCE START STOP TECHNOLOGY MARKET, 2022-2032 ($MILLION)
- FIGURE 29. SPAIN START STOP TECHNOLOGY MARKET, 2022-2032 ($MILLION)
- FIGURE 30. ITALY START STOP TECHNOLOGY MARKET, 2022-2032 ($MILLION)
- FIGURE 31. REST OF EUROPE START STOP TECHNOLOGY MARKET, 2022-2032 ($MILLION)
- FIGURE 32. CHINA START STOP TECHNOLOGY MARKET, 2022-2032 ($MILLION)
- FIGURE 33. JAPAN START STOP TECHNOLOGY MARKET, 2022-2032 ($MILLION)
- FIGURE 34. INDIA START STOP TECHNOLOGY MARKET, 2022-2032 ($MILLION)
- FIGURE 35. SOUTH KOREA START STOP TECHNOLOGY MARKET, 2022-2032 ($MILLION)
- FIGURE 36. AUSTRALIA START STOP TECHNOLOGY MARKET, 2022-2032 ($MILLION)
- FIGURE 37. REST OF ASIA-PACIFIC START STOP TECHNOLOGY MARKET, 2022-2032 ($MILLION)
- FIGURE 38. BRAZIL START STOP TECHNOLOGY MARKET, 2022-2032 ($MILLION)
- FIGURE 39. SAUDI ARABIA START STOP TECHNOLOGY MARKET, 2022-2032 ($MILLION)
- FIGURE 40. UAE START STOP TECHNOLOGY MARKET, 2022-2032 ($MILLION)
- FIGURE 41. SOUTH AFRICA START STOP TECHNOLOGY MARKET, 2022-2032 ($MILLION)
- FIGURE 42. REST OF LAMEA START STOP TECHNOLOGY MARKET, 2022-2032 ($MILLION)
- FIGURE 43. TOP WINNING STRATEGIES, BY YEAR
- FIGURE 44. TOP WINNING STRATEGIES, BY DEVELOPMENT
- FIGURE 45. TOP WINNING STRATEGIES, BY COMPANY
- FIGURE 46. PRODUCT MAPPING OF TOP 10 PLAYERS
- FIGURE 47. COMPETITIVE DASHBOARD
- FIGURE 48. COMPETITIVE HEATMAP: START STOP TECHNOLOGY MARKET
- FIGURE 49. TOP PLAYER POSITIONING, 2022


