


 |
市場調查報告書
商品編碼
1446394
熱原測試市場:按產品和服務、按測試類型、按最終用戶:2023-2032 年全球機會分析和產業預測Pyrogen Testing Market By Product and Service, By Test Type, By End User : Global Opportunity Analysis and Industry Forecast, 2023-2032 |
||||||
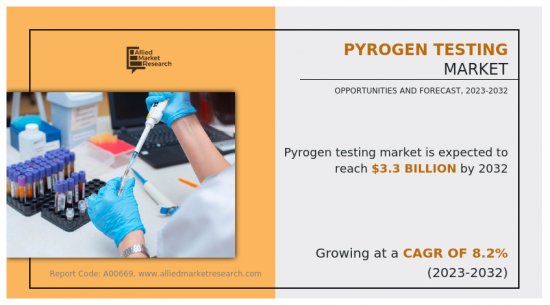
熱原測試包括使用細菌衍生質能的體外方法,例如鱟阿米巴細胞裂解物(LAL)測試,該測試通常用於檢測內毒素。
其他方法包括單核細胞活化試驗 (MAT) 和兔熱原試驗,但由於倫理問題以及更特異性的替代方法的存在,這些方法不太常用。熱原測試的目的是透過防止接觸可能損害患者健康的熱原污染物來確保醫療產品的安全和品質。
推動熱原測試市場成長的主要因素包括人們越來越重視確保藥品和醫療設備的安全和質量,以及心臟病、糖尿病、關節炎、癌症、糖尿病等慢性疾病的流行。醫療費率急劇上升以及對藥品和醫療設備的需求增加。製藥和生物技術行業先進配方的開拓是熱原測試市場擴張的關鍵驅動力。藥品日益複雜,需要實施更多的品管措施,從而導致熱原測試的採用。此外,越來越多的製藥和生物技術行業採用複雜的配方和尖端的醫療技術,增加了對先進、靈敏的熱原測試方法的需求,這正在推動市場成長。
此外,越來越多的減少熱原污染的舉措促使全球監管機構和醫療機構制定了嚴格的標準。這使得必須採用強大的熱原測試方法,從而促進熱原測試市場的成長。例如,美國食品藥物管理局(FDA)和歐洲藥品管理局(EMA)等監管機構制定了明確的熱原檢測指南和標準。這些指南概述了藥品和醫療設備製造商進行徹底的熱原測試作為其品管過程的一部分的監管期望和要求。因此,嚴格遵守這些準則將極大地促進市場成長。
此外,熱原測試技術的不斷進步將進一步推動市場成長。體外方法和測試、內毒素測試和重組 C 因子測定等創新熱原檢測方法的發展正在提高熱原測試過程的準確性和效率。例如,Lonza Group 生產 PyroTec PRO,這是一種自動化內毒素檢測平台,採用先進技術來提高熱原檢測的效率和準確性。該系統利用已建立的鱟變形細胞裂解物 (LAL) 測試方法來自動化和簡化測試過程。這些技術進步使製藥商能夠採用更可靠、更快速的測試程序,推動市場成長。
然而,熱原測試的標準化有限阻礙了市場的成長。此外,缺乏有關熱原污染風險和測試方法的知識和教育,阻礙了熱原測試在新興地區的普及。相較之下,以創新和產品開發為重點的醫療設備產業的擴張以及新興國家的高成長潛力預計將在預測期內提供利潤豐厚的機會。
熱原測試市場按產品/服務、測試類型、最終用戶和地區進行細分。依產品和服務,市場分為試劑和套件、設備和服務。依試驗類型分為鱟試劑試驗、兔熱原試驗等。按最終用戶分類,它們分為製藥/生技公司、醫療設備公司等。按地區分類,我們有北美(美國、加拿大、墨西哥)、歐洲(德國、英國、英國、義大利、西班牙其他歐洲國家地區)、亞太地區(日本、中國、澳洲、印度、韓國、其他亞太地區)、洛杉磯(巴西、哥倫比亞、阿根廷和其他亞太地區)和MEA(海灣合作理事會、南美、北非和其他MEA 地區)進行了分析。
相關人員的主要利益
- 本報告定量分析了 2022 年至 2032 年熱原測試市場分析的細分市場、當前趨勢、估計/趨勢和動態,並確定了熱原測試市場的強大機會。
- 我們提供市場研究以及與市場促進因素、市場限制和市場機會相關的資訊。
- 波特的五力分析強調買家和供應商幫助相關人員做出以利潤為導向的商業決策並加強供應商-買家網路的潛力。
- 對熱原測試市場細分的詳細分析有助於識別市場機會。
- 每個地區的主要國家都根據其對全球市場的收益貢獻繪製了地圖。
- 市場公司定位有助於基準化分析並提供對市場公司當前地位的清晰了解。
- 該報告包括對區域和全球熱原測試市場趨勢、主要企業、細分市場、應用領域和市場成長策略的分析。
可使用此報告進行客製化(需要額外費用和時間表)
- 監管指引
- 根據客戶興趣加入公司簡介
- 按國家或地區進行的附加分析 – 市場規模和預測
- 公司簡介的擴充列表
- 歷史市場資料
- 主要企業詳細資料(Excel 格式,包括位置、聯絡資訊、供應商/供應商網路等)
目錄
第1章簡介
第 2 章執行摘要
第3章市場概況
- 市場定義和範圍
- 主要發現
- 影響因素
- 主要投資機會
- 波特五力分析
- 市場動態
- 促進因素
- 抑制因素
- 機會
第4章熱原測試市場:依產品/服務分類
- 概述
- 試劑和套件
- 檢驗設備
- 服務
第5章熱原測試市場:依測試類型
- 概述
- 鱟試劑檢驗
- 兔熱原測試(RPT)
- 其他
第6章熱原測試市場:依最終用戶分類
- 概述
- 製藥和生物技術公司
- 醫療設備公司
- 其他
第7章熱原測試市場:按地區
- 概述
- 北美洲
- 美國
- 加拿大
- 墨西哥
- 歐洲
- 德國
- 法國
- 英國
- 義大利
- 西班牙
- 其他
- 亞太地區
- 日本
- 中國
- 印度
- 澳洲
- 韓國
- 其他
- 拉丁美洲
- 巴西
- 哥倫比亞
- 阿根廷
- 其他拉丁美洲
- 中東/非洲
- Gcc
- 南非
- 北非
- 其他
第8章 競爭格局
- 介紹
- 關鍵成功策略
- 10家主要企業產品圖譜
- 競爭對手儀表板
- 競爭熱圖
- 2022年主要企業定位
第9章 公司簡介
- Lonza Group AG
- Thermo Fisher Scientific Inc.
- Fujifilm Holdings Corporation
- GenScript
- SEIKAGAKU CORPORATION
- Charles River Laboratories
- STERIS plc
- Wuxi AppTec
- Eurofins Scientific SE
- Merck KGaA
Pyrogen testing involves in vitro methods using substances derived from bacterial sources, such as the Limulus amebocyte lysate (LAL) test, which is commonly employed for endotoxin detection. Other methods include the monocyte activation test (MAT) and rabbit pyrogen test, although these are less commonly used due to ethical concerns and the availability of more sensitive and specific alternatives. The goal of pyrogen testing is to ensure the safety and quality of medical products by preventing exposure to pyrogenic contaminants that could compromise patient health.
Key factors that drive the growth of the pyrogen testing market include a rise in emphasis on ensuring the safety and quality of pharmaceutical and medical devices, surge in the prevalence of chronic diseases, such as heart disease, diabetes, arthritis, cancer, & diabetes, and rise in demand for pharmaceuticals & medical devices. The development of advanced formulations in the pharmaceutical and biotechnology industries is a significant driver for the pyrogen testing market expansion. The increase in complexity of pharmaceutical products has necessitated the implementation of more quality control measures, leading to the adoption of pyrogen testing. In addition, the rise in number of pharmaceutical & biotechnology industries introducing complex formulations and cutting-edge medical technologies have led to the need for advanced and sensitive pyrogen testing methodologies, which propel the market growth.
Furthermore, growing initiatives for minimizing pyrogen contamination have led to global regulatory bodies and healthcare organizations to set strict standards. This mandates the adoption of strong pyrogen testing methods, contributing to the growth of the pyrogen testing market. For instance, regulatory authorities, such as the U.S. Food and Drug Administration (FDA), the European Medicines Agency (EMA), and others, have established clear guidelines and standards for pyrogen testing. These guidelines outline the regulatory expectations and requirements for pharmaceutical and medical device manufacturers to conduct thorough pyrogen testing as part of their quality control processes. Thus, stringent adherence to these guidelines contributes significantly to market growth.
Moreover, the rise in technological advancements in pyrogen testing further boosts market growth. The development of innovative pyrogen detection methods, such as in vitro and in vivo testing, endotoxin testing, and recombinant factor C assays, enhances the accuracy and efficiency of pyrogen testing processes. For instance, Lonza Group company manufacture PyroTec PRO, an automated endotoxin testing platform that incorporates advanced technology to enhance the efficiency and accuracy of pyrogen testing. The system utilizes the well-established Limulus Amoebocyte Lysate (LAL) test method automates and streamlines the testing process. These technological advancements enable pharmaceutical manufacturers to adopt more reliable and rapid testing procedures, thereby propelling the market growth.
However, limited standardization for pyrogen testing hinders market growth. In addition, lack of knowledge and education about pyrogen contamination risks and testing methodologies hinder the widespread adoption of pyrogen testing in emerging regions. In contrast, expanding the medical device industry, with a focus on innovation and product development, and high growth potential in emerging countries are expected to provide lucrative opportunities during the forecast period.
The pyrogen testing market is segmented on the basis of product & service, test type, end user, and region. By product & service, the market is classified into reagents & kits, instruments, and services. By test type, the market is divided into LAL tests, rabbit pyrogen test, and others. By end user, it is segregated into pharmaceutical & biotechnology companies, medical device companies, and others. Region-wise, the market is analyzed across North America (the U.S., Canada, and Mexico), Europe (Germany, France, the UK, Italy, Spain, and rest of Europe), Asia-Pacific (Japan, China, Australia, India, South Korea, and rest of Asia-Pacific), LA (Brazil, Colombia, Argentina, and rest of LA), and MEA (GCC, South Africa, North Africa, and rest of MEA).
Major key players that operate in the pyrogen testing market are Merck KGaA, Lonza Group, Thermo Fisher Scientific Inc., FUJIFILM Holdings Corporation, GenScript, SEIKAGAKU CORPORATION, Charles River Laboratories, STERIS, WuXi AppTec, and Eurofins Scientific. Key players have adopted product launch as a key developmental strategy to improve the product portfolio of the pyrogen testing market. For instance, in August 2023, Lonza Group launched the Nebula Absorbance Reader, a new absorbance microplate reader which joins the company's portfolio of optimized instruments for streamlined endotoxin and pyrogen testing.
Key Benefits For Stakeholders
- This report provides a quantitative analysis of the market segments, current trends, estimations, and dynamics of the pyrogen testing market analysis from 2022 to 2032 to identify the prevailing pyrogen testing market opportunities.
- The market research is offered along with information related to key drivers, restraints, and opportunities.
- Porter's five forces analysis highlights the potency of buyers and suppliers to enable stakeholders make profit-oriented business decisions and strengthen their supplier-buyer network.
- In-depth analysis of the pyrogen testing market segmentation assists to determine the prevailing market opportunities.
- Major countries in each region are mapped according to their revenue contribution to the global market.
- Market player positioning facilitates benchmarking and provides a clear understanding of the present position of the market players.
- The report includes the analysis of the regional as well as global pyrogen testing market trends, key players, market segments, application areas, and market growth strategies.
Additional benefits you will get with this purchase are:
- Quarterly Update and* (only available with a corporate license, on listed price)
- 5 additional Company Profile of client Choice pre- or Post-purchase, as a free update.
- Free Upcoming Version on the Purchase of Five and Enterprise User License.
- 16 analyst hours of support* (post-purchase, if you find additional data requirements upon review of the report, you may receive support amounting to 16 analyst hours to solve questions, and post-sale queries)
- 15% Free Customization* (in case the scope or segment of the report does not match your requirements, 15% is equivalent to 3 working days of free work, applicable once)
- Free data Pack on the Five and Enterprise User License. (Excel version of the report)
- Free Updated report if the report is 6-12 months old or older.
- 24-hour priority response*
- Free Industry updates and white papers.
Possible Customization with this report (with additional cost and timeline, please talk to the sales executive to know more)
- Regulatory Guidelines
- Additional company profiles with specific to client's interest
- Additional country or region analysis- market size and forecast
- Expanded list for Company Profiles
- Historic market data
- Key player details (including location, contact details, supplier/vendor network etc. in excel format)
Key Market Segments
By Product and Service
- Reagents and Kits
- Instruments
- Services
By Test Type
- LAL Test
- Rabbit Pyrogen Test
- Others
By End User
- Pharmaceutical and Biotechnology Companies
- Medical Device Companies
- Others
By Region
- North America
- U.S.
- Canada
- Mexico
- Europe
- Germany
- France
- UK
- Italy
- Spain
- Rest of Europe
- Asia-Pacific
- Japan
- China
- India
- Australia
- South Korea
- Rest of Asia-Pacific
- Latin America
- Brazil
- Colombia
- Argentina
- Rest Of La
- Middle East and Africa
- Gcc
- South Africa
- North Africa
- Rest Of Mea
Key Market Players:
- Lonza Group AG
- Thermo Fisher Scientific Inc.
- Fujifilm Holdings Corporation
- GenScript
- SEIKAGAKU CORPORATION
- Charles River Laboratories
- STERIS plc
- Wuxi AppTec
- Eurofins Scientific SE
- Merck KGaA
TABLE OF CONTENTS
CHAPTER 1: INTRODUCTION
- 1.1. Report description
- 1.2. Key market segments
- 1.3. Key benefits to the stakeholders
- 1.4. Research methodology
- 1.4.1. Primary research
- 1.4.2. Secondary research
- 1.4.3. Analyst tools and models
CHAPTER 2: EXECUTIVE SUMMARY
- 2.1. CXO Perspective
CHAPTER 3: MARKET OVERVIEW
- 3.1. Market definition and scope
- 3.2. Key findings
- 3.2.1. Top impacting factors
- 3.2.2. Top investment pockets
- 3.3. Porter's five forces analysis
- 3.3.1. Low bargaining power of suppliers
- 3.3.2. Low threat of new entrants
- 3.3.3. Low threat of substitutes
- 3.3.4. Low intensity of rivalry
- 3.3.5. Low bargaining power of buyers
- 3.4. Market dynamics
- 3.4.1. Drivers
- 3.4.2. Restraints
- 3.4.3. Opportunities
CHAPTER 4: PYROGEN TESTING MARKET, BY PRODUCT AND SERVICE
- 4.1. Overview
- 4.1.1. Market size and forecast
- 4.2. Reagents and Kits
- 4.2.1. Key market trends, growth factors and opportunities
- 4.2.2. Market size and forecast, by region
- 4.2.3. Market share analysis by country
- 4.3. Instruments
- 4.3.1. Key market trends, growth factors and opportunities
- 4.3.2. Market size and forecast, by region
- 4.3.3. Market share analysis by country
- 4.4. Services
- 4.4.1. Key market trends, growth factors and opportunities
- 4.4.2. Market size and forecast, by region
- 4.4.3. Market share analysis by country
CHAPTER 5: PYROGEN TESTING MARKET, BY TEST TYPE
- 5.1. Overview
- 5.1.1. Market size and forecast
- 5.2. LAL Test
- 5.2.1. Key market trends, growth factors and opportunities
- 5.2.2. Market size and forecast, by region
- 5.2.3. Market share analysis by country
- 5.3. Rabbit Pyrogen Test
- 5.3.1. Key market trends, growth factors and opportunities
- 5.3.2. Market size and forecast, by region
- 5.3.3. Market share analysis by country
- 5.4. Others
- 5.4.1. Key market trends, growth factors and opportunities
- 5.4.2. Market size and forecast, by region
- 5.4.3. Market share analysis by country
CHAPTER 6: PYROGEN TESTING MARKET, BY END USER
- 6.1. Overview
- 6.1.1. Market size and forecast
- 6.2. Pharmaceutical and Biotechnology Companies
- 6.2.1. Key market trends, growth factors and opportunities
- 6.2.2. Market size and forecast, by region
- 6.2.3. Market share analysis by country
- 6.3. Medical Device Companies
- 6.3.1. Key market trends, growth factors and opportunities
- 6.3.2. Market size and forecast, by region
- 6.3.3. Market share analysis by country
- 6.4. Others
- 6.4.1. Key market trends, growth factors and opportunities
- 6.4.2. Market size and forecast, by region
- 6.4.3. Market share analysis by country
CHAPTER 7: PYROGEN TESTING MARKET, BY REGION
- 7.1. Overview
- 7.1.1. Market size and forecast By Region
- 7.2. North America
- 7.2.1. Key market trends, growth factors and opportunities
- 7.2.2. Market size and forecast, by Product and Service
- 7.2.3. Market size and forecast, by Test Type
- 7.2.4. Market size and forecast, by End User
- 7.2.5. Market size and forecast, by country
- 7.2.5.1. U.S.
- 7.2.5.1.1. Market size and forecast, by Product and Service
- 7.2.5.1.2. Market size and forecast, by Test Type
- 7.2.5.1.3. Market size and forecast, by End User
- 7.2.5.2. Canada
- 7.2.5.2.1. Market size and forecast, by Product and Service
- 7.2.5.2.2. Market size and forecast, by Test Type
- 7.2.5.2.3. Market size and forecast, by End User
- 7.2.5.3. Mexico
- 7.2.5.3.1. Market size and forecast, by Product and Service
- 7.2.5.3.2. Market size and forecast, by Test Type
- 7.2.5.3.3. Market size and forecast, by End User
- 7.3. Europe
- 7.3.1. Key market trends, growth factors and opportunities
- 7.3.2. Market size and forecast, by Product and Service
- 7.3.3. Market size and forecast, by Test Type
- 7.3.4. Market size and forecast, by End User
- 7.3.5. Market size and forecast, by country
- 7.3.5.1. Germany
- 7.3.5.1.1. Market size and forecast, by Product and Service
- 7.3.5.1.2. Market size and forecast, by Test Type
- 7.3.5.1.3. Market size and forecast, by End User
- 7.3.5.2. France
- 7.3.5.2.1. Market size and forecast, by Product and Service
- 7.3.5.2.2. Market size and forecast, by Test Type
- 7.3.5.2.3. Market size and forecast, by End User
- 7.3.5.3. UK
- 7.3.5.3.1. Market size and forecast, by Product and Service
- 7.3.5.3.2. Market size and forecast, by Test Type
- 7.3.5.3.3. Market size and forecast, by End User
- 7.3.5.4. Italy
- 7.3.5.4.1. Market size and forecast, by Product and Service
- 7.3.5.4.2. Market size and forecast, by Test Type
- 7.3.5.4.3. Market size and forecast, by End User
- 7.3.5.5. Spain
- 7.3.5.5.1. Market size and forecast, by Product and Service
- 7.3.5.5.2. Market size and forecast, by Test Type
- 7.3.5.5.3. Market size and forecast, by End User
- 7.3.5.6. Rest of Europe
- 7.3.5.6.1. Market size and forecast, by Product and Service
- 7.3.5.6.2. Market size and forecast, by Test Type
- 7.3.5.6.3. Market size and forecast, by End User
- 7.4. Asia-Pacific
- 7.4.1. Key market trends, growth factors and opportunities
- 7.4.2. Market size and forecast, by Product and Service
- 7.4.3. Market size and forecast, by Test Type
- 7.4.4. Market size and forecast, by End User
- 7.4.5. Market size and forecast, by country
- 7.4.5.1. Japan
- 7.4.5.1.1. Market size and forecast, by Product and Service
- 7.4.5.1.2. Market size and forecast, by Test Type
- 7.4.5.1.3. Market size and forecast, by End User
- 7.4.5.2. China
- 7.4.5.2.1. Market size and forecast, by Product and Service
- 7.4.5.2.2. Market size and forecast, by Test Type
- 7.4.5.2.3. Market size and forecast, by End User
- 7.4.5.3. India
- 7.4.5.3.1. Market size and forecast, by Product and Service
- 7.4.5.3.2. Market size and forecast, by Test Type
- 7.4.5.3.3. Market size and forecast, by End User
- 7.4.5.4. Australia
- 7.4.5.4.1. Market size and forecast, by Product and Service
- 7.4.5.4.2. Market size and forecast, by Test Type
- 7.4.5.4.3. Market size and forecast, by End User
- 7.4.5.5. South Korea
- 7.4.5.5.1. Market size and forecast, by Product and Service
- 7.4.5.5.2. Market size and forecast, by Test Type
- 7.4.5.5.3. Market size and forecast, by End User
- 7.4.5.6. Rest of Asia-Pacific
- 7.4.5.6.1. Market size and forecast, by Product and Service
- 7.4.5.6.2. Market size and forecast, by Test Type
- 7.4.5.6.3. Market size and forecast, by End User
- 7.5. Latin America
- 7.5.1. Key market trends, growth factors and opportunities
- 7.5.2. Market size and forecast, by Product and Service
- 7.5.3. Market size and forecast, by Test Type
- 7.5.4. Market size and forecast, by End User
- 7.5.5. Market size and forecast, by country
- 7.5.5.1. Brazil
- 7.5.5.1.1. Market size and forecast, by Product and Service
- 7.5.5.1.2. Market size and forecast, by Test Type
- 7.5.5.1.3. Market size and forecast, by End User
- 7.5.5.2. Colombia
- 7.5.5.2.1. Market size and forecast, by Product and Service
- 7.5.5.2.2. Market size and forecast, by Test Type
- 7.5.5.2.3. Market size and forecast, by End User
- 7.5.5.3. Argentina
- 7.5.5.3.1. Market size and forecast, by Product and Service
- 7.5.5.3.2. Market size and forecast, by Test Type
- 7.5.5.3.3. Market size and forecast, by End User
- 7.5.5.4. Rest Of La
- 7.5.5.4.1. Market size and forecast, by Product and Service
- 7.5.5.4.2. Market size and forecast, by Test Type
- 7.5.5.4.3. Market size and forecast, by End User
- 7.6. Middle East and Africa
- 7.6.1. Key market trends, growth factors and opportunities
- 7.6.2. Market size and forecast, by Product and Service
- 7.6.3. Market size and forecast, by Test Type
- 7.6.4. Market size and forecast, by End User
- 7.6.5. Market size and forecast, by country
- 7.6.5.1. Gcc
- 7.6.5.1.1. Market size and forecast, by Product and Service
- 7.6.5.1.2. Market size and forecast, by Test Type
- 7.6.5.1.3. Market size and forecast, by End User
- 7.6.5.2. South Africa
- 7.6.5.2.1. Market size and forecast, by Product and Service
- 7.6.5.2.2. Market size and forecast, by Test Type
- 7.6.5.2.3. Market size and forecast, by End User
- 7.6.5.3. North Africa
- 7.6.5.3.1. Market size and forecast, by Product and Service
- 7.6.5.3.2. Market size and forecast, by Test Type
- 7.6.5.3.3. Market size and forecast, by End User
- 7.6.5.4. Rest Of Mea
- 7.6.5.4.1. Market size and forecast, by Product and Service
- 7.6.5.4.2. Market size and forecast, by Test Type
- 7.6.5.4.3. Market size and forecast, by End User
CHAPTER 8: COMPETITIVE LANDSCAPE
- 8.1. Introduction
- 8.2. Top winning strategies
- 8.3. Product mapping of top 10 player
- 8.4. Competitive dashboard
- 8.5. Competitive heatmap
- 8.6. Top player positioning, 2022
CHAPTER 9: COMPANY PROFILES
- 9.1. Lonza Group AG
- 9.1.1. Company overview
- 9.1.2. Key executives
- 9.1.3. Company snapshot
- 9.1.4. Operating business segments
- 9.1.5. Product portfolio
- 9.1.6. Business performance
- 9.1.7. Key strategic moves and developments
- 9.2. Thermo Fisher Scientific Inc.
- 9.2.1. Company overview
- 9.2.2. Key executives
- 9.2.3. Company snapshot
- 9.2.4. Operating business segments
- 9.2.5. Product portfolio
- 9.2.6. Business performance
- 9.2.7. Key strategic moves and developments
- 9.3. Fujifilm Holdings Corporation
- 9.3.1. Company overview
- 9.3.2. Key executives
- 9.3.3. Company snapshot
- 9.3.4. Operating business segments
- 9.3.5. Product portfolio
- 9.3.6. Business performance
- 9.3.7. Key strategic moves and developments
- 9.4. GenScript
- 9.4.1. Company overview
- 9.4.2. Key executives
- 9.4.3. Company snapshot
- 9.4.4. Operating business segments
- 9.4.5. Product portfolio
- 9.4.6. Business performance
- 9.4.7. Key strategic moves and developments
- 9.5. SEIKAGAKU CORPORATION
- 9.5.1. Company overview
- 9.5.2. Key executives
- 9.5.3. Company snapshot
- 9.5.4. Operating business segments
- 9.5.5. Product portfolio
- 9.5.6. Business performance
- 9.5.7. Key strategic moves and developments
- 9.6. Charles River Laboratories
- 9.6.1. Company overview
- 9.6.2. Key executives
- 9.6.3. Company snapshot
- 9.6.4. Operating business segments
- 9.6.5. Product portfolio
- 9.6.6. Business performance
- 9.6.7. Key strategic moves and developments
- 9.7. STERIS plc
- 9.7.1. Company overview
- 9.7.2. Key executives
- 9.7.3. Company snapshot
- 9.7.4. Operating business segments
- 9.7.5. Product portfolio
- 9.7.6. Business performance
- 9.7.7. Key strategic moves and developments
- 9.8. Wuxi AppTec
- 9.8.1. Company overview
- 9.8.2. Key executives
- 9.8.3. Company snapshot
- 9.8.4. Operating business segments
- 9.8.5. Product portfolio
- 9.8.6. Business performance
- 9.8.7. Key strategic moves and developments
- 9.9. Eurofins Scientific SE
- 9.9.1. Company overview
- 9.9.2. Key executives
- 9.9.3. Company snapshot
- 9.9.4. Operating business segments
- 9.9.5. Product portfolio
- 9.9.6. Business performance
- 9.9.7. Key strategic moves and developments
- 9.10. Merck KGaA
- 9.10.1. Company overview
- 9.10.2. Key executives
- 9.10.3. Company snapshot
- 9.10.4. Operating business segments
- 9.10.5. Product portfolio
- 9.10.6. Business performance
- 9.10.7. Key strategic moves and developments
LIST OF TABLES
- TABLE 01. GLOBAL PYROGEN TESTING MARKET, BY PRODUCT AND SERVICE, 2022-2032 ($MILLION)
- TABLE 02. PYROGEN TESTING MARKET FOR REAGENTS AND KITS, BY REGION, 2022-2032 ($MILLION)
- TABLE 03. PYROGEN TESTING MARKET FOR INSTRUMENTS, BY REGION, 2022-2032 ($MILLION)
- TABLE 04. PYROGEN TESTING MARKET FOR SERVICES, BY REGION, 2022-2032 ($MILLION)
- TABLE 05. GLOBAL PYROGEN TESTING MARKET, BY TEST TYPE, 2022-2032 ($MILLION)
- TABLE 06. PYROGEN TESTING MARKET FOR LAL TEST, BY REGION, 2022-2032 ($MILLION)
- TABLE 07. PYROGEN TESTING MARKET FOR RABBIT PYROGEN TEST, BY REGION, 2022-2032 ($MILLION)
- TABLE 08. PYROGEN TESTING MARKET FOR OTHERS, BY REGION, 2022-2032 ($MILLION)
- TABLE 09. GLOBAL PYROGEN TESTING MARKET, BY END USER, 2022-2032 ($MILLION)
- TABLE 10. PYROGEN TESTING MARKET FOR PHARMACEUTICAL AND BIOTECHNOLOGY COMPANIES, BY REGION, 2022-2032 ($MILLION)
- TABLE 11. PYROGEN TESTING MARKET FOR MEDICAL DEVICE COMPANIES, BY REGION, 2022-2032 ($MILLION)
- TABLE 12. PYROGEN TESTING MARKET FOR OTHERS, BY REGION, 2022-2032 ($MILLION)
- TABLE 13. PYROGEN TESTING MARKET, BY REGION, 2022-2032 ($MILLION)
- TABLE 14. NORTH AMERICA PYROGEN TESTING MARKET, BY PRODUCT AND SERVICE, 2022-2032 ($MILLION)
- TABLE 15. NORTH AMERICA PYROGEN TESTING MARKET, BY TEST TYPE, 2022-2032 ($MILLION)
- TABLE 16. NORTH AMERICA PYROGEN TESTING MARKET, BY END USER, 2022-2032 ($MILLION)
- TABLE 17. NORTH AMERICA PYROGEN TESTING MARKET, BY COUNTRY, 2022-2032 ($MILLION)
- TABLE 18. U.S. PYROGEN TESTING MARKET, BY PRODUCT AND SERVICE, 2022-2032 ($MILLION)
- TABLE 19. U.S. PYROGEN TESTING MARKET, BY TEST TYPE, 2022-2032 ($MILLION)
- TABLE 20. U.S. PYROGEN TESTING MARKET, BY END USER, 2022-2032 ($MILLION)
- TABLE 21. CANADA PYROGEN TESTING MARKET, BY PRODUCT AND SERVICE, 2022-2032 ($MILLION)
- TABLE 22. CANADA PYROGEN TESTING MARKET, BY TEST TYPE, 2022-2032 ($MILLION)
- TABLE 23. CANADA PYROGEN TESTING MARKET, BY END USER, 2022-2032 ($MILLION)
- TABLE 24. MEXICO PYROGEN TESTING MARKET, BY PRODUCT AND SERVICE, 2022-2032 ($MILLION)
- TABLE 25. MEXICO PYROGEN TESTING MARKET, BY TEST TYPE, 2022-2032 ($MILLION)
- TABLE 26. MEXICO PYROGEN TESTING MARKET, BY END USER, 2022-2032 ($MILLION)
- TABLE 27. EUROPE PYROGEN TESTING MARKET, BY PRODUCT AND SERVICE, 2022-2032 ($MILLION)
- TABLE 28. EUROPE PYROGEN TESTING MARKET, BY TEST TYPE, 2022-2032 ($MILLION)
- TABLE 29. EUROPE PYROGEN TESTING MARKET, BY END USER, 2022-2032 ($MILLION)
- TABLE 30. EUROPE PYROGEN TESTING MARKET, BY COUNTRY, 2022-2032 ($MILLION)
- TABLE 31. GERMANY PYROGEN TESTING MARKET, BY PRODUCT AND SERVICE, 2022-2032 ($MILLION)
- TABLE 32. GERMANY PYROGEN TESTING MARKET, BY TEST TYPE, 2022-2032 ($MILLION)
- TABLE 33. GERMANY PYROGEN TESTING MARKET, BY END USER, 2022-2032 ($MILLION)
- TABLE 34. FRANCE PYROGEN TESTING MARKET, BY PRODUCT AND SERVICE, 2022-2032 ($MILLION)
- TABLE 35. FRANCE PYROGEN TESTING MARKET, BY TEST TYPE, 2022-2032 ($MILLION)
- TABLE 36. FRANCE PYROGEN TESTING MARKET, BY END USER, 2022-2032 ($MILLION)
- TABLE 37. UK PYROGEN TESTING MARKET, BY PRODUCT AND SERVICE, 2022-2032 ($MILLION)
- TABLE 38. UK PYROGEN TESTING MARKET, BY TEST TYPE, 2022-2032 ($MILLION)
- TABLE 39. UK PYROGEN TESTING MARKET, BY END USER, 2022-2032 ($MILLION)
- TABLE 40. ITALY PYROGEN TESTING MARKET, BY PRODUCT AND SERVICE, 2022-2032 ($MILLION)
- TABLE 41. ITALY PYROGEN TESTING MARKET, BY TEST TYPE, 2022-2032 ($MILLION)
- TABLE 42. ITALY PYROGEN TESTING MARKET, BY END USER, 2022-2032 ($MILLION)
- TABLE 43. SPAIN PYROGEN TESTING MARKET, BY PRODUCT AND SERVICE, 2022-2032 ($MILLION)
- TABLE 44. SPAIN PYROGEN TESTING MARKET, BY TEST TYPE, 2022-2032 ($MILLION)
- TABLE 45. SPAIN PYROGEN TESTING MARKET, BY END USER, 2022-2032 ($MILLION)
- TABLE 46. REST OF EUROPE PYROGEN TESTING MARKET, BY PRODUCT AND SERVICE, 2022-2032 ($MILLION)
- TABLE 47. REST OF EUROPE PYROGEN TESTING MARKET, BY TEST TYPE, 2022-2032 ($MILLION)
- TABLE 48. REST OF EUROPE PYROGEN TESTING MARKET, BY END USER, 2022-2032 ($MILLION)
- TABLE 49. ASIA-PACIFIC PYROGEN TESTING MARKET, BY PRODUCT AND SERVICE, 2022-2032 ($MILLION)
- TABLE 50. ASIA-PACIFIC PYROGEN TESTING MARKET, BY TEST TYPE, 2022-2032 ($MILLION)
- TABLE 51. ASIA-PACIFIC PYROGEN TESTING MARKET, BY END USER, 2022-2032 ($MILLION)
- TABLE 52. ASIA-PACIFIC PYROGEN TESTING MARKET, BY COUNTRY, 2022-2032 ($MILLION)
- TABLE 53. JAPAN PYROGEN TESTING MARKET, BY PRODUCT AND SERVICE, 2022-2032 ($MILLION)
- TABLE 54. JAPAN PYROGEN TESTING MARKET, BY TEST TYPE, 2022-2032 ($MILLION)
- TABLE 55. JAPAN PYROGEN TESTING MARKET, BY END USER, 2022-2032 ($MILLION)
- TABLE 56. CHINA PYROGEN TESTING MARKET, BY PRODUCT AND SERVICE, 2022-2032 ($MILLION)
- TABLE 57. CHINA PYROGEN TESTING MARKET, BY TEST TYPE, 2022-2032 ($MILLION)
- TABLE 58. CHINA PYROGEN TESTING MARKET, BY END USER, 2022-2032 ($MILLION)
- TABLE 59. INDIA PYROGEN TESTING MARKET, BY PRODUCT AND SERVICE, 2022-2032 ($MILLION)
- TABLE 60. INDIA PYROGEN TESTING MARKET, BY TEST TYPE, 2022-2032 ($MILLION)
- TABLE 61. INDIA PYROGEN TESTING MARKET, BY END USER, 2022-2032 ($MILLION)
- TABLE 62. AUSTRALIA PYROGEN TESTING MARKET, BY PRODUCT AND SERVICE, 2022-2032 ($MILLION)
- TABLE 63. AUSTRALIA PYROGEN TESTING MARKET, BY TEST TYPE, 2022-2032 ($MILLION)
- TABLE 64. AUSTRALIA PYROGEN TESTING MARKET, BY END USER, 2022-2032 ($MILLION)
- TABLE 65. SOUTH KOREA PYROGEN TESTING MARKET, BY PRODUCT AND SERVICE, 2022-2032 ($MILLION)
- TABLE 66. SOUTH KOREA PYROGEN TESTING MARKET, BY TEST TYPE, 2022-2032 ($MILLION)
- TABLE 67. SOUTH KOREA PYROGEN TESTING MARKET, BY END USER, 2022-2032 ($MILLION)
- TABLE 68. REST OF ASIA-PACIFIC PYROGEN TESTING MARKET, BY PRODUCT AND SERVICE, 2022-2032 ($MILLION)
- TABLE 69. REST OF ASIA-PACIFIC PYROGEN TESTING MARKET, BY TEST TYPE, 2022-2032 ($MILLION)
- TABLE 70. REST OF ASIA-PACIFIC PYROGEN TESTING MARKET, BY END USER, 2022-2032 ($MILLION)
- TABLE 71. LATIN AMERICA PYROGEN TESTING MARKET, BY PRODUCT AND SERVICE, 2022-2032 ($MILLION)
- TABLE 72. LATIN AMERICA PYROGEN TESTING MARKET, BY TEST TYPE, 2022-2032 ($MILLION)
- TABLE 73. LATIN AMERICA PYROGEN TESTING MARKET, BY END USER, 2022-2032 ($MILLION)
- TABLE 74. LATIN AMERICA PYROGEN TESTING MARKET, BY COUNTRY, 2022-2032 ($MILLION)
- TABLE 75. BRAZIL PYROGEN TESTING MARKET, BY PRODUCT AND SERVICE, 2022-2032 ($MILLION)
- TABLE 76. BRAZIL PYROGEN TESTING MARKET, BY TEST TYPE, 2022-2032 ($MILLION)
- TABLE 77. BRAZIL PYROGEN TESTING MARKET, BY END USER, 2022-2032 ($MILLION)
- TABLE 78. COLOMBIA PYROGEN TESTING MARKET, BY PRODUCT AND SERVICE, 2022-2032 ($MILLION)
- TABLE 79. COLOMBIA PYROGEN TESTING MARKET, BY TEST TYPE, 2022-2032 ($MILLION)
- TABLE 80. COLOMBIA PYROGEN TESTING MARKET, BY END USER, 2022-2032 ($MILLION)
- TABLE 81. ARGENTINA PYROGEN TESTING MARKET, BY PRODUCT AND SERVICE, 2022-2032 ($MILLION)
- TABLE 82. ARGENTINA PYROGEN TESTING MARKET, BY TEST TYPE, 2022-2032 ($MILLION)
- TABLE 83. ARGENTINA PYROGEN TESTING MARKET, BY END USER, 2022-2032 ($MILLION)
- TABLE 84. REST OF LA PYROGEN TESTING MARKET, BY PRODUCT AND SERVICE, 2022-2032 ($MILLION)
- TABLE 85. REST OF LA PYROGEN TESTING MARKET, BY TEST TYPE, 2022-2032 ($MILLION)
- TABLE 86. REST OF LA PYROGEN TESTING MARKET, BY END USER, 2022-2032 ($MILLION)
- TABLE 87. MIDDLE EAST AND AFRICA PYROGEN TESTING MARKET, BY PRODUCT AND SERVICE, 2022-2032 ($MILLION)
- TABLE 88. MIDDLE EAST AND AFRICA PYROGEN TESTING MARKET, BY TEST TYPE, 2022-2032 ($MILLION)
- TABLE 89. MIDDLE EAST AND AFRICA PYROGEN TESTING MARKET, BY END USER, 2022-2032 ($MILLION)
- TABLE 90. MIDDLE EAST AND AFRICA PYROGEN TESTING MARKET, BY COUNTRY, 2022-2032 ($MILLION)
- TABLE 91. GCC PYROGEN TESTING MARKET, BY PRODUCT AND SERVICE, 2022-2032 ($MILLION)
- TABLE 92. GCC PYROGEN TESTING MARKET, BY TEST TYPE, 2022-2032 ($MILLION)
- TABLE 93. GCC PYROGEN TESTING MARKET, BY END USER, 2022-2032 ($MILLION)
- TABLE 94. SOUTH AFRICA PYROGEN TESTING MARKET, BY PRODUCT AND SERVICE, 2022-2032 ($MILLION)
- TABLE 95. SOUTH AFRICA PYROGEN TESTING MARKET, BY TEST TYPE, 2022-2032 ($MILLION)
- TABLE 96. SOUTH AFRICA PYROGEN TESTING MARKET, BY END USER, 2022-2032 ($MILLION)
- TABLE 97. NORTH AFRICA PYROGEN TESTING MARKET, BY PRODUCT AND SERVICE, 2022-2032 ($MILLION)
- TABLE 98. NORTH AFRICA PYROGEN TESTING MARKET, BY TEST TYPE, 2022-2032 ($MILLION)
- TABLE 99. NORTH AFRICA PYROGEN TESTING MARKET, BY END USER, 2022-2032 ($MILLION)
- TABLE 100. REST OF MEA PYROGEN TESTING MARKET, BY PRODUCT AND SERVICE, 2022-2032 ($MILLION)
- TABLE 101. REST OF MEA PYROGEN TESTING MARKET, BY TEST TYPE, 2022-2032 ($MILLION)
- TABLE 102. REST OF MEA PYROGEN TESTING MARKET, BY END USER, 2022-2032 ($MILLION)
- TABLE 103. LONZA GROUP AG: KEY EXECUTIVES
- TABLE 104. LONZA GROUP AG: COMPANY SNAPSHOT
- TABLE 105. LONZA GROUP AG: PRODUCT SEGMENTS
- TABLE 106. LONZA GROUP AG: SERVICE SEGMENTS
- TABLE 107. LONZA GROUP AG: PRODUCT PORTFOLIO
- TABLE 108. LONZA GROUP AG: KEY STRATERGIES
- TABLE 109. THERMO FISHER SCIENTIFIC INC. : KEY EXECUTIVES
- TABLE 110. THERMO FISHER SCIENTIFIC INC. : COMPANY SNAPSHOT
- TABLE 111. THERMO FISHER SCIENTIFIC INC. : PRODUCT SEGMENTS
- TABLE 112. THERMO FISHER SCIENTIFIC INC. : SERVICE SEGMENTS
- TABLE 113. THERMO FISHER SCIENTIFIC INC. : PRODUCT PORTFOLIO
- TABLE 114. THERMO FISHER SCIENTIFIC INC. : KEY STRATERGIES
- TABLE 115. FUJIFILM HOLDINGS CORPORATION: KEY EXECUTIVES
- TABLE 116. FUJIFILM HOLDINGS CORPORATION: COMPANY SNAPSHOT
- TABLE 117. FUJIFILM HOLDINGS CORPORATION: PRODUCT SEGMENTS
- TABLE 118. FUJIFILM HOLDINGS CORPORATION: SERVICE SEGMENTS
- TABLE 119. FUJIFILM HOLDINGS CORPORATION: PRODUCT PORTFOLIO
- TABLE 120. FUJIFILM HOLDINGS CORPORATION: KEY STRATERGIES
- TABLE 121. GENSCRIPT: KEY EXECUTIVES
- TABLE 122. GENSCRIPT: COMPANY SNAPSHOT
- TABLE 123. GENSCRIPT: PRODUCT SEGMENTS
- TABLE 124. GENSCRIPT: SERVICE SEGMENTS
- TABLE 125. GENSCRIPT: PRODUCT PORTFOLIO
- TABLE 126. GENSCRIPT: KEY STRATERGIES
- TABLE 127. SEIKAGAKU CORPORATION: KEY EXECUTIVES
- TABLE 128. SEIKAGAKU CORPORATION: COMPANY SNAPSHOT
- TABLE 129. SEIKAGAKU CORPORATION: PRODUCT SEGMENTS
- TABLE 130. SEIKAGAKU CORPORATION: SERVICE SEGMENTS
- TABLE 131. SEIKAGAKU CORPORATION: PRODUCT PORTFOLIO
- TABLE 132. SEIKAGAKU CORPORATION: KEY STRATERGIES
- TABLE 133. CHARLES RIVER LABORATORIES: KEY EXECUTIVES
- TABLE 134. CHARLES RIVER LABORATORIES: COMPANY SNAPSHOT
- TABLE 135. CHARLES RIVER LABORATORIES: PRODUCT SEGMENTS
- TABLE 136. CHARLES RIVER LABORATORIES: SERVICE SEGMENTS
- TABLE 137. CHARLES RIVER LABORATORIES: PRODUCT PORTFOLIO
- TABLE 138. CHARLES RIVER LABORATORIES: KEY STRATERGIES
- TABLE 139. STERIS PLC: KEY EXECUTIVES
- TABLE 140. STERIS PLC: COMPANY SNAPSHOT
- TABLE 141. STERIS PLC: PRODUCT SEGMENTS
- TABLE 142. STERIS PLC: SERVICE SEGMENTS
- TABLE 143. STERIS PLC: PRODUCT PORTFOLIO
- TABLE 144. STERIS PLC: KEY STRATERGIES
- TABLE 145. WUXI APPTEC: KEY EXECUTIVES
- TABLE 146. WUXI APPTEC: COMPANY SNAPSHOT
- TABLE 147. WUXI APPTEC: PRODUCT SEGMENTS
- TABLE 148. WUXI APPTEC: SERVICE SEGMENTS
- TABLE 149. WUXI APPTEC: PRODUCT PORTFOLIO
- TABLE 150. WUXI APPTEC: KEY STRATERGIES
- TABLE 151. EUROFINS SCIENTIFIC SE: KEY EXECUTIVES
- TABLE 152. EUROFINS SCIENTIFIC SE: COMPANY SNAPSHOT
- TABLE 153. EUROFINS SCIENTIFIC SE: PRODUCT SEGMENTS
- TABLE 154. EUROFINS SCIENTIFIC SE: SERVICE SEGMENTS
- TABLE 155. EUROFINS SCIENTIFIC SE: PRODUCT PORTFOLIO
- TABLE 156. EUROFINS SCIENTIFIC SE: KEY STRATERGIES
- TABLE 157. MERCK KGAA: KEY EXECUTIVES
- TABLE 158. MERCK KGAA: COMPANY SNAPSHOT
- TABLE 159. MERCK KGAA: PRODUCT SEGMENTS
- TABLE 160. MERCK KGAA: SERVICE SEGMENTS
- TABLE 161. MERCK KGAA: PRODUCT PORTFOLIO
- TABLE 162. MERCK KGAA: KEY STRATERGIES
LIST OF FIGURES
- FIGURE 01. PYROGEN TESTING MARKET, 2022-2032
- FIGURE 02. SEGMENTATION OF PYROGEN TESTING MARKET,2022-2032
- FIGURE 03. TOP IMPACTING FACTORS IN PYROGEN TESTING MARKET
- FIGURE 04. TOP INVESTMENT POCKETS IN PYROGEN TESTING MARKET (2023-2032)
- FIGURE 05. LOW BARGAINING POWER OF SUPPLIERS
- FIGURE 06. LOW THREAT OF NEW ENTRANTS
- FIGURE 07. LOW THREAT OF SUBSTITUTES
- FIGURE 08. LOW INTENSITY OF RIVALRY
- FIGURE 09. LOW BARGAINING POWER OF BUYERS
- FIGURE 10. GLOBAL PYROGEN TESTING MARKET:DRIVERS, RESTRAINTS AND OPPORTUNITIES
- FIGURE 11. PYROGEN TESTING MARKET, BY PRODUCT AND SERVICE, 2022 AND 2032(%)
- FIGURE 12. COMPARATIVE SHARE ANALYSIS OF PYROGEN TESTING MARKET FOR REAGENTS AND KITS, BY COUNTRY 2022 AND 2032(%)
- FIGURE 13. COMPARATIVE SHARE ANALYSIS OF PYROGEN TESTING MARKET FOR INSTRUMENTS, BY COUNTRY 2022 AND 2032(%)
- FIGURE 14. COMPARATIVE SHARE ANALYSIS OF PYROGEN TESTING MARKET FOR SERVICES, BY COUNTRY 2022 AND 2032(%)
- FIGURE 15. PYROGEN TESTING MARKET, BY TEST TYPE, 2022 AND 2032(%)
- FIGURE 16. COMPARATIVE SHARE ANALYSIS OF PYROGEN TESTING MARKET FOR LAL TEST, BY COUNTRY 2022 AND 2032(%)
- FIGURE 17. COMPARATIVE SHARE ANALYSIS OF PYROGEN TESTING MARKET FOR RABBIT PYROGEN TEST, BY COUNTRY 2022 AND 2032(%)
- FIGURE 18. COMPARATIVE SHARE ANALYSIS OF PYROGEN TESTING MARKET FOR OTHERS, BY COUNTRY 2022 AND 2032(%)
- FIGURE 19. PYROGEN TESTING MARKET, BY END USER, 2022 AND 2032(%)
- FIGURE 20. COMPARATIVE SHARE ANALYSIS OF PYROGEN TESTING MARKET FOR PHARMACEUTICAL AND BIOTECHNOLOGY COMPANIES, BY COUNTRY 2022 AND 2032(%)
- FIGURE 21. COMPARATIVE SHARE ANALYSIS OF PYROGEN TESTING MARKET FOR MEDICAL DEVICE COMPANIES, BY COUNTRY 2022 AND 2032(%)
- FIGURE 22. COMPARATIVE SHARE ANALYSIS OF PYROGEN TESTING MARKET FOR OTHERS, BY COUNTRY 2022 AND 2032(%)
- FIGURE 23. PYROGEN TESTING MARKET BY REGION, 2022 AND 2032(%)
- FIGURE 24. U.S. PYROGEN TESTING MARKET, 2022-2032 ($MILLION)
- FIGURE 25. CANADA PYROGEN TESTING MARKET, 2022-2032 ($MILLION)
- FIGURE 26. MEXICO PYROGEN TESTING MARKET, 2022-2032 ($MILLION)
- FIGURE 27. GERMANY PYROGEN TESTING MARKET, 2022-2032 ($MILLION)
- FIGURE 28. FRANCE PYROGEN TESTING MARKET, 2022-2032 ($MILLION)
- FIGURE 29. UK PYROGEN TESTING MARKET, 2022-2032 ($MILLION)
- FIGURE 30. ITALY PYROGEN TESTING MARKET, 2022-2032 ($MILLION)
- FIGURE 31. SPAIN PYROGEN TESTING MARKET, 2022-2032 ($MILLION)
- FIGURE 32. REST OF EUROPE PYROGEN TESTING MARKET, 2022-2032 ($MILLION)
- FIGURE 33. JAPAN PYROGEN TESTING MARKET, 2022-2032 ($MILLION)
- FIGURE 34. CHINA PYROGEN TESTING MARKET, 2022-2032 ($MILLION)
- FIGURE 35. INDIA PYROGEN TESTING MARKET, 2022-2032 ($MILLION)
- FIGURE 36. AUSTRALIA PYROGEN TESTING MARKET, 2022-2032 ($MILLION)
- FIGURE 37. SOUTH KOREA PYROGEN TESTING MARKET, 2022-2032 ($MILLION)
- FIGURE 38. REST OF ASIA-PACIFIC PYROGEN TESTING MARKET, 2022-2032 ($MILLION)
- FIGURE 39. BRAZIL PYROGEN TESTING MARKET, 2022-2032 ($MILLION)
- FIGURE 40. COLOMBIA PYROGEN TESTING MARKET, 2022-2032 ($MILLION)
- FIGURE 41. ARGENTINA PYROGEN TESTING MARKET, 2022-2032 ($MILLION)
- FIGURE 42. REST OF LA PYROGEN TESTING MARKET, 2022-2032 ($MILLION)
- FIGURE 43. GCC PYROGEN TESTING MARKET, 2022-2032 ($MILLION)
- FIGURE 44. SOUTH AFRICA PYROGEN TESTING MARKET, 2022-2032 ($MILLION)
- FIGURE 45. NORTH AFRICA PYROGEN TESTING MARKET, 2022-2032 ($MILLION)
- FIGURE 46. REST OF MEA PYROGEN TESTING MARKET, 2022-2032 ($MILLION)
- FIGURE 47. TOP WINNING STRATEGIES, BY YEAR
- FIGURE 48. TOP WINNING STRATEGIES, BY DEVELOPMENT
- FIGURE 49. TOP WINNING STRATEGIES, BY COMPANY
- FIGURE 50. PRODUCT MAPPING OF TOP 10 PLAYERS
- FIGURE 51. COMPETITIVE DASHBOARD
- FIGURE 52. COMPETITIVE HEATMAP: PYROGEN TESTING MARKET
- FIGURE 53. TOP PLAYER POSITIONING, 2022
 熱原測試(熱原測試)的全球市場規模、佔有率和趨勢分析報告:按產品/服務、按測試類型、按最終用戶、按地區、前景和預測,2023-2030 年
 熱原測試市場規模、佔有率、趨勢分析報告:按產品類型、最終用途、地區和細分市場預測,2024-2030 年
 單核細胞活化測試市場規模和預測(2020 - 2030)、全球和地區佔有率、趨勢和成長機會分析報告範圍:按來源(PMBC 和細胞株)、產品(MAT 試劑盒和試劑)和應用
 熱原測試的全球市場:市場規模和份額分析(按產品、類型、最終用戶) - 工業需求預測(截至 2030 年)
 熱原測試市場:2023-2028 年全球產業趨勢、佔有率、規模、成長、機會與預測
 單核細胞活化測試市場:按產品、來源、應用和最終用戶 - 2023-2030 年全球預測
 單核細胞激活測試的全球市場
 單核細胞活化測試市場(產品類型:MAT 試劑盒和試劑;來源:基於 PBMC 和基於細胞系)- 全球產業分析、規模、佔有率、成長、趨勢和預測,2023-2031 年
 熱原測試市場:按組件、測試類型和最終用戶分類 - COVID-19、俄羅斯-烏克蘭衝突和高累積的累積影響 - 2023-2030 年全球預測
 熱原實驗:全球市場的展望