


 |
市場調查報告書
商品編碼
1414964
氫氣壓縮機市場:依技術類型、潤滑類型、最終用戶產業:2023-2032 年全球機會分析與產業預測Hydrogen Compressor Market By Technology Type, By Lubrication Type, By End User Industry : Global Opportunity Analysis and Industry Forecast, 2023-2032 |
||||||
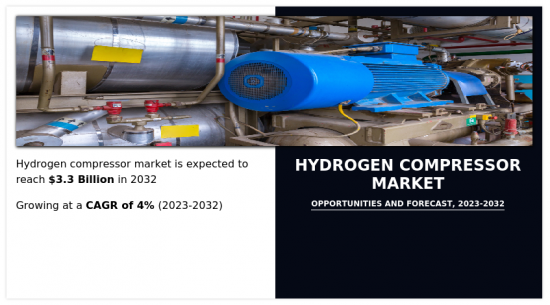
2022年氫氣壓縮機市值為23億美元,預計2023年至2032年複合年成長率為4%,到2032年將達33億美元。
氫氣壓縮機是一種用於減少氫氣體積以增加其壓力,產生液態氫的裝置,也稱為壓縮氫。氫氣壓縮機用於對氫氣加壓。煉油廠經常採用這項技術來幫助精製原油。氫氣擴大在精製中使用,包括用於加工燃料和去除雜質。氫燃料電池提供連續電力,同時需要較少的維護、空間和噪音。
氫氣壓縮機用於各個行業,例如:
- 石油和天然氣、化學品、汽車。許多汽車製造商正在嘗試開發氫燃料電池汽車。這些汽車目前正在研究和開發中。因此,這可能成為氫氣壓縮機產業的主要推動力。此外,世界各國的加氫站也不斷增加。加氫站最重要的部件之一是氫氣壓縮機。因此,在整個預測期內,對氫氣壓縮機的需求預計將增加。
各大主要企業正在透過收購其他有望增強產品系列的公司來加強其市場地位並擴大其業務。例如,2022 年 8 月,全球關鍵任務流程創建和工業解決方案供應商英格索蘭公司宣布,Holtec Gas Systems LLC、上海瀚業空氣淨化技術有限公司、Hydro Prokav Pumps (India) Private Limited 與我們合作已簽署收購協議。 Holtec 和 Hanye 擴展了 Ingersoll Rand 的空氣處理能力,並拓寬了其為更大的壓縮機生態系統提供的解決方案的範圍。因此,此次收購預計將擴大氫氣壓縮機的分銷,並可能有利於預測期內全球市場的成長。
氫氣壓縮機市場按技術類型、潤滑劑類型、最終用戶和地區進行細分。根據技術類型,市場分為機械市場和非機械市場。從潤滑油的種類上來說,分為油性潤滑油和無油潤滑油。依最終用戶行業分為石油天然氣、化學、汽車等。依地區分類,我們有北美(美國、加拿大、墨西哥)、歐洲(英國、法國、德國、義大利、荷蘭其他歐洲國家地區)、亞太地區(中國、日本、印度、泰國等亞洲地區)太平洋地區)和其他亞洲地區。市場分析將在太平洋地區(拉丁美洲、中東和非洲)進行。
目錄
第1章簡介
第 2 章執行摘要
第3章市場概況
- 市場定義和範圍
- 主要發現
- 影響因素
- 主要投資機會
- 波特五力分析
- 市場動態
- 促進因素
- 新興國家快速工業化
- 石油和天然氣產業的成長
- 抑制因素
- 投資和維護成本高
- 機會
- 技術進步
- 促進因素
第4章氫氣壓縮機市場:依技術類型
- 概述
- 機械壓縮機
- 非機械壓縮機
第5章氫氣壓縮機市場:依潤滑型
- 概述
- 油基
- 不含油
第6章氫氣壓縮機市場:依最終用戶產業
- 概述
- 油和氣
- 化學
- 車
- 其他
第7章氫氣壓縮機市場:依地區
- 概述
- 北美洲
- 美國
- 加拿大
- 墨西哥
- 歐洲
- 德國
- 法國
- 英國
- 義大利
- 荷蘭
- 其他
- 亞太地區
- 中國
- 印度
- 日本
- 泰國
- 其他
- 拉丁美洲/中東/非洲
- 拉丁美洲
- 中東
- 非洲
第8章 競爭形勢
- 介紹
- 關鍵成功策略
- 10家主要企業產品圖譜
- 競爭對手儀表板
- 競爭熱圖
- 2022年主要企業定位
第9章 公司簡介
- IDEX CORPORATION
- ARIEL CORPORATION
- ATLAS COPCO AB
- Fluitron Inc.
- HAUG SAUER KOMPRESSOREN AG
- NEL ASA
- Ingersoll Rand Inc.
- Chart Industries, Inc.(Howden Group)
- Burckhardt Compression Holding AG
- Hitachi Ltd.
According to a new report published by Allied Market Research, titled, "Hydrogen Compressor Market," The hydrogen compressor market was valued at $2.3 billion in 2022, and is estimated to reach $3.3 billion by 2032, growing at a CAGR of 4% from 2023 to 2032.
Hydrogen compressor is a device that is used to reduce volume in order to raise hydrogen pressure, results in liquid hydrogen, also known as compressed hydrogen. Hydrogen compressors are employed to pressurize the hydrogen. The technique is frequently employed in refineries to help with crude oil refinement. Hydrogen has increasingly been used in refineries for processing fuels, eliminating impurities, and other uses. The hydrogen fuel cell provides continuous electricity while needing less maintenance, space, and noise.
Hydrogen compressors are used in a variety of industries such as oil & gas, chemical and automotive. Many automotive manufacturers have attempted to develop hydrogen fuel cell automobiles. These vehicles are currently undergoing R&D. As a result, this might be a major driver of the hydrogen compressor industry. Furthermore, hydrogen refueling stations have grown in various nations across the globe. One of the most significant components of a hydrogen refueling station is the hydrogen compressor. As a result, demand for hydrogen compressors is predicted to increase throughout the forecast period.
Various key players have strengthened their market position and expanded their business by acquiring other companies which are expected to enhance their product portfolio. For instance, in August 2022, Ingersoll Rand Inc. a global provider of mission-critical flow creation and industrial solutions, entered into agreements to acquire Holtec Gas Systems LLC, Shanghai Hanye Air Purifying Technology Co., Ltd, and Hydro Prokav Pumps (India) Private Limited. Holtec and Hanye expand Ingersoll Rand's air treatment capabilities and enhance the breadth of solutions provided for the larger compressor ecosystem. Hence, this acquisition is anticipated to increase the distribution of hydrogen compressors, which is likely to be opportunistic for the growth of the global market during the forecast period.
The hydrogen compressor market is segmented on the basis of technology type, lubricant type, end user and region. On the basis of technology type, the market is bifurcated into mechanical and non-mechanical. On the basis of lubricant type, it is bifurcated into oil-based and oil-free. On the basis of end user industry, it is divided into oil & gas, chemical, automotive and others. On the basis of region, the market analysis is conducted across North America (the U.S., Canada, and Mexico), Europe (the UK, France, Germany, Italy, Netherlands, and rest of Europe), Asia-Pacific (China, Japan, India, Thailand, and rest of Asia-Pacific), and LAMEA (Latin America, the Middle East, and Africa).
COMPETITION ANALYSIS
Key companies profiled in the hydrogen compressor market report include: Ariel Corporation, Atlas Copco, Burckhardt Compression AG, Fluitron, HAUG Sauer Kompressoren AG, Hitachi, Ltd., Howden Group, IDEX Corporation, Ingersoll Rand, Inc., Nel ASA.
Key Benefits For Stakeholders
- This report provides a quantitative analysis of the market segments, current trends, estimations, and dynamics of the hydrogen compressor market analysis from 2022 to 2032 to identify the prevailing hydrogen compressor market opportunities.
- The market research is offered along with information related to key drivers, restraints, and opportunities.
- Porter's five forces analysis highlights the potency of buyers and suppliers to enable stakeholders make profit-oriented business decisions and strengthen their supplier-buyer network.
- In-depth analysis of the hydrogen compressor market segmentation assists to determine the prevailing market opportunities.
- Major countries in each region are mapped according to their revenue contribution to the global market.
- Market player positioning facilitates benchmarking and provides a clear understanding of the present position of the market players.
- The report includes the analysis of the regional as well as global hydrogen compressor market trends, key players, market segments, application areas, and market growth strategies.
Additional benefits you will get with this purchase are:
- Quarterly Update and* (only available with a corporate license, on listed price)
- 5 additional Company Profile of client Choice pre- or Post-purchase, as a free update.
- Free Upcoming Version on the Purchase of Five and Enterprise User License.
- 16 analyst hours of support* (post-purchase, if you find additional data requirements upon review of the report, you may receive support amounting to 16 analyst hours to solve questions, and post-sale queries)
- 15% Free Customization* (in case the scope or segment of the report does not match your requirements, 15% is equivalent to 3 working days of free work, applicable once)
- Free data Pack on the Five and Enterprise User License. (Excel version of the report)
- Free Updated report if the report is 6-12 months old or older.
- 24-hour priority response*
- Free Industry updates and white papers.
Possible Customization with this report (with additional cost and timeline, please talk to the sales executive to know more)
- Manufacturing Capacity
- End user preferences and pain points
- Industry life cycle assessment, by region
- Product Benchmarking / Product specification and applications
- Product Life Cycles
- Senario Analysis & Growth Trend Comparision
- Supply Chain Analysis & Vendor Margins
- Distributor margin Analysis
- Go To Market Strategy
- Market share analysis of players by products/segments
- New Product Development/ Product Matrix of Key Players
- Regulatory Guidelines
- Strategic Recommedations
- Additional company profiles with specific to client's interest
- Additional country or region analysis- market size and forecast
- Average Selling Price Analysis / Price Point Analysis
- Brands Share Analysis
- Criss-cross segment analysis- market size and forecast
- Expanded list for Company Profiles
- Historic market data
- List of customers/consumers/raw material suppliers- value chain analysis
- Market share analysis of players at global/region/country level
- SWOT Analysis
- Volume Market Size and Forecast
Key Market Segments
By Technology Type
- Mechanical Compressors
- Non-Mechanical Compressors
By Lubrication Type
- Oil-based
- Oil-free
By End User Industry
- Oil and Gas
- Chemical
- Automotive
- Others
By Region
- North America
- U.S.
- Canada
- Mexico
- Europe
- Germany
- France
- UK
- Italy
- Netherlands
- Rest of Europe
- Asia-Pacific
- China
- India
- Japan
- Thailand
- Rest of Asia-Pacific
- LAMEA
- Latin America
- Middle East
- Africa
Key Market Players:
- NEL ASA
- Fluitron Inc.
- IDEX CORPORATION
- ARIEL CORPORATION
- Ingersoll Rand Inc.
- Chart Industries, Inc. (Howden Group)
- Burckhardt Compression Holding AG
- HAUG SAUER KOMPRESSOREN AG
- ATLAS COPCO AB
- Hitachi Ltd.
TABLE OF CONTENTS
CHAPTER 1: INTRODUCTION
- 1.1. Report description
- 1.2. Key market segments
- 1.3. Key benefits to the stakeholders
- 1.4. Research methodology
- 1.4.1. Primary research
- 1.4.2. Secondary research
- 1.4.3. Analyst tools and models
CHAPTER 2: EXECUTIVE SUMMARY
- 2.1. CXO Perspective
CHAPTER 3: MARKET OVERVIEW
- 3.1. Market definition and scope
- 3.2. Key findings
- 3.2.1. Top impacting factors
- 3.2.2. Top investment pockets
- 3.3. Porter's five forces analysis
- 3.3.1. Low bargaining power of suppliers
- 3.3.2. Low threat of new entrants
- 3.3.3. Low threat of substitutes
- 3.3.4. Low intensity of rivalry
- 3.3.5. Low bargaining power of buyers
- 3.4. Market dynamics
- 3.4.1. Drivers
- 3.4.1.1. Rapid industrialization in developing countries
- 3.4.1.2. Growth in the oil & gas sector
- 3.4.2. Restraints
- 3.4.2.1. High Investment and Maintenance Cost
- 3.4.3. Opportunities
- 3.4.3.1. Technological advancements
- 3.4.1. Drivers
CHAPTER 4: HYDROGEN COMPRESSOR MARKET, BY TECHNOLOGY TYPE
- 4.1. Overview
- 4.1.1. Market size and forecast
- 4.2. Mechanical Compressors
- 4.2.1. Key market trends, growth factors and opportunities
- 4.2.2. Market size and forecast, by region
- 4.2.3. Market share analysis by country
- 4.3. Non-Mechanical Compressors
- 4.3.1. Key market trends, growth factors and opportunities
- 4.3.2. Market size and forecast, by region
- 4.3.3. Market share analysis by country
CHAPTER 5: HYDROGEN COMPRESSOR MARKET, BY LUBRICATION TYPE
- 5.1. Overview
- 5.1.1. Market size and forecast
- 5.2. Oil-based
- 5.2.1. Key market trends, growth factors and opportunities
- 5.2.2. Market size and forecast, by region
- 5.2.3. Market share analysis by country
- 5.3. Oil-free
- 5.3.1. Key market trends, growth factors and opportunities
- 5.3.2. Market size and forecast, by region
- 5.3.3. Market share analysis by country
CHAPTER 6: HYDROGEN COMPRESSOR MARKET, BY END USER INDUSTRY
- 6.1. Overview
- 6.1.1. Market size and forecast
- 6.2. Oil and Gas
- 6.2.1. Key market trends, growth factors and opportunities
- 6.2.2. Market size and forecast, by region
- 6.2.3. Market share analysis by country
- 6.3. Chemical
- 6.3.1. Key market trends, growth factors and opportunities
- 6.3.2. Market size and forecast, by region
- 6.3.3. Market share analysis by country
- 6.4. Automotive
- 6.4.1. Key market trends, growth factors and opportunities
- 6.4.2. Market size and forecast, by region
- 6.4.3. Market share analysis by country
- 6.5. Others
- 6.5.1. Key market trends, growth factors and opportunities
- 6.5.2. Market size and forecast, by region
- 6.5.3. Market share analysis by country
CHAPTER 7: HYDROGEN COMPRESSOR MARKET, BY REGION
- 7.1. Overview
- 7.1.1. Market size and forecast By Region
- 7.2. North America
- 7.2.1. Key market trends, growth factors and opportunities
- 7.2.2. Market size and forecast, by Technology Type
- 7.2.3. Market size and forecast, by Lubrication Type
- 7.2.4. Market size and forecast, by End User Industry
- 7.2.5. Market size and forecast, by country
- 7.2.5.1. U.S.
- 7.2.5.1.1. Market size and forecast, by Technology Type
- 7.2.5.1.2. Market size and forecast, by Lubrication Type
- 7.2.5.1.3. Market size and forecast, by End User Industry
- 7.2.5.2. Canada
- 7.2.5.2.1. Market size and forecast, by Technology Type
- 7.2.5.2.2. Market size and forecast, by Lubrication Type
- 7.2.5.2.3. Market size and forecast, by End User Industry
- 7.2.5.3. Mexico
- 7.2.5.3.1. Market size and forecast, by Technology Type
- 7.2.5.3.2. Market size and forecast, by Lubrication Type
- 7.2.5.3.3. Market size and forecast, by End User Industry
- 7.3. Europe
- 7.3.1. Key market trends, growth factors and opportunities
- 7.3.2. Market size and forecast, by Technology Type
- 7.3.3. Market size and forecast, by Lubrication Type
- 7.3.4. Market size and forecast, by End User Industry
- 7.3.5. Market size and forecast, by country
- 7.3.5.1. Germany
- 7.3.5.1.1. Market size and forecast, by Technology Type
- 7.3.5.1.2. Market size and forecast, by Lubrication Type
- 7.3.5.1.3. Market size and forecast, by End User Industry
- 7.3.5.2. France
- 7.3.5.2.1. Market size and forecast, by Technology Type
- 7.3.5.2.2. Market size and forecast, by Lubrication Type
- 7.3.5.2.3. Market size and forecast, by End User Industry
- 7.3.5.3. UK
- 7.3.5.3.1. Market size and forecast, by Technology Type
- 7.3.5.3.2. Market size and forecast, by Lubrication Type
- 7.3.5.3.3. Market size and forecast, by End User Industry
- 7.3.5.4. Italy
- 7.3.5.4.1. Market size and forecast, by Technology Type
- 7.3.5.4.2. Market size and forecast, by Lubrication Type
- 7.3.5.4.3. Market size and forecast, by End User Industry
- 7.3.5.5. Netherlands
- 7.3.5.5.1. Market size and forecast, by Technology Type
- 7.3.5.5.2. Market size and forecast, by Lubrication Type
- 7.3.5.5.3. Market size and forecast, by End User Industry
- 7.3.5.6. Rest of Europe
- 7.3.5.6.1. Market size and forecast, by Technology Type
- 7.3.5.6.2. Market size and forecast, by Lubrication Type
- 7.3.5.6.3. Market size and forecast, by End User Industry
- 7.4. Asia-Pacific
- 7.4.1. Key market trends, growth factors and opportunities
- 7.4.2. Market size and forecast, by Technology Type
- 7.4.3. Market size and forecast, by Lubrication Type
- 7.4.4. Market size and forecast, by End User Industry
- 7.4.5. Market size and forecast, by country
- 7.4.5.1. China
- 7.4.5.1.1. Market size and forecast, by Technology Type
- 7.4.5.1.2. Market size and forecast, by Lubrication Type
- 7.4.5.1.3. Market size and forecast, by End User Industry
- 7.4.5.2. India
- 7.4.5.2.1. Market size and forecast, by Technology Type
- 7.4.5.2.2. Market size and forecast, by Lubrication Type
- 7.4.5.2.3. Market size and forecast, by End User Industry
- 7.4.5.3. Japan
- 7.4.5.3.1. Market size and forecast, by Technology Type
- 7.4.5.3.2. Market size and forecast, by Lubrication Type
- 7.4.5.3.3. Market size and forecast, by End User Industry
- 7.4.5.4. Thailand
- 7.4.5.4.1. Market size and forecast, by Technology Type
- 7.4.5.4.2. Market size and forecast, by Lubrication Type
- 7.4.5.4.3. Market size and forecast, by End User Industry
- 7.4.5.5. Rest of Asia-Pacific
- 7.4.5.5.1. Market size and forecast, by Technology Type
- 7.4.5.5.2. Market size and forecast, by Lubrication Type
- 7.4.5.5.3. Market size and forecast, by End User Industry
- 7.5. LAMEA
- 7.5.1. Key market trends, growth factors and opportunities
- 7.5.2. Market size and forecast, by Technology Type
- 7.5.3. Market size and forecast, by Lubrication Type
- 7.5.4. Market size and forecast, by End User Industry
- 7.5.5. Market size and forecast, by country
- 7.5.5.1. Latin America
- 7.5.5.1.1. Market size and forecast, by Technology Type
- 7.5.5.1.2. Market size and forecast, by Lubrication Type
- 7.5.5.1.3. Market size and forecast, by End User Industry
- 7.5.5.2. Middle East
- 7.5.5.2.1. Market size and forecast, by Technology Type
- 7.5.5.2.2. Market size and forecast, by Lubrication Type
- 7.5.5.2.3. Market size and forecast, by End User Industry
- 7.5.5.3. Africa
- 7.5.5.3.1. Market size and forecast, by Technology Type
- 7.5.5.3.2. Market size and forecast, by Lubrication Type
- 7.5.5.3.3. Market size and forecast, by End User Industry
CHAPTER 8: COMPETITIVE LANDSCAPE
- 8.1. Introduction
- 8.2. Top winning strategies
- 8.3. Product mapping of top 10 player
- 8.4. Competitive dashboard
- 8.5. Competitive heatmap
- 8.6. Top player positioning, 2022
CHAPTER 9: COMPANY PROFILES
- 9.1. IDEX CORPORATION
- 9.1.1. Company overview
- 9.1.2. Key executives
- 9.1.3. Company snapshot
- 9.1.4. Operating business segments
- 9.1.5. Product portfolio
- 9.1.6. Business performance
- 9.2. ARIEL CORPORATION
- 9.2.1. Company overview
- 9.2.2. Key executives
- 9.2.3. Company snapshot
- 9.2.4. Operating business segments
- 9.2.5. Product portfolio
- 9.2.6. Key strategic moves and developments
- 9.3. ATLAS COPCO AB
- 9.3.1. Company overview
- 9.3.2. Key executives
- 9.3.3. Company snapshot
- 9.3.4. Operating business segments
- 9.3.5. Product portfolio
- 9.3.6. Business performance
- 9.3.7. Key strategic moves and developments
- 9.4. Fluitron Inc.
- 9.4.1. Company overview
- 9.4.2. Key executives
- 9.4.3. Company snapshot
- 9.4.4. Operating business segments
- 9.4.5. Product portfolio
- 9.5. HAUG SAUER KOMPRESSOREN AG
- 9.5.1. Company overview
- 9.5.2. Key executives
- 9.5.3. Company snapshot
- 9.5.4. Operating business segments
- 9.5.5. Product portfolio
- 9.6. NEL ASA
- 9.6.1. Company overview
- 9.6.2. Key executives
- 9.6.3. Company snapshot
- 9.6.4. Operating business segments
- 9.6.5. Product portfolio
- 9.6.6. Business performance
- 9.6.7. Key strategic moves and developments
- 9.7. Ingersoll Rand Inc.
- 9.7.1. Company overview
- 9.7.2. Key executives
- 9.7.3. Company snapshot
- 9.7.4. Operating business segments
- 9.7.5. Product portfolio
- 9.7.6. Business performance
- 9.7.7. Key strategic moves and developments
- 9.8. Chart Industries, Inc. (Howden Group)
- 9.8.1. Company overview
- 9.8.2. Key executives
- 9.8.3. Company snapshot
- 9.8.4. Operating business segments
- 9.8.5. Product portfolio
- 9.8.6. Business performance
- 9.9. Burckhardt Compression Holding AG
- 9.9.1. Company overview
- 9.9.2. Key executives
- 9.9.3. Company snapshot
- 9.9.4. Operating business segments
- 9.9.5. Product portfolio
- 9.9.6. Business performance
- 9.9.7. Key strategic moves and developments
- 9.10. Hitachi Ltd.
- 9.10.1. Company overview
- 9.10.2. Key executives
- 9.10.3. Company snapshot
- 9.10.4. Operating business segments
- 9.10.5. Product portfolio
- 9.10.6. Business performance
LIST OF TABLES
- TABLE 01. GLOBAL HYDROGEN COMPRESSOR MARKET, BY TECHNOLOGY TYPE, 2022-2032 ($MILLION)
- TABLE 02. HYDROGEN COMPRESSOR MARKET FOR MECHANICAL COMPRESSORS, BY REGION, 2022-2032 ($MILLION)
- TABLE 03. HYDROGEN COMPRESSOR MARKET FOR NON-MECHANICAL COMPRESSORS, BY REGION, 2022-2032 ($MILLION)
- TABLE 04. GLOBAL HYDROGEN COMPRESSOR MARKET, BY LUBRICATION TYPE, 2022-2032 ($MILLION)
- TABLE 05. HYDROGEN COMPRESSOR MARKET FOR OIL-BASED, BY REGION, 2022-2032 ($MILLION)
- TABLE 06. HYDROGEN COMPRESSOR MARKET FOR OIL-FREE, BY REGION, 2022-2032 ($MILLION)
- TABLE 07. GLOBAL HYDROGEN COMPRESSOR MARKET, BY END USER INDUSTRY, 2022-2032 ($MILLION)
- TABLE 08. HYDROGEN COMPRESSOR MARKET FOR OIL AND GAS, BY REGION, 2022-2032 ($MILLION)
- TABLE 09. HYDROGEN COMPRESSOR MARKET FOR CHEMICAL, BY REGION, 2022-2032 ($MILLION)
- TABLE 10. HYDROGEN COMPRESSOR MARKET FOR AUTOMOTIVE, BY REGION, 2022-2032 ($MILLION)
- TABLE 11. HYDROGEN COMPRESSOR MARKET FOR OTHERS, BY REGION, 2022-2032 ($MILLION)
- TABLE 12. HYDROGEN COMPRESSOR MARKET, BY REGION, 2022-2032 ($MILLION)
- TABLE 13. NORTH AMERICA HYDROGEN COMPRESSOR MARKET, BY TECHNOLOGY TYPE, 2022-2032 ($MILLION)
- TABLE 14. NORTH AMERICA HYDROGEN COMPRESSOR MARKET, BY LUBRICATION TYPE, 2022-2032 ($MILLION)
- TABLE 15. NORTH AMERICA HYDROGEN COMPRESSOR MARKET, BY END USER INDUSTRY, 2022-2032 ($MILLION)
- TABLE 16. NORTH AMERICA HYDROGEN COMPRESSOR MARKET, BY COUNTRY, 2022-2032 ($MILLION)
- TABLE 17. U.S. HYDROGEN COMPRESSOR MARKET, BY TECHNOLOGY TYPE, 2022-2032 ($MILLION)
- TABLE 18. U.S. HYDROGEN COMPRESSOR MARKET, BY LUBRICATION TYPE, 2022-2032 ($MILLION)
- TABLE 19. U.S. HYDROGEN COMPRESSOR MARKET, BY END USER INDUSTRY, 2022-2032 ($MILLION)
- TABLE 20. CANADA HYDROGEN COMPRESSOR MARKET, BY TECHNOLOGY TYPE, 2022-2032 ($MILLION)
- TABLE 21. CANADA HYDROGEN COMPRESSOR MARKET, BY LUBRICATION TYPE, 2022-2032 ($MILLION)
- TABLE 22. CANADA HYDROGEN COMPRESSOR MARKET, BY END USER INDUSTRY, 2022-2032 ($MILLION)
- TABLE 23. MEXICO HYDROGEN COMPRESSOR MARKET, BY TECHNOLOGY TYPE, 2022-2032 ($MILLION)
- TABLE 24. MEXICO HYDROGEN COMPRESSOR MARKET, BY LUBRICATION TYPE, 2022-2032 ($MILLION)
- TABLE 25. MEXICO HYDROGEN COMPRESSOR MARKET, BY END USER INDUSTRY, 2022-2032 ($MILLION)
- TABLE 26. EUROPE HYDROGEN COMPRESSOR MARKET, BY TECHNOLOGY TYPE, 2022-2032 ($MILLION)
- TABLE 27. EUROPE HYDROGEN COMPRESSOR MARKET, BY LUBRICATION TYPE, 2022-2032 ($MILLION)
- TABLE 28. EUROPE HYDROGEN COMPRESSOR MARKET, BY END USER INDUSTRY, 2022-2032 ($MILLION)
- TABLE 29. EUROPE HYDROGEN COMPRESSOR MARKET, BY COUNTRY, 2022-2032 ($MILLION)
- TABLE 30. GERMANY HYDROGEN COMPRESSOR MARKET, BY TECHNOLOGY TYPE, 2022-2032 ($MILLION)
- TABLE 31. GERMANY HYDROGEN COMPRESSOR MARKET, BY LUBRICATION TYPE, 2022-2032 ($MILLION)
- TABLE 32. GERMANY HYDROGEN COMPRESSOR MARKET, BY END USER INDUSTRY, 2022-2032 ($MILLION)
- TABLE 33. FRANCE HYDROGEN COMPRESSOR MARKET, BY TECHNOLOGY TYPE, 2022-2032 ($MILLION)
- TABLE 34. FRANCE HYDROGEN COMPRESSOR MARKET, BY LUBRICATION TYPE, 2022-2032 ($MILLION)
- TABLE 35. FRANCE HYDROGEN COMPRESSOR MARKET, BY END USER INDUSTRY, 2022-2032 ($MILLION)
- TABLE 36. UK HYDROGEN COMPRESSOR MARKET, BY TECHNOLOGY TYPE, 2022-2032 ($MILLION)
- TABLE 37. UK HYDROGEN COMPRESSOR MARKET, BY LUBRICATION TYPE, 2022-2032 ($MILLION)
- TABLE 38. UK HYDROGEN COMPRESSOR MARKET, BY END USER INDUSTRY, 2022-2032 ($MILLION)
- TABLE 39. ITALY HYDROGEN COMPRESSOR MARKET, BY TECHNOLOGY TYPE, 2022-2032 ($MILLION)
- TABLE 40. ITALY HYDROGEN COMPRESSOR MARKET, BY LUBRICATION TYPE, 2022-2032 ($MILLION)
- TABLE 41. ITALY HYDROGEN COMPRESSOR MARKET, BY END USER INDUSTRY, 2022-2032 ($MILLION)
- TABLE 42. NETHERLANDS HYDROGEN COMPRESSOR MARKET, BY TECHNOLOGY TYPE, 2022-2032 ($MILLION)
- TABLE 43. NETHERLANDS HYDROGEN COMPRESSOR MARKET, BY LUBRICATION TYPE, 2022-2032 ($MILLION)
- TABLE 44. NETHERLANDS HYDROGEN COMPRESSOR MARKET, BY END USER INDUSTRY, 2022-2032 ($MILLION)
- TABLE 45. REST OF EUROPE HYDROGEN COMPRESSOR MARKET, BY TECHNOLOGY TYPE, 2022-2032 ($MILLION)
- TABLE 46. REST OF EUROPE HYDROGEN COMPRESSOR MARKET, BY LUBRICATION TYPE, 2022-2032 ($MILLION)
- TABLE 47. REST OF EUROPE HYDROGEN COMPRESSOR MARKET, BY END USER INDUSTRY, 2022-2032 ($MILLION)
- TABLE 48. ASIA-PACIFIC HYDROGEN COMPRESSOR MARKET, BY TECHNOLOGY TYPE, 2022-2032 ($MILLION)
- TABLE 49. ASIA-PACIFIC HYDROGEN COMPRESSOR MARKET, BY LUBRICATION TYPE, 2022-2032 ($MILLION)
- TABLE 50. ASIA-PACIFIC HYDROGEN COMPRESSOR MARKET, BY END USER INDUSTRY, 2022-2032 ($MILLION)
- TABLE 51. ASIA-PACIFIC HYDROGEN COMPRESSOR MARKET, BY COUNTRY, 2022-2032 ($MILLION)
- TABLE 52. CHINA HYDROGEN COMPRESSOR MARKET, BY TECHNOLOGY TYPE, 2022-2032 ($MILLION)
- TABLE 53. CHINA HYDROGEN COMPRESSOR MARKET, BY LUBRICATION TYPE, 2022-2032 ($MILLION)
- TABLE 54. CHINA HYDROGEN COMPRESSOR MARKET, BY END USER INDUSTRY, 2022-2032 ($MILLION)
- TABLE 55. INDIA HYDROGEN COMPRESSOR MARKET, BY TECHNOLOGY TYPE, 2022-2032 ($MILLION)
- TABLE 56. INDIA HYDROGEN COMPRESSOR MARKET, BY LUBRICATION TYPE, 2022-2032 ($MILLION)
- TABLE 57. INDIA HYDROGEN COMPRESSOR MARKET, BY END USER INDUSTRY, 2022-2032 ($MILLION)
- TABLE 58. JAPAN HYDROGEN COMPRESSOR MARKET, BY TECHNOLOGY TYPE, 2022-2032 ($MILLION)
- TABLE 59. JAPAN HYDROGEN COMPRESSOR MARKET, BY LUBRICATION TYPE, 2022-2032 ($MILLION)
- TABLE 60. JAPAN HYDROGEN COMPRESSOR MARKET, BY END USER INDUSTRY, 2022-2032 ($MILLION)
- TABLE 61. THAILAND HYDROGEN COMPRESSOR MARKET, BY TECHNOLOGY TYPE, 2022-2032 ($MILLION)
- TABLE 62. THAILAND HYDROGEN COMPRESSOR MARKET, BY LUBRICATION TYPE, 2022-2032 ($MILLION)
- TABLE 63. THAILAND HYDROGEN COMPRESSOR MARKET, BY END USER INDUSTRY, 2022-2032 ($MILLION)
- TABLE 64. REST OF ASIA-PACIFIC HYDROGEN COMPRESSOR MARKET, BY TECHNOLOGY TYPE, 2022-2032 ($MILLION)
- TABLE 65. REST OF ASIA-PACIFIC HYDROGEN COMPRESSOR MARKET, BY LUBRICATION TYPE, 2022-2032 ($MILLION)
- TABLE 66. REST OF ASIA-PACIFIC HYDROGEN COMPRESSOR MARKET, BY END USER INDUSTRY, 2022-2032 ($MILLION)
- TABLE 67. LAMEA HYDROGEN COMPRESSOR MARKET, BY TECHNOLOGY TYPE, 2022-2032 ($MILLION)
- TABLE 68. LAMEA HYDROGEN COMPRESSOR MARKET, BY LUBRICATION TYPE, 2022-2032 ($MILLION)
- TABLE 69. LAMEA HYDROGEN COMPRESSOR MARKET, BY END USER INDUSTRY, 2022-2032 ($MILLION)
- TABLE 70. LAMEA HYDROGEN COMPRESSOR MARKET, BY COUNTRY, 2022-2032 ($MILLION)
- TABLE 71. LATIN AMERICA HYDROGEN COMPRESSOR MARKET, BY TECHNOLOGY TYPE, 2022-2032 ($MILLION)
- TABLE 72. LATIN AMERICA HYDROGEN COMPRESSOR MARKET, BY LUBRICATION TYPE, 2022-2032 ($MILLION)
- TABLE 73. LATIN AMERICA HYDROGEN COMPRESSOR MARKET, BY END USER INDUSTRY, 2022-2032 ($MILLION)
- TABLE 74. MIDDLE EAST HYDROGEN COMPRESSOR MARKET, BY TECHNOLOGY TYPE, 2022-2032 ($MILLION)
- TABLE 75. MIDDLE EAST HYDROGEN COMPRESSOR MARKET, BY LUBRICATION TYPE, 2022-2032 ($MILLION)
- TABLE 76. MIDDLE EAST HYDROGEN COMPRESSOR MARKET, BY END USER INDUSTRY, 2022-2032 ($MILLION)
- TABLE 77. AFRICA HYDROGEN COMPRESSOR MARKET, BY TECHNOLOGY TYPE, 2022-2032 ($MILLION)
- TABLE 78. AFRICA HYDROGEN COMPRESSOR MARKET, BY LUBRICATION TYPE, 2022-2032 ($MILLION)
- TABLE 79. AFRICA HYDROGEN COMPRESSOR MARKET, BY END USER INDUSTRY, 2022-2032 ($MILLION)
- TABLE 80. IDEX CORPORATION: KEY EXECUTIVES
- TABLE 81. IDEX CORPORATION: COMPANY SNAPSHOT
- TABLE 82. IDEX CORPORATION: SERVICE SEGMENTS
- TABLE 83. IDEX CORPORATION: PRODUCT PORTFOLIO
- TABLE 84. ARIEL CORPORATION: KEY EXECUTIVES
- TABLE 85. ARIEL CORPORATION: COMPANY SNAPSHOT
- TABLE 86. ARIEL CORPORATION: PRODUCT SEGMENTS
- TABLE 87. ARIEL CORPORATION: PRODUCT PORTFOLIO
- TABLE 88. ARIEL CORPORATION: KEY STRATERGIES
- TABLE 89. ATLAS COPCO AB: KEY EXECUTIVES
- TABLE 90. ATLAS COPCO AB: COMPANY SNAPSHOT
- TABLE 91. ATLAS COPCO AB: PRODUCT SEGMENTS
- TABLE 92. ATLAS COPCO AB: PRODUCT PORTFOLIO
- TABLE 93. ATLAS COPCO AB: KEY STRATERGIES
- TABLE 94. FLUITRON INC.: KEY EXECUTIVES
- TABLE 95. FLUITRON INC.: COMPANY SNAPSHOT
- TABLE 96. FLUITRON INC.: PRODUCT SEGMENTS
- TABLE 97. FLUITRON INC.: PRODUCT PORTFOLIO
- TABLE 98. HAUG SAUER KOMPRESSOREN AG: KEY EXECUTIVES
- TABLE 99. HAUG SAUER KOMPRESSOREN AG: COMPANY SNAPSHOT
- TABLE 100. HAUG SAUER KOMPRESSOREN AG: PRODUCT SEGMENTS
- TABLE 101. HAUG SAUER KOMPRESSOREN AG: PRODUCT PORTFOLIO
- TABLE 102. NEL ASA: KEY EXECUTIVES
- TABLE 103. NEL ASA: COMPANY SNAPSHOT
- TABLE 104. NEL ASA: PRODUCT SEGMENTS
- TABLE 105. NEL ASA: PRODUCT PORTFOLIO
- TABLE 106. NEL ASA: KEY STRATERGIES
- TABLE 107. INGERSOLL RAND INC.: KEY EXECUTIVES
- TABLE 108. INGERSOLL RAND INC.: COMPANY SNAPSHOT
- TABLE 109. INGERSOLL RAND INC.: PRODUCT SEGMENTS
- TABLE 110. INGERSOLL RAND INC.: PRODUCT PORTFOLIO
- TABLE 111. INGERSOLL RAND INC.: KEY STRATERGIES
- TABLE 112. CHART INDUSTRIES, INC. (HOWDEN GROUP): KEY EXECUTIVES
- TABLE 113. CHART INDUSTRIES, INC. (HOWDEN GROUP): COMPANY SNAPSHOT
- TABLE 114. CHART INDUSTRIES, INC. (HOWDEN GROUP): PRODUCT SEGMENTS
- TABLE 115. CHART INDUSTRIES, INC. (HOWDEN GROUP): SERVICE SEGMENTS
- TABLE 116. CHART INDUSTRIES, INC. (HOWDEN GROUP): PRODUCT PORTFOLIO
- TABLE 117. BURCKHARDT COMPRESSION HOLDING AG: KEY EXECUTIVES
- TABLE 118. BURCKHARDT COMPRESSION HOLDING AG: COMPANY SNAPSHOT
- TABLE 119. BURCKHARDT COMPRESSION HOLDING AG: PRODUCT SEGMENTS
- TABLE 120. BURCKHARDT COMPRESSION HOLDING AG: SERVICE SEGMENTS
- TABLE 121. BURCKHARDT COMPRESSION HOLDING AG: PRODUCT PORTFOLIO
- TABLE 122. BURCKHARDT COMPRESSION HOLDING AG: KEY STRATERGIES
- TABLE 123. HITACHI LTD.: KEY EXECUTIVES
- TABLE 124. HITACHI LTD.: COMPANY SNAPSHOT
- TABLE 125. HITACHI LTD.: PRODUCT SEGMENTS
- TABLE 126. HITACHI LTD.: PRODUCT PORTFOLIO
LIST OF FIGURES
- FIGURE 01. HYDROGEN COMPRESSOR MARKET, 2022-2032
- FIGURE 02. SEGMENTATION OF HYDROGEN COMPRESSOR MARKET,2022-2032
- FIGURE 03. TOP IMPACTING FACTORS IN HYDROGEN COMPRESSOR MARKET (2022 TO 2032)
- FIGURE 04. TOP INVESTMENT POCKETS IN HYDROGEN COMPRESSOR MARKET (2023-2032)
- FIGURE 05. LOW BARGAINING POWER OF SUPPLIERS
- FIGURE 06. LOW THREAT OF NEW ENTRANTS
- FIGURE 07. LOW THREAT OF SUBSTITUTES
- FIGURE 08. LOW INTENSITY OF RIVALRY
- FIGURE 09. LOW BARGAINING POWER OF BUYERS
- FIGURE 10. GLOBAL HYDROGEN COMPRESSOR MARKET:DRIVERS, RESTRAINTS AND OPPORTUNITIES
- FIGURE 11. HYDROGEN COMPRESSOR MARKET, BY TECHNOLOGY TYPE, 2022 AND 2032(%)
- FIGURE 12. COMPARATIVE SHARE ANALYSIS OF HYDROGEN COMPRESSOR MARKET FOR MECHANICAL COMPRESSORS, BY COUNTRY 2022 AND 2032(%)
- FIGURE 13. COMPARATIVE SHARE ANALYSIS OF HYDROGEN COMPRESSOR MARKET FOR NON-MECHANICAL COMPRESSORS, BY COUNTRY 2022 AND 2032(%)
- FIGURE 14. HYDROGEN COMPRESSOR MARKET, BY LUBRICATION TYPE, 2022 AND 2032(%)
- FIGURE 15. COMPARATIVE SHARE ANALYSIS OF HYDROGEN COMPRESSOR MARKET FOR OIL-BASED, BY COUNTRY 2022 AND 2032(%)
- FIGURE 16. COMPARATIVE SHARE ANALYSIS OF HYDROGEN COMPRESSOR MARKET FOR OIL-FREE, BY COUNTRY 2022 AND 2032(%)
- FIGURE 17. HYDROGEN COMPRESSOR MARKET, BY END USER INDUSTRY, 2022 AND 2032(%)
- FIGURE 18. COMPARATIVE SHARE ANALYSIS OF HYDROGEN COMPRESSOR MARKET FOR OIL AND GAS, BY COUNTRY 2022 AND 2032(%)
- FIGURE 19. COMPARATIVE SHARE ANALYSIS OF HYDROGEN COMPRESSOR MARKET FOR CHEMICAL, BY COUNTRY 2022 AND 2032(%)
- FIGURE 20. COMPARATIVE SHARE ANALYSIS OF HYDROGEN COMPRESSOR MARKET FOR AUTOMOTIVE, BY COUNTRY 2022 AND 2032(%)
- FIGURE 21. COMPARATIVE SHARE ANALYSIS OF HYDROGEN COMPRESSOR MARKET FOR OTHERS, BY COUNTRY 2022 AND 2032(%)
- FIGURE 22. HYDROGEN COMPRESSOR MARKET BY REGION, 2022 AND 2032(%)
- FIGURE 23. U.S. HYDROGEN COMPRESSOR MARKET, 2022-2032 ($MILLION)
- FIGURE 24. CANADA HYDROGEN COMPRESSOR MARKET, 2022-2032 ($MILLION)
- FIGURE 25. MEXICO HYDROGEN COMPRESSOR MARKET, 2022-2032 ($MILLION)
- FIGURE 26. GERMANY HYDROGEN COMPRESSOR MARKET, 2022-2032 ($MILLION)
- FIGURE 27. FRANCE HYDROGEN COMPRESSOR MARKET, 2022-2032 ($MILLION)
- FIGURE 28. UK HYDROGEN COMPRESSOR MARKET, 2022-2032 ($MILLION)
- FIGURE 29. ITALY HYDROGEN COMPRESSOR MARKET, 2022-2032 ($MILLION)
- FIGURE 30. NETHERLANDS HYDROGEN COMPRESSOR MARKET, 2022-2032 ($MILLION)
- FIGURE 31. REST OF EUROPE HYDROGEN COMPRESSOR MARKET, 2022-2032 ($MILLION)
- FIGURE 32. CHINA HYDROGEN COMPRESSOR MARKET, 2022-2032 ($MILLION)
- FIGURE 33. INDIA HYDROGEN COMPRESSOR MARKET, 2022-2032 ($MILLION)
- FIGURE 34. JAPAN HYDROGEN COMPRESSOR MARKET, 2022-2032 ($MILLION)
- FIGURE 35. THAILAND HYDROGEN COMPRESSOR MARKET, 2022-2032 ($MILLION)
- FIGURE 36. REST OF ASIA-PACIFIC HYDROGEN COMPRESSOR MARKET, 2022-2032 ($MILLION)
- FIGURE 37. LATIN AMERICA HYDROGEN COMPRESSOR MARKET, 2022-2032 ($MILLION)
- FIGURE 38. MIDDLE EAST HYDROGEN COMPRESSOR MARKET, 2022-2032 ($MILLION)
- FIGURE 39. AFRICA HYDROGEN COMPRESSOR MARKET, 2022-2032 ($MILLION)
- FIGURE 40. TOP WINNING STRATEGIES, BY YEAR (2021-2023)
- FIGURE 41. TOP WINNING STRATEGIES, BY DEVELOPMENT (2021-2023)
- FIGURE 42. TOP WINNING STRATEGIES, BY COMPANY (2021-2023)
- FIGURE 43. PRODUCT MAPPING OF TOP 10 PLAYERS
- FIGURE 44. COMPETITIVE DASHBOARD
- FIGURE 45. COMPETITIVE HEATMAP: HYDROGEN COMPRESSOR MARKET
- FIGURE 46. TOP PLAYER POSITIONING, 2022
- FIGURE 47. IDEX CORPORATION: NET SALES, 2020-2022 ($MILLION)
- FIGURE 48. IDEX CORPORATION: RESEARCH & DEVELOPMENT EXPENDITURE, 2020-2022 ($MILLION)
- FIGURE 49. IDEX CORPORATION: REVENUE SHARE BY SEGMENT, 2022 (%)
- FIGURE 50. IDEX CORPORATION: REVENUE SHARE BY REGION, 2022 (%)
- FIGURE 51. ATLAS COPCO AB: NET REVENUE, 2020-2022 ($MILLION)
- FIGURE 52. ATLAS COPCO AB: RESEARCH & DEVELOPMENT EXPENDITURE, 2020-2022 ($MILLION)
- FIGURE 53. ATLAS COPCO AB: REVENUE SHARE BY SEGMENT, 2022 (%)
- FIGURE 54. ATLAS COPCO AB: REVENUE SHARE BY REGION, 2022 (%)
- FIGURE 55. NEL ASA: NET SALES, 2020-2022 ($MILLION)
- FIGURE 56. NEL ASA: RESEARCH & DEVELOPMENT EXPENDITURE, 2020-2022 ($MILLION)
- FIGURE 57. NEL ASA: REVENUE SHARE BY SEGMENT, 2022 (%)
- FIGURE 58. NEL ASA: REVENUE SHARE BY REGION, 2022 (%)
- FIGURE 59. INGERSOLL RAND INC.: NET SALES, 2020-2022 ($MILLION)
- FIGURE 60. INGERSOLL RAND INC.: RESEARCH & DEVELOPMENT EXPENDITURE, 2020-2022 ($MILLION)
- FIGURE 61. INGERSOLL RAND INC.: REVENUE SHARE BY SEGMENT, 2022 (%)
- FIGURE 62. INGERSOLL RAND INC.: REVENUE SHARE BY REGION, 2022 (%)
- FIGURE 63. CHART INDUSTRIES, INC. (HOWDEN GROUP): NET SALES, 2020-2022 ($MILLION)
- FIGURE 64. CHART INDUSTRIES, INC. (HOWDEN GROUP): RESEARCH & DEVELOPMENT EXPENDITURE, 2020-2022 ($MILLION)
- FIGURE 65. CHART INDUSTRIES, INC. (HOWDEN GROUP): REVENUE SHARE BY SEGMENT, 2022 (%)
- FIGURE 66. CHART INDUSTRIES, INC. (HOWDEN GROUP): REVENUE SHARE BY REGION, 2022 (%)
- FIGURE 67. BURCKHARDT COMPRESSION HOLDING AG: NET SALES, 2020-2022 ($MILLION)
- FIGURE 68. BURCKHARDT COMPRESSION HOLDING AG: RESEARCH & DEVELOPMENT EXPENDITURE, 2020-2022 ($MILLION)
- FIGURE 69. BURCKHARDT COMPRESSION HOLDING AG: REVENUE SHARE BY SEGMENT, 2022 (%)
- FIGURE 70. BURCKHARDT COMPRESSION HOLDING AG: REVENUE SHARE BY REGION, 2022 (%)
- FIGURE 71. HITACHI LTD.: NET REVENUE, 2021-2023 ($MILLION)
- FIGURE 72. HITACHI LTD.: REVENUE SHARE BY REGION, 2023 (%)
- FIGURE 73. HITACHI LTD.: REVENUE SHARE BY SEGMENT, 2023 (%)
 往復式氫氣壓縮機2024年全球市場報告
 全球氫氣壓縮機市場研究報告 - 2024 年至 2032 年產業分析、規模、佔有率、成長、趨勢與預測
 氫氣壓縮機:市場佔有率分析、產業趨勢、成長預測(2024-2029)
 全球氫氣壓縮機市場:按潤滑類型、類型、應用、設計、地區 - 預測(~2028 年)
 氫氣壓縮機市場規模和預測、全球和地區佔有率、趨勢以及按類型、階段、最終用戶和地理位置進行的成長機會分析
 全球氫氣壓縮機市場 - 2023-2030
 往復式氫氣壓縮機市場:按壓縮機類型、按潤滑類型、按最終用戶產業、按應用、按壓力、按產品速度:2023-2032 年全球機會分析和產業預測
 2028 年氫氣壓縮機市場預測——按潤滑類型、技術、氫氣壓力、最終用戶和地區進行的全球分析
 全球電化學氫壓縮機市場:市場規模、份額、趨勢分析、機遇和預測:按類型、技術、最終用戶和地區分類 (2023-2029)
 電化學氫壓縮機的全球市場:各類型,各用途,各技術,各規格,各地區的競爭,預測,機會(2027年)