


 |
市場調查報告書
商品編碼
1414940
涼茶市場:按類型、包裝、通路分類:2023-2032 年全球機會分析與產業預測Herbal Tea Market By Type, By Packaging, By Distribution Channel : Global Opportunity Analysis and Industry Forecast, 2023-2032 |
||||||
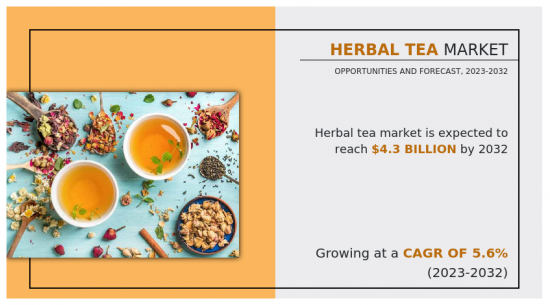
2022年涼茶市場價值為25億美元,預計2023年至2032年複合年成長率為5.6%,2032年達43億美元。
縱觀人類歷史,花草茶一直是常見的飲料選擇。最早提及花草茶的歷史可以追溯到公元前 2737 年的中國,其消費也早在公元 3 世紀就有文字記載。這種文化傳統超越了地理界限,花草茶從中國傳播到埃及、日本、歐洲和世界各地,凸顯了它們在健康益處方面持久而廣泛的重要性。
由於最近消費者轉向天然和有機茶飲料,花草茶市場正在經歷快速成長。從乾燥香草、鮮花、水果和香辛料中提取的花草茶為注重健康的消費者提供了一種天然植物來源飲料。不含人工香料和防腐劑吸引了偏好天然成分並尋求未加工飲料的消費者。許多花草茶均由流行品牌出售,例如:
- 許多花草茶都作為有機產品出售,包括 Yogi Tea、Celestial Seasonings、Traditional Medicinals、Ticino 和 Pakka Herbs 等流行品牌。這些茶的特點是使用的原料不使用合成農藥、除草劑或基因改造作物(GMO)。花草茶產品的有機認證有利於盡量減少接觸化學物質並優先考慮環境永續實踐的消費者。
此外,天然和有機趨勢與食品和飲料行業對透明度的要求密切相關。因此,注重原料、採購方式、製造方式可追溯的涼茶產品,可望贏得注重產品產地和製造流程的消費者的信任。此外,經過最少加工和透明標籤的花草茶符合潔淨標示運動,並吸引了優先考慮簡單和誠實產品配方的消費者。因此,在花草茶中使用各種草藥、花卉和水果,使越來越多的人在日常健康習慣中更喜歡這些天然飲料,極大地促進了市場的成長。
花草茶產業的另一個顯著趨勢是超越區域界限的全球化。國際品牌正在向新興市場擴張,推動該產業的成長。全球供應鏈涉及多個國家的原料採購、生產和包裝流程,促進了產品多樣性並吸引世界各地的消費者。不同國家和地區不同的法規環境對於涼茶市場至關重要。這些法規影響產品開拓和行銷,因為它們涉及產品安全、標籤規範和成分限制。客戶對成分揭露的要求不斷提高以及法規的收緊正在推動清潔、天然花草茶產品的出現。
由於數位革命,涼茶產業發生了向線上銷售管道和直接面對消費者(DTC)模式的重大轉變。 DTC 模式讓品牌能夠與消費者建立直接聯繫,而線上平台則提供便利、廣泛的產品和個人化的購物體驗。消費者參與和銷售主要由數位行銷驅動,包括影響者合作夥伴關係和線上試穿服務。使用環保包裝和採購道德原料變得越來越重要。消費者對有機和非作物產品的需求不斷增加,產品開發和測試的方式也在改變。
目錄
第1章簡介
第 2 章執行摘要
第3章市場概況
- 市場定義和範圍
- 主要發現
- 影響因素
- 主要投資機會
- 波特五力分析
- 市場動態
- 促進因素
- 更多地轉向天然和有機飲料
- 擴大零售市場
- 抑制因素
- 花草茶價格高
- 花草茶中某些草藥的副作用
- 機會
- 先進技術和封裝
- 介紹創新混合花草茶
- 促進因素
第4章涼茶市場:依類型
- 概述
- 洋甘菊
- 薄荷
- 芙蓉
- 檸檬草
- 薑
- 水果
- 混合
- 其他
第5章 涼茶市場:依包裝分類
- 概述
- 散裝茶葉
- 紙板
- 鋁罐
- 茶包
第6章 涼茶市場:依通路分類
- 概述
- 超級市場/大賣場
- 專賣店
- 便利商店
- 網路銷售管道
- 其他
第7章 涼茶市場:依地區分類
- 概述
- 北美洲
- 美國
- 加拿大
- 墨西哥
- 歐洲
- 德國
- 英國
- 法國
- 義大利
- 西班牙
- 其他
- 亞太地區
- 中國
- 日本
- 印度
- 韓國
- 澳洲
- 新加坡
- 其他
- 拉丁美洲/中東/非洲
- 巴西
- 南非
- 土耳其
- 沙烏地阿拉伯
- 埃及
- 其他
第8章 競爭形勢
- 介紹
- 關鍵成功策略
- 10家主要企業產品圖譜
- 競爭對手儀表板
- 競爭熱圖
- 2022年主要企業定位
第9章 公司簡介
- Tata Consumer Products Limited
- The Hain Celestial Group, Inc.
- Dilmah Ceylon Tea Company PLC
- Bigelow Tea
- Tielka Pty Ltd.
- Mountain Rose Herbs
- Terra Teas Organic
- Indigo Herbs Ltd.
- The Indian Chai
- Organic India Pvt. Ltd.
According to a new report published by Allied Market Research, titled, "Herbal Tea Market," The herbal tea market was valued at $2.5 billion in 2022, and is estimated to reach $4.3 billion by 2032, growing at a CAGR of 5.6% from 2023 to 2032.
Herbal teas have been a prevailing beverage choice throughout human history. The earliest known reference to herbal teas dates to 2737 BC in China, and written records from the third century AD further document their consumption. This cultural tradition has crossed geographical boundaries, with herbal teas making their journey from China to Egypt, Japan, Europe, and beyond, highlighting their enduring and widespread significance in health benefits.
The herbal tea market has experienced rapid growth owing to the shift of consumers towards natural and organic tea beverages in recent times. Herbal teas, derived from dried herbs, flowers, fruits, and spices, offer a natural, plant-based beverage for health-conscious consumers. The absence of artificial flavors and preservatives caters to the preference for natural ingredients, attracting individuals seeking unprocessed beverage options. Many herbal teas, including those from popular brands such as Yogi Tea, Celestial Seasonings, Traditional Medicinals, Teeccino, Pukka Herbs, among others, are available in organic varieties. These teas feature ingredients cultivated without synthetic pesticides, herbicides, or genetically modified organisms (GMOs). The organic certification of herbal tea products serves well to consumers prioritizing products with minimal exposure to chemicals and environmentally sustainable practices.
Moreover, the natural and organic trend is closely linked to a demand for transparency in the food and beverage industry. Thus, herbal tea products that emphasize the traceability of ingredients, sourcing practices, and production methods are expected to gain the trust of consumers who value knowing the origins and manufacturing processes of their products. In addition, herbal teas, with minimal processing and transparent labeling, align with the clean label movement, appealing to those consumers who prioritize straightforward and honest product formulations. As a result, the utilization of various herbs, flower, and fruits in herbal teas contributes significantly to the growth of market as more individuals prefer these natural beverages into their daily health routines.
Another noteworthy trend in the herbal tea industry is globalization, which crosses regional boundaries. International brands are expanding into emerging markets, which helps the sector grow. The global supply chain involves several nations in the procurement of ingredients, production, and packaging processes, promoting product variety and accessibility to consumers around the world. The regulatory environment, which varies by nation and region, is essential to the herbal tea market. These regulations affect product development and marketing as they address product safety, labeling specifications, and ingredient limitations. Increased customer demand for ingredient disclosure and stronger regulations are driving the emergence of clean and natural herbal tea products.
The herbal tea industry has experienced a significant move toward online sales channels and direct-to-consumer (DTC) models owing to the digital revolution. While DTC models enable brands to forge direct connections with consumers, online platforms provide convenience, a wide range of products, and personalized shopping experiences. Consumer engagement and sales are mostly driven by digital marketing, including influencer partnerships and online try-on services. Sustainability and ethical concerns, such as using eco-friendly packaging and sourcing ingredients ethically, have become more important. The increasing demand for organic and genetically modified organism (GMO) free products among consumers is changing how products are developed and tested.
The herbal tea market is analyzed on the basis of category, gender, distribution channel, and region. By type, the market is divided into chamomile, peppermint, hibiscus, lemongrass, ginger, fruits, blends, and others. By packaging, the market is segmented into loose tea, paperboards, aluminum tins, and tea bags. Depending on distribution channel, it is classified into supermarket-hypermarket, specialty stores, convenience stores, online sales channel, and others. Region-wise, the market is analyzed across North America (the U.S., Canada, and Mexico), Europe (Germany, the UK, France, Italy, Spain, and the rest of Europe), Asia-Pacific (China, Japan, India, South Korea, Australia, Singapore, and the rest of Asia-Pacific), and LAMEA (Brazil, South Africa, Turkey, Saudi Arabia, Egypt, and the rest of LAMEA).
The major players operating in the global herbal tea market are Tata Consumer Products Limited, The Hain Celestial Group, Inc., Dilmah Ceylon Tea Company PLC, Bigelow Tea, Tielka, Mountain Rose Herbs, Terra Teas Organic, Indigo Herbs Ltd, The Indian Chai, Organic India Pvt. Ltd.
Key Benefits For Stakeholders
- This report provides a quantitative analysis of the market segments, current trends, estimations, and dynamics of the herbal tea market analysis from 2022 to 2032 to identify the prevailing herbal tea market opportunities.
- The market research is offered along with information related to key drivers, restraints, and opportunities.
- Porter's five forces analysis highlights the potency of buyers and suppliers to enable stakeholders make profit-oriented business decisions and strengthen their supplier-buyer network.
- In-depth analysis of the herbal tea market segmentation assists to determine the prevailing market opportunities.
- Major countries in each region are mapped according to their revenue contribution to the global market.
- Market player positioning facilitates benchmarking and provides a clear understanding of the present position of the market players.
- The report includes the analysis of the regional as well as global herbal tea market trends, key players, market segments, application areas, and market growth strategies.
Additional benefits you will get with this purchase are:
- Quarterly Update and* (only available with a corporate license, on listed price)
- 5 additional Company Profile of client Choice pre- or Post-purchase, as a free update.
- Free Upcoming Version on the Purchase of Five and Enterprise User License.
- 16 analyst hours of support* (post-purchase, if you find additional data requirements upon review of the report, you may receive support amounting to 16 analyst hours to solve questions, and post-sale queries)
- 15% Free Customization* (in case the scope or segment of the report does not match your requirements, 15% is equivalent to 3 working days of free work, applicable once)
- Free data Pack on the Five and Enterprise User License. (Excel version of the report)
- Free Updated report if the report is 6-12 months old or older.
- 24-hour priority response*
- Free Industry updates and white papers.
Possible Customization with this report (with additional cost and timeline, please talk to the sales executive to know more)
- End user preferences and pain points
- Investment Opportunities
- Product Benchmarking / Product specification and applications
- Product Life Cycles
- Supply Chain Analysis & Vendor Margins
- Upcoming/New Entrant by Regions
- Technology Trend Analysis
- Average Consumer Expenditure
- Consumer Preference and Product Specifications
- Distributor margin Analysis
- New Product Development/ Product Matrix of Key Players
- Regulatory Guidelines
- Additional company profiles with specific to client's interest
- Additional country or region analysis- market size and forecast
- Expanded list for Company Profiles
- Historic market data
- Key player details (including location, contact details, supplier/vendor network etc. in excel format)
- List of customers/consumers/raw material suppliers- value chain analysis
- Market share analysis of players at global/region/country level
- SWOT Analysis
Key Market Segments
By Type
- Chamomile
- Peppermint
- Hibiscus
- Lemongrass
- Ginger
- Fruits
- Blends
- Others
By Packaging
- Loose Tea
- Paperboards
- Aluminum Tins
- Tea Bags
By Distribution Channel
- Supermarket-Hypermarket
- Specialty Stores
- Convenience Stores
- Online Sales Channel
- Others
By Region
- North America
- U.S.
- Canada
- Mexico
- Europe
- Germany
- UK
- France
- Italy
- Spain
- Rest of Europe
- Asia-Pacific
- China
- Japan
- India
- South Korea
- Australia
- Singapore
- Rest of Asia-Pacific
- LAMEA
- Brazil
- South Africa
- Turkey
- Saudi Arabia
- Egypt
- Rest of LAMEA
Key Market Players:
- Bigelow Tea
- Terra Teas Organic
- The Indian Chai
- Tata Consumer Products Limited
- Tielka Pty Ltd.
- Organic India Pvt. Ltd.
- The Hain Celestial Group, Inc.
- Dilmah Ceylon Tea Company PLC
- Mountain Rose Herbs
- Indigo Herbs Ltd.
TABLE OF CONTENTS
CHAPTER 1: INTRODUCTION
- 1.1. Report description
- 1.2. Key market segments
- 1.3. Key benefits to the stakeholders
- 1.4. Research methodology
- 1.4.1. Primary research
- 1.4.2. Secondary research
- 1.4.3. Analyst tools and models
CHAPTER 2: EXECUTIVE SUMMARY
- 2.1. CXO Perspective
CHAPTER 3: MARKET OVERVIEW
- 3.1. Market definition and scope
- 3.2. Key findings
- 3.2.1. Top impacting factors
- 3.2.2. Top investment pockets
- 3.3. Porter's five forces analysis
- 3.3.1. Moderate bargaining power of suppliers
- 3.3.2. Moderate threat of new entrants
- 3.3.3. Moderate threat of substitutes
- 3.3.4. Moderate intensity of rivalry
- 3.3.5. Moderate bargaining power of buyers
- 3.4. Market dynamics
- 3.4.1. Drivers
- 3.4.1.1. Increased shift toward natural and organic beverages
- 3.4.1.2. Expanding retail market
- 3.4.2. Restraints
- 3.4.2.1. High price of herbal tea
- 3.4.2.2. Side effects of certain herbs in herbal tea
- 3.4.3. Opportunities
- 3.4.3.1. Technological and packaging advancements
- 3.4.3.2. Introduction of innovative herbal tea blends
- 3.4.1. Drivers
CHAPTER 4: HERBAL TEA MARKET, BY TYPE
- 4.1. Overview
- 4.1.1. Market size and forecast
- 4.2. Chamomile
- 4.2.1. Key market trends, growth factors and opportunities
- 4.2.2. Market size and forecast, by region
- 4.2.3. Market share analysis by country
- 4.3. Peppermint
- 4.3.1. Key market trends, growth factors and opportunities
- 4.3.2. Market size and forecast, by region
- 4.3.3. Market share analysis by country
- 4.4. Hibiscus
- 4.4.1. Key market trends, growth factors and opportunities
- 4.4.2. Market size and forecast, by region
- 4.4.3. Market share analysis by country
- 4.5. Lemongrass
- 4.5.1. Key market trends, growth factors and opportunities
- 4.5.2. Market size and forecast, by region
- 4.5.3. Market share analysis by country
- 4.6. Ginger
- 4.6.1. Key market trends, growth factors and opportunities
- 4.6.2. Market size and forecast, by region
- 4.6.3. Market share analysis by country
- 4.7. Fruits
- 4.7.1. Key market trends, growth factors and opportunities
- 4.7.2. Market size and forecast, by region
- 4.7.3. Market share analysis by country
- 4.8. Blends
- 4.8.1. Key market trends, growth factors and opportunities
- 4.8.2. Market size and forecast, by region
- 4.8.3. Market share analysis by country
- 4.9. Others
- 4.9.1. Key market trends, growth factors and opportunities
- 4.9.2. Market size and forecast, by region
- 4.9.3. Market share analysis by country
CHAPTER 5: HERBAL TEA MARKET, BY PACKAGING
- 5.1. Overview
- 5.1.1. Market size and forecast
- 5.2. Loose Tea
- 5.2.1. Key market trends, growth factors and opportunities
- 5.2.2. Market size and forecast, by region
- 5.2.3. Market share analysis by country
- 5.3. Paperboards
- 5.3.1. Key market trends, growth factors and opportunities
- 5.3.2. Market size and forecast, by region
- 5.3.3. Market share analysis by country
- 5.4. Aluminum Tins
- 5.4.1. Key market trends, growth factors and opportunities
- 5.4.2. Market size and forecast, by region
- 5.4.3. Market share analysis by country
- 5.5. Tea Bags
- 5.5.1. Key market trends, growth factors and opportunities
- 5.5.2. Market size and forecast, by region
- 5.5.3. Market share analysis by country
CHAPTER 6: HERBAL TEA MARKET, BY DISTRIBUTION CHANNEL
- 6.1. Overview
- 6.1.1. Market size and forecast
- 6.2. Supermarket-Hypermarket
- 6.2.1. Key market trends, growth factors and opportunities
- 6.2.2. Market size and forecast, by region
- 6.2.3. Market share analysis by country
- 6.3. Specialty Stores
- 6.3.1. Key market trends, growth factors and opportunities
- 6.3.2. Market size and forecast, by region
- 6.3.3. Market share analysis by country
- 6.4. Convenience Stores
- 6.4.1. Key market trends, growth factors and opportunities
- 6.4.2. Market size and forecast, by region
- 6.4.3. Market share analysis by country
- 6.5. Online Sales Channel
- 6.5.1. Key market trends, growth factors and opportunities
- 6.5.2. Market size and forecast, by region
- 6.5.3. Market share analysis by country
- 6.6. Others
- 6.6.1. Key market trends, growth factors and opportunities
- 6.6.2. Market size and forecast, by region
- 6.6.3. Market share analysis by country
CHAPTER 7: HERBAL TEA MARKET, BY REGION
- 7.1. Overview
- 7.1.1. Market size and forecast By Region
- 7.2. North America
- 7.2.1. Key market trends, growth factors and opportunities
- 7.2.2. Market size and forecast, by Type
- 7.2.3. Market size and forecast, by Packaging
- 7.2.4. Market size and forecast, by Distribution Channel
- 7.2.5. Market size and forecast, by country
- 7.2.5.1. U.S.
- 7.2.5.1.1. Market size and forecast, by Type
- 7.2.5.1.2. Market size and forecast, by Packaging
- 7.2.5.1.3. Market size and forecast, by Distribution Channel
- 7.2.5.2. Canada
- 7.2.5.2.1. Market size and forecast, by Type
- 7.2.5.2.2. Market size and forecast, by Packaging
- 7.2.5.2.3. Market size and forecast, by Distribution Channel
- 7.2.5.3. Mexico
- 7.2.5.3.1. Market size and forecast, by Type
- 7.2.5.3.2. Market size and forecast, by Packaging
- 7.2.5.3.3. Market size and forecast, by Distribution Channel
- 7.3. Europe
- 7.3.1. Key market trends, growth factors and opportunities
- 7.3.2. Market size and forecast, by Type
- 7.3.3. Market size and forecast, by Packaging
- 7.3.4. Market size and forecast, by Distribution Channel
- 7.3.5. Market size and forecast, by country
- 7.3.5.1. Germany
- 7.3.5.1.1. Market size and forecast, by Type
- 7.3.5.1.2. Market size and forecast, by Packaging
- 7.3.5.1.3. Market size and forecast, by Distribution Channel
- 7.3.5.2. UK
- 7.3.5.2.1. Market size and forecast, by Type
- 7.3.5.2.2. Market size and forecast, by Packaging
- 7.3.5.2.3. Market size and forecast, by Distribution Channel
- 7.3.5.3. France
- 7.3.5.3.1. Market size and forecast, by Type
- 7.3.5.3.2. Market size and forecast, by Packaging
- 7.3.5.3.3. Market size and forecast, by Distribution Channel
- 7.3.5.4. Italy
- 7.3.5.4.1. Market size and forecast, by Type
- 7.3.5.4.2. Market size and forecast, by Packaging
- 7.3.5.4.3. Market size and forecast, by Distribution Channel
- 7.3.5.5. Spain
- 7.3.5.5.1. Market size and forecast, by Type
- 7.3.5.5.2. Market size and forecast, by Packaging
- 7.3.5.5.3. Market size and forecast, by Distribution Channel
- 7.3.5.6. Rest of Europe
- 7.3.5.6.1. Market size and forecast, by Type
- 7.3.5.6.2. Market size and forecast, by Packaging
- 7.3.5.6.3. Market size and forecast, by Distribution Channel
- 7.4. Asia-Pacific
- 7.4.1. Key market trends, growth factors and opportunities
- 7.4.2. Market size and forecast, by Type
- 7.4.3. Market size and forecast, by Packaging
- 7.4.4. Market size and forecast, by Distribution Channel
- 7.4.5. Market size and forecast, by country
- 7.4.5.1. China
- 7.4.5.1.1. Market size and forecast, by Type
- 7.4.5.1.2. Market size and forecast, by Packaging
- 7.4.5.1.3. Market size and forecast, by Distribution Channel
- 7.4.5.2. Japan
- 7.4.5.2.1. Market size and forecast, by Type
- 7.4.5.2.2. Market size and forecast, by Packaging
- 7.4.5.2.3. Market size and forecast, by Distribution Channel
- 7.4.5.3. India
- 7.4.5.3.1. Market size and forecast, by Type
- 7.4.5.3.2. Market size and forecast, by Packaging
- 7.4.5.3.3. Market size and forecast, by Distribution Channel
- 7.4.5.4. South Korea
- 7.4.5.4.1. Market size and forecast, by Type
- 7.4.5.4.2. Market size and forecast, by Packaging
- 7.4.5.4.3. Market size and forecast, by Distribution Channel
- 7.4.5.5. Australia
- 7.4.5.5.1. Market size and forecast, by Type
- 7.4.5.5.2. Market size and forecast, by Packaging
- 7.4.5.5.3. Market size and forecast, by Distribution Channel
- 7.4.5.6. Singapore
- 7.4.5.6.1. Market size and forecast, by Type
- 7.4.5.6.2. Market size and forecast, by Packaging
- 7.4.5.6.3. Market size and forecast, by Distribution Channel
- 7.4.5.7. Rest of Asia-Pacific
- 7.4.5.7.1. Market size and forecast, by Type
- 7.4.5.7.2. Market size and forecast, by Packaging
- 7.4.5.7.3. Market size and forecast, by Distribution Channel
- 7.5. LAMEA
- 7.5.1. Key market trends, growth factors and opportunities
- 7.5.2. Market size and forecast, by Type
- 7.5.3. Market size and forecast, by Packaging
- 7.5.4. Market size and forecast, by Distribution Channel
- 7.5.5. Market size and forecast, by country
- 7.5.5.1. Brazil
- 7.5.5.1.1. Market size and forecast, by Type
- 7.5.5.1.2. Market size and forecast, by Packaging
- 7.5.5.1.3. Market size and forecast, by Distribution Channel
- 7.5.5.2. South Africa
- 7.5.5.2.1. Market size and forecast, by Type
- 7.5.5.2.2. Market size and forecast, by Packaging
- 7.5.5.2.3. Market size and forecast, by Distribution Channel
- 7.5.5.3. Turkey
- 7.5.5.3.1. Market size and forecast, by Type
- 7.5.5.3.2. Market size and forecast, by Packaging
- 7.5.5.3.3. Market size and forecast, by Distribution Channel
- 7.5.5.4. Saudi Arabia
- 7.5.5.4.1. Market size and forecast, by Type
- 7.5.5.4.2. Market size and forecast, by Packaging
- 7.5.5.4.3. Market size and forecast, by Distribution Channel
- 7.5.5.5. Egypt
- 7.5.5.5.1. Market size and forecast, by Type
- 7.5.5.5.2. Market size and forecast, by Packaging
- 7.5.5.5.3. Market size and forecast, by Distribution Channel
- 7.5.5.6. Rest of LAMEA
- 7.5.5.6.1. Market size and forecast, by Type
- 7.5.5.6.2. Market size and forecast, by Packaging
- 7.5.5.6.3. Market size and forecast, by Distribution Channel
CHAPTER 8: COMPETITIVE LANDSCAPE
- 8.1. Introduction
- 8.2. Top winning strategies
- 8.3. Product mapping of top 10 player
- 8.4. Competitive dashboard
- 8.5. Competitive heatmap
- 8.6. Top player positioning, 2022
CHAPTER 9: COMPANY PROFILES
- 9.1. Tata Consumer Products Limited
- 9.1.1. Company overview
- 9.1.2. Key executives
- 9.1.3. Company snapshot
- 9.1.4. Operating business segments
- 9.1.5. Product portfolio
- 9.1.6. Business performance
- 9.1.7. Key strategic moves and developments
- 9.2. The Hain Celestial Group, Inc.
- 9.2.1. Company overview
- 9.2.2. Key executives
- 9.2.3. Company snapshot
- 9.2.4. Operating business segments
- 9.2.5. Product portfolio
- 9.2.6. Business performance
- 9.3. Dilmah Ceylon Tea Company PLC
- 9.3.1. Company overview
- 9.3.2. Key executives
- 9.3.3. Company snapshot
- 9.3.4. Operating business segments
- 9.3.5. Product portfolio
- 9.4. Bigelow Tea
- 9.4.1. Company overview
- 9.4.2. Key executives
- 9.4.3. Company snapshot
- 9.4.4. Operating business segments
- 9.4.5. Product portfolio
- 9.4.6. Key strategic moves and developments
- 9.5. Tielka Pty Ltd.
- 9.5.1. Company overview
- 9.5.2. Key executives
- 9.5.3. Company snapshot
- 9.5.4. Operating business segments
- 9.5.5. Product portfolio
- 9.6. Mountain Rose Herbs
- 9.6.1. Company overview
- 9.6.2. Key executives
- 9.6.3. Company snapshot
- 9.6.4. Operating business segments
- 9.6.5. Product portfolio
- 9.7. Terra Teas Organic
- 9.7.1. Company overview
- 9.7.2. Key executives
- 9.7.3. Company snapshot
- 9.7.4. Operating business segments
- 9.7.5. Product portfolio
- 9.8. Indigo Herbs Ltd.
- 9.8.1. Company overview
- 9.8.2. Key executives
- 9.8.3. Company snapshot
- 9.8.4. Operating business segments
- 9.8.5. Product portfolio
- 9.9. The Indian Chai
- 9.9.1. Company overview
- 9.9.2. Key executives
- 9.9.3. Company snapshot
- 9.9.4. Operating business segments
- 9.9.5. Product portfolio
- 9.10. Organic India Pvt. Ltd.
- 9.10.1. Company overview
- 9.10.2. Key executives
- 9.10.3. Company snapshot
- 9.10.4. Operating business segments
- 9.10.5. Product portfolio
- 9.10.6. Business performance
LIST OF TABLES
- TABLE 01. GLOBAL HERBAL TEA MARKET, BY TYPE, 2022-2032 ($MILLION)
- TABLE 02. HERBAL TEA MARKET FOR CHAMOMILE, BY REGION, 2022-2032 ($MILLION)
- TABLE 03. HERBAL TEA MARKET FOR PEPPERMINT, BY REGION, 2022-2032 ($MILLION)
- TABLE 04. HERBAL TEA MARKET FOR HIBISCUS, BY REGION, 2022-2032 ($MILLION)
- TABLE 05. HERBAL TEA MARKET FOR LEMONGRASS, BY REGION, 2022-2032 ($MILLION)
- TABLE 06. HERBAL TEA MARKET FOR GINGER, BY REGION, 2022-2032 ($MILLION)
- TABLE 07. HERBAL TEA MARKET FOR FRUITS, BY REGION, 2022-2032 ($MILLION)
- TABLE 08. HERBAL TEA MARKET FOR BLENDS, BY REGION, 2022-2032 ($MILLION)
- TABLE 09. HERBAL TEA MARKET FOR OTHERS, BY REGION, 2022-2032 ($MILLION)
- TABLE 10. GLOBAL HERBAL TEA MARKET, BY PACKAGING, 2022-2032 ($MILLION)
- TABLE 11. HERBAL TEA MARKET FOR LOOSE TEA, BY REGION, 2022-2032 ($MILLION)
- TABLE 12. HERBAL TEA MARKET FOR PAPERBOARDS, BY REGION, 2022-2032 ($MILLION)
- TABLE 13. HERBAL TEA MARKET FOR ALUMINUM TINS, BY REGION, 2022-2032 ($MILLION)
- TABLE 14. HERBAL TEA MARKET FOR TEA BAGS, BY REGION, 2022-2032 ($MILLION)
- TABLE 15. GLOBAL HERBAL TEA MARKET, BY DISTRIBUTION CHANNEL, 2022-2032 ($MILLION)
- TABLE 16. HERBAL TEA MARKET FOR SUPERMARKET-HYPERMARKET, BY REGION, 2022-2032 ($MILLION)
- TABLE 17. HERBAL TEA MARKET FOR SPECIALTY STORES, BY REGION, 2022-2032 ($MILLION)
- TABLE 18. HERBAL TEA MARKET FOR CONVENIENCE STORES, BY REGION, 2022-2032 ($MILLION)
- TABLE 19. HERBAL TEA MARKET FOR ONLINE SALES CHANNEL, BY REGION, 2022-2032 ($MILLION)
- TABLE 20. HERBAL TEA MARKET FOR OTHERS, BY REGION, 2022-2032 ($MILLION)
- TABLE 21. HERBAL TEA MARKET, BY REGION, 2022-2032 ($MILLION)
- TABLE 22. NORTH AMERICA HERBAL TEA MARKET, BY TYPE, 2022-2032 ($MILLION)
- TABLE 23. NORTH AMERICA HERBAL TEA MARKET, BY PACKAGING, 2022-2032 ($MILLION)
- TABLE 24. NORTH AMERICA HERBAL TEA MARKET, BY DISTRIBUTION CHANNEL, 2022-2032 ($MILLION)
- TABLE 25. NORTH AMERICA HERBAL TEA MARKET, BY COUNTRY, 2022-2032 ($MILLION)
- TABLE 26. U.S. HERBAL TEA MARKET, BY TYPE, 2022-2032 ($MILLION)
- TABLE 27. U.S. HERBAL TEA MARKET, BY PACKAGING, 2022-2032 ($MILLION)
- TABLE 28. U.S. HERBAL TEA MARKET, BY DISTRIBUTION CHANNEL, 2022-2032 ($MILLION)
- TABLE 29. CANADA HERBAL TEA MARKET, BY TYPE, 2022-2032 ($MILLION)
- TABLE 30. CANADA HERBAL TEA MARKET, BY PACKAGING, 2022-2032 ($MILLION)
- TABLE 31. CANADA HERBAL TEA MARKET, BY DISTRIBUTION CHANNEL, 2022-2032 ($MILLION)
- TABLE 32. MEXICO HERBAL TEA MARKET, BY TYPE, 2022-2032 ($MILLION)
- TABLE 33. MEXICO HERBAL TEA MARKET, BY PACKAGING, 2022-2032 ($MILLION)
- TABLE 34. MEXICO HERBAL TEA MARKET, BY DISTRIBUTION CHANNEL, 2022-2032 ($MILLION)
- TABLE 35. EUROPE HERBAL TEA MARKET, BY TYPE, 2022-2032 ($MILLION)
- TABLE 36. EUROPE HERBAL TEA MARKET, BY PACKAGING, 2022-2032 ($MILLION)
- TABLE 37. EUROPE HERBAL TEA MARKET, BY DISTRIBUTION CHANNEL, 2022-2032 ($MILLION)
- TABLE 38. EUROPE HERBAL TEA MARKET, BY COUNTRY, 2022-2032 ($MILLION)
- TABLE 39. GERMANY HERBAL TEA MARKET, BY TYPE, 2022-2032 ($MILLION)
- TABLE 40. GERMANY HERBAL TEA MARKET, BY PACKAGING, 2022-2032 ($MILLION)
- TABLE 41. GERMANY HERBAL TEA MARKET, BY DISTRIBUTION CHANNEL, 2022-2032 ($MILLION)
- TABLE 42. UK HERBAL TEA MARKET, BY TYPE, 2022-2032 ($MILLION)
- TABLE 43. UK HERBAL TEA MARKET, BY PACKAGING, 2022-2032 ($MILLION)
- TABLE 44. UK HERBAL TEA MARKET, BY DISTRIBUTION CHANNEL, 2022-2032 ($MILLION)
- TABLE 45. FRANCE HERBAL TEA MARKET, BY TYPE, 2022-2032 ($MILLION)
- TABLE 46. FRANCE HERBAL TEA MARKET, BY PACKAGING, 2022-2032 ($MILLION)
- TABLE 47. FRANCE HERBAL TEA MARKET, BY DISTRIBUTION CHANNEL, 2022-2032 ($MILLION)
- TABLE 48. ITALY HERBAL TEA MARKET, BY TYPE, 2022-2032 ($MILLION)
- TABLE 49. ITALY HERBAL TEA MARKET, BY PACKAGING, 2022-2032 ($MILLION)
- TABLE 50. ITALY HERBAL TEA MARKET, BY DISTRIBUTION CHANNEL, 2022-2032 ($MILLION)
- TABLE 51. SPAIN HERBAL TEA MARKET, BY TYPE, 2022-2032 ($MILLION)
- TABLE 52. SPAIN HERBAL TEA MARKET, BY PACKAGING, 2022-2032 ($MILLION)
- TABLE 53. SPAIN HERBAL TEA MARKET, BY DISTRIBUTION CHANNEL, 2022-2032 ($MILLION)
- TABLE 54. REST OF EUROPE HERBAL TEA MARKET, BY TYPE, 2022-2032 ($MILLION)
- TABLE 55. REST OF EUROPE HERBAL TEA MARKET, BY PACKAGING, 2022-2032 ($MILLION)
- TABLE 56. REST OF EUROPE HERBAL TEA MARKET, BY DISTRIBUTION CHANNEL, 2022-2032 ($MILLION)
- TABLE 57. ASIA-PACIFIC HERBAL TEA MARKET, BY TYPE, 2022-2032 ($MILLION)
- TABLE 58. ASIA-PACIFIC HERBAL TEA MARKET, BY PACKAGING, 2022-2032 ($MILLION)
- TABLE 59. ASIA-PACIFIC HERBAL TEA MARKET, BY DISTRIBUTION CHANNEL, 2022-2032 ($MILLION)
- TABLE 60. ASIA-PACIFIC HERBAL TEA MARKET, BY COUNTRY, 2022-2032 ($MILLION)
- TABLE 61. CHINA HERBAL TEA MARKET, BY TYPE, 2022-2032 ($MILLION)
- TABLE 62. CHINA HERBAL TEA MARKET, BY PACKAGING, 2022-2032 ($MILLION)
- TABLE 63. CHINA HERBAL TEA MARKET, BY DISTRIBUTION CHANNEL, 2022-2032 ($MILLION)
- TABLE 64. JAPAN HERBAL TEA MARKET, BY TYPE, 2022-2032 ($MILLION)
- TABLE 65. JAPAN HERBAL TEA MARKET, BY PACKAGING, 2022-2032 ($MILLION)
- TABLE 66. JAPAN HERBAL TEA MARKET, BY DISTRIBUTION CHANNEL, 2022-2032 ($MILLION)
- TABLE 67. INDIA HERBAL TEA MARKET, BY TYPE, 2022-2032 ($MILLION)
- TABLE 68. INDIA HERBAL TEA MARKET, BY PACKAGING, 2022-2032 ($MILLION)
- TABLE 69. INDIA HERBAL TEA MARKET, BY DISTRIBUTION CHANNEL, 2022-2032 ($MILLION)
- TABLE 70. SOUTH KOREA HERBAL TEA MARKET, BY TYPE, 2022-2032 ($MILLION)
- TABLE 71. SOUTH KOREA HERBAL TEA MARKET, BY PACKAGING, 2022-2032 ($MILLION)
- TABLE 72. SOUTH KOREA HERBAL TEA MARKET, BY DISTRIBUTION CHANNEL, 2022-2032 ($MILLION)
- TABLE 73. AUSTRALIA HERBAL TEA MARKET, BY TYPE, 2022-2032 ($MILLION)
- TABLE 74. AUSTRALIA HERBAL TEA MARKET, BY PACKAGING, 2022-2032 ($MILLION)
- TABLE 75. AUSTRALIA HERBAL TEA MARKET, BY DISTRIBUTION CHANNEL, 2022-2032 ($MILLION)
- TABLE 76. SINGAPORE HERBAL TEA MARKET, BY TYPE, 2022-2032 ($MILLION)
- TABLE 77. SINGAPORE HERBAL TEA MARKET, BY PACKAGING, 2022-2032 ($MILLION)
- TABLE 78. SINGAPORE HERBAL TEA MARKET, BY DISTRIBUTION CHANNEL, 2022-2032 ($MILLION)
- TABLE 79. REST OF ASIA-PACIFIC HERBAL TEA MARKET, BY TYPE, 2022-2032 ($MILLION)
- TABLE 80. REST OF ASIA-PACIFIC HERBAL TEA MARKET, BY PACKAGING, 2022-2032 ($MILLION)
- TABLE 81. REST OF ASIA-PACIFIC HERBAL TEA MARKET, BY DISTRIBUTION CHANNEL, 2022-2032 ($MILLION)
- TABLE 82. LAMEA HERBAL TEA MARKET, BY TYPE, 2022-2032 ($MILLION)
- TABLE 83. LAMEA HERBAL TEA MARKET, BY PACKAGING, 2022-2032 ($MILLION)
- TABLE 84. LAMEA HERBAL TEA MARKET, BY DISTRIBUTION CHANNEL, 2022-2032 ($MILLION)
- TABLE 85. LAMEA HERBAL TEA MARKET, BY COUNTRY, 2022-2032 ($MILLION)
- TABLE 86. BRAZIL HERBAL TEA MARKET, BY TYPE, 2022-2032 ($MILLION)
- TABLE 87. BRAZIL HERBAL TEA MARKET, BY PACKAGING, 2022-2032 ($MILLION)
- TABLE 88. BRAZIL HERBAL TEA MARKET, BY DISTRIBUTION CHANNEL, 2022-2032 ($MILLION)
- TABLE 89. SOUTH AFRICA HERBAL TEA MARKET, BY TYPE, 2022-2032 ($MILLION)
- TABLE 90. SOUTH AFRICA HERBAL TEA MARKET, BY PACKAGING, 2022-2032 ($MILLION)
- TABLE 91. SOUTH AFRICA HERBAL TEA MARKET, BY DISTRIBUTION CHANNEL, 2022-2032 ($MILLION)
- TABLE 92. TURKEY HERBAL TEA MARKET, BY TYPE, 2022-2032 ($MILLION)
- TABLE 93. TURKEY HERBAL TEA MARKET, BY PACKAGING, 2022-2032 ($MILLION)
- TABLE 94. TURKEY HERBAL TEA MARKET, BY DISTRIBUTION CHANNEL, 2022-2032 ($MILLION)
- TABLE 95. SAUDI ARABIA HERBAL TEA MARKET, BY TYPE, 2022-2032 ($MILLION)
- TABLE 96. SAUDI ARABIA HERBAL TEA MARKET, BY PACKAGING, 2022-2032 ($MILLION)
- TABLE 97. SAUDI ARABIA HERBAL TEA MARKET, BY DISTRIBUTION CHANNEL, 2022-2032 ($MILLION)
- TABLE 98. EGYPT HERBAL TEA MARKET, BY TYPE, 2022-2032 ($MILLION)
- TABLE 99. EGYPT HERBAL TEA MARKET, BY PACKAGING, 2022-2032 ($MILLION)
- TABLE 100. EGYPT HERBAL TEA MARKET, BY DISTRIBUTION CHANNEL, 2022-2032 ($MILLION)
- TABLE 101. REST OF LAMEA HERBAL TEA MARKET, BY TYPE, 2022-2032 ($MILLION)
- TABLE 102. REST OF LAMEA HERBAL TEA MARKET, BY PACKAGING, 2022-2032 ($MILLION)
- TABLE 103. REST OF LAMEA HERBAL TEA MARKET, BY DISTRIBUTION CHANNEL, 2022-2032 ($MILLION)
- TABLE 104. TATA CONSUMER PRODUCTS LIMITED: KEY EXECUTIVES
- TABLE 105. TATA CONSUMER PRODUCTS LIMITED: COMPANY SNAPSHOT
- TABLE 106. TATA CONSUMER PRODUCTS LIMITED: PRODUCT SEGMENTS
- TABLE 107. TATA CONSUMER PRODUCTS LIMITED: PRODUCT PORTFOLIO
- TABLE 108. TATA CONSUMER PRODUCTS LIMITED: KEY STRATERGIES
- TABLE 109. THE HAIN CELESTIAL GROUP, INC.: KEY EXECUTIVES
- TABLE 110. THE HAIN CELESTIAL GROUP, INC.: COMPANY SNAPSHOT
- TABLE 111. THE HAIN CELESTIAL GROUP, INC.: PRODUCT SEGMENTS
- TABLE 112. THE HAIN CELESTIAL GROUP, INC.: PRODUCT PORTFOLIO
- TABLE 113. DILMAH CEYLON TEA COMPANY PLC: KEY EXECUTIVES
- TABLE 114. DILMAH CEYLON TEA COMPANY PLC: COMPANY SNAPSHOT
- TABLE 115. DILMAH CEYLON TEA COMPANY PLC: PRODUCT SEGMENTS
- TABLE 116. DILMAH CEYLON TEA COMPANY PLC: PRODUCT PORTFOLIO
- TABLE 117. BIGELOW TEA: KEY EXECUTIVES
- TABLE 118. BIGELOW TEA: COMPANY SNAPSHOT
- TABLE 119. BIGELOW TEA: PRODUCT SEGMENTS
- TABLE 120. BIGELOW TEA: PRODUCT PORTFOLIO
- TABLE 121. BIGELOW TEA: KEY STRATERGIES
- TABLE 122. TIELKA PTY LTD.: KEY EXECUTIVES
- TABLE 123. TIELKA PTY LTD.: COMPANY SNAPSHOT
- TABLE 124. TIELKA PTY LTD.: PRODUCT SEGMENTS
- TABLE 125. TIELKA PTY LTD.: PRODUCT PORTFOLIO
- TABLE 126. MOUNTAIN ROSE HERBS: KEY EXECUTIVES
- TABLE 127. MOUNTAIN ROSE HERBS: COMPANY SNAPSHOT
- TABLE 128. MOUNTAIN ROSE HERBS: PRODUCT SEGMENTS
- TABLE 129. MOUNTAIN ROSE HERBS: PRODUCT PORTFOLIO
- TABLE 130. TERRA TEAS ORGANIC: KEY EXECUTIVES
- TABLE 131. TERRA TEAS ORGANIC: COMPANY SNAPSHOT
- TABLE 132. TERRA TEAS ORGANIC: PRODUCT SEGMENTS
- TABLE 133. TERRA TEAS ORGANIC: PRODUCT PORTFOLIO
- TABLE 134. INDIGO HERBS LTD.: KEY EXECUTIVES
- TABLE 135. INDIGO HERBS LTD.: COMPANY SNAPSHOT
- TABLE 136. INDIGO HERBS LTD.: PRODUCT SEGMENTS
- TABLE 137. INDIGO HERBS LTD.: PRODUCT PORTFOLIO
- TABLE 138. THE INDIAN CHAI: KEY EXECUTIVES
- TABLE 139. THE INDIAN CHAI: COMPANY SNAPSHOT
- TABLE 140. THE INDIAN CHAI: PRODUCT SEGMENTS
- TABLE 141. THE INDIAN CHAI: PRODUCT PORTFOLIO
- TABLE 142. ORGANIC INDIA PVT. LTD.: KEY EXECUTIVES
- TABLE 143. ORGANIC INDIA PVT. LTD.: COMPANY SNAPSHOT
- TABLE 144. ORGANIC INDIA PVT. LTD.: PRODUCT SEGMENTS
- TABLE 145. ORGANIC INDIA PVT. LTD.: PRODUCT PORTFOLIO
LIST OF FIGURES
- FIGURE 01. HERBAL TEA MARKET, 2022-2032
- FIGURE 02. SEGMENTATION OF HERBAL TEA MARKET,2022-2032
- FIGURE 03. TOP IMPACTING FACTORS IN HERBAL TEA MARKET (2022 TO 2032)
- FIGURE 04. TOP INVESTMENT POCKETS IN HERBAL TEA MARKET (2023-2032)
- FIGURE 05. MODERATE BARGAINING POWER OF SUPPLIERS
- FIGURE 06. MODERATE THREAT OF NEW ENTRANTS
- FIGURE 07. MODERATE THREAT OF SUBSTITUTES
- FIGURE 08. MODERATE INTENSITY OF RIVALRY
- FIGURE 09. MODERATE BARGAINING POWER OF BUYERS
- FIGURE 10. GLOBAL HERBAL TEA MARKET:DRIVERS, RESTRAINTS AND OPPORTUNITIES
- FIGURE 11. HERBAL TEA MARKET, BY TYPE, 2022 AND 2032(%)
- FIGURE 12. COMPARATIVE SHARE ANALYSIS OF HERBAL TEA MARKET FOR CHAMOMILE, BY COUNTRY 2022 AND 2032(%)
- FIGURE 13. COMPARATIVE SHARE ANALYSIS OF HERBAL TEA MARKET FOR PEPPERMINT, BY COUNTRY 2022 AND 2032(%)
- FIGURE 14. COMPARATIVE SHARE ANALYSIS OF HERBAL TEA MARKET FOR HIBISCUS, BY COUNTRY 2022 AND 2032(%)
- FIGURE 15. COMPARATIVE SHARE ANALYSIS OF HERBAL TEA MARKET FOR LEMONGRASS, BY COUNTRY 2022 AND 2032(%)
- FIGURE 16. COMPARATIVE SHARE ANALYSIS OF HERBAL TEA MARKET FOR GINGER, BY COUNTRY 2022 AND 2032(%)
- FIGURE 17. COMPARATIVE SHARE ANALYSIS OF HERBAL TEA MARKET FOR FRUITS, BY COUNTRY 2022 AND 2032(%)
- FIGURE 18. COMPARATIVE SHARE ANALYSIS OF HERBAL TEA MARKET FOR BLENDS, BY COUNTRY 2022 AND 2032(%)
- FIGURE 19. COMPARATIVE SHARE ANALYSIS OF HERBAL TEA MARKET FOR OTHERS, BY COUNTRY 2022 AND 2032(%)
- FIGURE 20. HERBAL TEA MARKET, BY PACKAGING, 2022 AND 2032(%)
- FIGURE 21. COMPARATIVE SHARE ANALYSIS OF HERBAL TEA MARKET FOR LOOSE TEA, BY COUNTRY 2022 AND 2032(%)
- FIGURE 22. COMPARATIVE SHARE ANALYSIS OF HERBAL TEA MARKET FOR PAPERBOARDS, BY COUNTRY 2022 AND 2032(%)
- FIGURE 23. COMPARATIVE SHARE ANALYSIS OF HERBAL TEA MARKET FOR ALUMINUM TINS, BY COUNTRY 2022 AND 2032(%)
- FIGURE 24. COMPARATIVE SHARE ANALYSIS OF HERBAL TEA MARKET FOR TEA BAGS, BY COUNTRY 2022 AND 2032(%)
- FIGURE 25. HERBAL TEA MARKET, BY DISTRIBUTION CHANNEL, 2022 AND 2032(%)
- FIGURE 26. COMPARATIVE SHARE ANALYSIS OF HERBAL TEA MARKET FOR SUPERMARKET-HYPERMARKET, BY COUNTRY 2022 AND 2032(%)
- FIGURE 27. COMPARATIVE SHARE ANALYSIS OF HERBAL TEA MARKET FOR SPECIALTY STORES, BY COUNTRY 2022 AND 2032(%)
- FIGURE 28. COMPARATIVE SHARE ANALYSIS OF HERBAL TEA MARKET FOR CONVENIENCE STORES, BY COUNTRY 2022 AND 2032(%)
- FIGURE 29. COMPARATIVE SHARE ANALYSIS OF HERBAL TEA MARKET FOR ONLINE SALES CHANNEL, BY COUNTRY 2022 AND 2032(%)
- FIGURE 30. COMPARATIVE SHARE ANALYSIS OF HERBAL TEA MARKET FOR OTHERS, BY COUNTRY 2022 AND 2032(%)
- FIGURE 31. HERBAL TEA MARKET BY REGION, 2022 AND 2032(%)
- FIGURE 32. U.S. HERBAL TEA MARKET, 2022-2032 ($MILLION)
- FIGURE 33. CANADA HERBAL TEA MARKET, 2022-2032 ($MILLION)
- FIGURE 34. MEXICO HERBAL TEA MARKET, 2022-2032 ($MILLION)
- FIGURE 35. GERMANY HERBAL TEA MARKET, 2022-2032 ($MILLION)
- FIGURE 36. UK HERBAL TEA MARKET, 2022-2032 ($MILLION)
- FIGURE 37. FRANCE HERBAL TEA MARKET, 2022-2032 ($MILLION)
- FIGURE 38. ITALY HERBAL TEA MARKET, 2022-2032 ($MILLION)
- FIGURE 39. SPAIN HERBAL TEA MARKET, 2022-2032 ($MILLION)
- FIGURE 40. REST OF EUROPE HERBAL TEA MARKET, 2022-2032 ($MILLION)
- FIGURE 41. CHINA HERBAL TEA MARKET, 2022-2032 ($MILLION)
- FIGURE 42. JAPAN HERBAL TEA MARKET, 2022-2032 ($MILLION)
- FIGURE 43. INDIA HERBAL TEA MARKET, 2022-2032 ($MILLION)
- FIGURE 44. SOUTH KOREA HERBAL TEA MARKET, 2022-2032 ($MILLION)
- FIGURE 45. AUSTRALIA HERBAL TEA MARKET, 2022-2032 ($MILLION)
- FIGURE 46. SINGAPORE HERBAL TEA MARKET, 2022-2032 ($MILLION)
- FIGURE 47. REST OF ASIA-PACIFIC HERBAL TEA MARKET, 2022-2032 ($MILLION)
- FIGURE 48. BRAZIL HERBAL TEA MARKET, 2022-2032 ($MILLION)
- FIGURE 49. SOUTH AFRICA HERBAL TEA MARKET, 2022-2032 ($MILLION)
- FIGURE 50. TURKEY HERBAL TEA MARKET, 2022-2032 ($MILLION)
- FIGURE 51. SAUDI ARABIA HERBAL TEA MARKET, 2022-2032 ($MILLION)
- FIGURE 52. EGYPT HERBAL TEA MARKET, 2022-2032 ($MILLION)
- FIGURE 53. REST OF LAMEA HERBAL TEA MARKET, 2022-2032 ($MILLION)
- FIGURE 54. TOP WINNING STRATEGIES, BY YEAR (2021-2023)
- FIGURE 55. TOP WINNING STRATEGIES, BY DEVELOPMENT (2021-2023)
- FIGURE 56. TOP WINNING STRATEGIES, BY COMPANY (2021-2023)
- FIGURE 57. PRODUCT MAPPING OF TOP 10 PLAYERS
- FIGURE 58. COMPETITIVE DASHBOARD
- FIGURE 59. COMPETITIVE HEATMAP: HERBAL TEA MARKET
- FIGURE 60. TOP PLAYER POSITIONING, 2022
- FIGURE 61. TATA CONSUMER PRODUCTS LIMITED: NET REVENUE, 2020-2022 ($MILLION)
- FIGURE 62. TATA CONSUMER PRODUCTS LIMITED: REVENUE SHARE BY SEGMENT, 2022 (%)
- FIGURE 63. TATA CONSUMER PRODUCTS LIMITED: REVENUE SHARE BY REGION, 2022 (%)
- FIGURE 64. THE HAIN CELESTIAL GROUP, INC.: NET SALES, 2020-2022 ($MILLION)
- FIGURE 65. THE HAIN CELESTIAL GROUP, INC.: RESEARCH & DEVELOPMENT EXPENDITURE, 2020-2022 ($MILLION)
- FIGURE 66. THE HAIN CELESTIAL GROUP, INC.: REVENUE SHARE BY SEGMENT, 2022 (%)
- FIGURE 67. THE HAIN CELESTIAL GROUP, INC.: REVENUE SHARE BY REGION, 2022 (%)
- FIGURE 68. ORGANIC INDIA PVT. LTD.: NET REVENUE, 2018-2020 ($MILLION)


