


 |
市場調查報告書
商品編碼
1414906
玻璃纖維增強塑膠 (GFRP) 複合材料市場:按樹脂類型、製程和最終用途產業:2023-2032年全球機會分析與產業預測Glass Fiber Reinforced Plastics Composites Market By Resin Type, By Process, By End Use Industry : Global Opportunity Analysis and Industry Forecast, 2023-2032 |
||||||
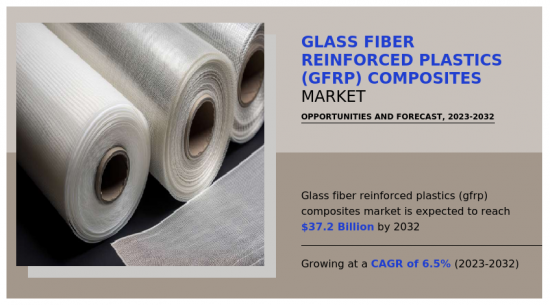
2022年玻璃纖維增強塑膠(GFRP)複合材料市值為 198 億美元,預計2023年至2032年年複合成長率為 6.5%,到2032年將達到 372 億美元。
對永續和環保材料的日益關注推動對 GFRP 複合材料的需求。日益嚴格的法規和對環境的關注推動人們尋找可回收和環保的材料。進行的研究目的是提高複合材料的可回收性並提高 GFRP 複合材料的永續性。可回收 GFRP 複合材料的開發代表了一項重大進步,為尋求環保解決方案的行業提供了成長機會。世界各地的政府和監管機構實施更嚴格的法規,目的是減少碳排放、增加回收和提高資源效率。 GFRP 複合材料越來越受到歡迎,以滿足這些嚴格的監管要求,因為與傳統材料相比,它們可回收且碳足跡更低。
對永續和環保材料的日益關注推動對 GFRP 複合材料的需求。日益嚴格的法規和對環境的關注推動人們尋找可回收和環保的材料。進行的研究目的是提高複合材料的可回收性並提高 GFRP 複合材料的永續性。可回收 GFRP 複合材料的開發代表了一項重大進步,為尋求環保解決方案的行業提供了成長機會。世界各地的政府和監管機構實施更嚴格的法規,目的是減少碳排放、增加回收和提高資源效率。 GFRP 複合材料越來越受到歡迎,以滿足這些嚴格的監管要求,因為與傳統材料相比,它們可回收且碳足跡更低。
玻璃纖維增強塑膠(GFRP)複合材料的技術進步徹底改變了其製造、性能和應用,並推動了重大創新。先進的製造技術簡化了 GFRP 複合材料的製造流程,可以精確、有效率地製造複雜零件。有以下幾種方法:
- 自動纖維鋪放、樹脂轉注成形和積層製造等方法最佳化了生產,降低了成本,並促進了為不同行業製造複雜、客製化的複合材料零件。進行的研究重點是開發用於 GFRP 複合材料的創新樹脂配方和增強纖維。這些進步目的是提高機械強度、耐用性、熱穩定性和對環境因素的抵抗力。此外,奈米技術可以融入 GFRP 複合材料中,以進一步改善其性能並引進功能,例如增加強度、導電性或針對特定工業需求量身定做的增強性能。對回收技術的承諾可實現 GFRP 材料的高效再利用,最大限度地減少廢棄物並延長材料生命週期。
目錄
第1章 簡介
第2章 執行摘要
第3章 市場概況
- 市場定義和範圍
- 主要發現
- 影響因素
- 主要投資機會
- 波特五力分析
- 市場動態
- 促進因素
- 航太和汽車產業的需求不斷成長
- 越來越關注永續和環保材料
- 抑制因素
- 回收和永續性問題
- 機會
- 技術進步
- 促進因素
- 價值鏈分析
- 關鍵監管分析
- 專利形勢
- 價格分析
- 監管指引
第4章 玻璃纖維增強塑膠(GFRP)複合材料市場:按樹脂類型
- 概述
- 聚酯樹脂
- 乙烯基酯樹脂
- 環氧樹脂
- 聚氨酯樹脂
- 其他
第5章 玻璃纖維增強塑膠(GFRP)複合材料市場:按過程分類
- 概述
- 手動過程
- 連續製程
- 壓縮成型
- 射出成型
第6章 玻璃纖維增強塑膠(GFRP)複合材料市場:以最終用途產業
- 概述
- 航太/國防
- 建造
- 風力發電
- 車輛
- 電力/電子
- 其他
第7章 玻璃纖維增強塑膠(GFRP)複合材料市場:依地區
- 概述
- 北美洲
- 美國
- 加拿大
- 墨西哥
- 歐洲
- 德國
- 英國
- 法國
- 西班牙
- 義大利
- 其他
- 亞太地區
- 中國
- 印度
- 日本
- 韓國
- 澳洲
- 其他
- 拉丁美洲、中東、非洲
- 巴西
- 沙烏地阿拉伯
- 南非
- 其他
第8章 競爭形勢
- 介紹
- 關鍵成功策略
- 10家主要企業產品圖譜
- 競爭對手儀表板
- 競爭熱圖
- 2022年主要企業定位
第9章 公司簡介
- Owens Corning
- Johns Manville
- Sancom Composites LLP
- Asahi Kasei Corporation
- PPG Industries, Inc.
- 3B-the fibreglass company
- Nippon Sheet Glass Co., Ltd
- Nitto Boseki Co., Ltd.
- Celanese Corporation
- Mitsubishi Chemical Group Corporation
According to a new report published by Allied Market Research, titled, "Glass Fiber Reinforced Plastics (GFRP) Composites Market," The glass fiber reinforced plastics (GFRP) composites market was valued at $19.8 billion in 2022, and is estimated to reach $37.2 billion by 2032, growing at a CAGR of 6.5% from 2023 to 2032.
The increasing focus on sustainable and eco-friendly materials is driving the demand for GFRP composites. Tightening regulations and environmental concerns prompt the search for materials that are recyclable and environmentally conscious. Ongoing research aims to improve the recyclability of composite materials, thereby enhancing the sustainability profile of GFRP composites. The development of recyclable GFRP composites would mark a significant advancement, fostering growth opportunities in industries striving for environmentally friendly solutions. Governments and regulatory bodies globally are imposing stricter regulations aimed at reducing carbon emissions, promoting recycling, and improving resource efficiency. GFRP composites, with their potential for recyclability and lower carbon footprint compared to certain conventional materials, are increasingly sought after to meet these stringent regulatory requirements.
The increasing focus on sustainable and eco-friendly materials is driving the demand for GFRP composites. Tightening regulations and environmental concerns prompt the search for materials that are recyclable and environmentally conscious. Ongoing research aims to improve the recyclability of composite materials, thereby enhancing the sustainability profile of GFRP composites. The development of recyclable GFRP composites would mark a significant advancement, fostering growth opportunities in industries striving for environmentally friendly solutions. Governments and regulatory bodies globally are imposing stricter regulations aimed at reducing carbon emissions, promoting recycling, and improving resource efficiency. GFRP composites, with their potential for recyclability and lower carbon footprint compared to certain conventional materials, are increasingly sought after to meet these stringent regulatory requirements.
Technological advancements in glass fiber reinforced plastic (GFRP) composites have propelled significant innovations, revolutionizing their manufacturing, properties, and applications. Advanced manufacturing techniques have streamlined the production processes of GFRP composites, enabling precision and efficiency in creating complex components. Methods such as automated fiber placement, resin transfer molding, and additive manufacturing have optimized production, reduced costs, and facilitated the fabrication of intricate and tailored composite parts for diverse industries. Ongoing research focuses on developing innovative resin formulations and reinforcing fibers for GFRP composites. These advancements aim to enhance mechanical strength, durability, thermal stability, and resistance to environmental factors. Moreover, the integration of nanotechnology into GFRP composites offers opportunities to further augment their properties, introducing functionalities like increased strength, conductivity, or enhanced performance tailored to specific industry needs. Efforts in recycling technologies enable the efficient reuse of GFRP materials, minimizing waste and extending the material's lifecycle.
The glass fiber reinforced plastics (GFRP) composites market is segmented based on resin type, process, end-use industry, and region. By type, the market is divided into polyester resin, vinyl ester resin, epoxy resin, polyurethane resin, and others. Based on the process, it is categorized into manual process, continuous process, compression molding, and injection molding. Depending on the end-use industry, the market is segregated into aerospace and defense, construction, wind energy, automotive, electrical and electronics, and others. Region-wise, the market is studied across North America, Europe, Asia-Pacific, and LAMEA.
The major players operating in the global glass fiber reinforced plastics (GFRP) composites market are Owens Corning, Johns Manville, Sancom Composites LLP, Asahi Kasei Corporation, PPG Industries, Inc., 3B - the fibreglass company, Nippon Sheet Glass Co., Ltd, Nitto Boseki Co., Ltd., Celanese Corporation, and Mitsubishi Chemical Group Corporation. Other players include SGL Carbon, alformet, Rochling, Amiblu Holding GmbH, Chomarat Group, Saint Gobain Vetrotex, Honeywell International Inc., BASF SE, Reliance Industries Ltd., Advanced Composites Inc., Braj Binani Group, and BGF Industries Inc.
Key Benefits For Stakeholders
- This report provides a quantitative analysis of the market segments, current trends, estimations, and dynamics of the glass fiber reinforced plastics (gfrp) composites market analysis from 2022 to 2032 to identify the prevailing glass fiber reinforced plastics (gfrp) composites market opportunities.
- The market research is offered along with information related to key drivers, restraints, and opportunities.
- Porter's five forces analysis highlights the potency of buyers and suppliers to enable stakeholders make profit-oriented business decisions and strengthen their supplier-buyer network.
- In-depth analysis of the glass fiber reinforced plastics (gfrp) composites market segmentation assists to determine the prevailing market opportunities.
- Major countries in each region are mapped according to their revenue contribution to the global market.
- Market player positioning facilitates benchmarking and provides a clear understanding of the present position of the market players.
- The report includes the analysis of the regional as well as global glass fiber reinforced plastics (gfrp) composites market trends, key players, market segments, application areas, and market growth strategies.
Additional benefits you will get with this purchase are:
- Quarterly Update and* (only available with a corporate license, on listed price)
- 5 additional Company Profile of client Choice pre- or Post-purchase, as a free update.
- Free Upcoming Version on the Purchase of Five and Enterprise User License.
- 16 analyst hours of support* (post-purchase, if you find additional data requirements upon review of the report, you may receive support amounting to 16 analyst hours to solve questions, and post-sale queries)
- 15% Free Customization* (in case the scope or segment of the report does not match your requirements, 15% is equivalent to 3 working days of free work, applicable once)
- Free data Pack on the Five and Enterprise User License. (Excel version of the report)
- Free Updated report if the report is 6-12 months old or older.
- 24-hour priority response*
- Free Industry updates and white papers.
Possible Customization with this report (with additional cost and timeline, please talk to the sales executive to know more)
- Analysis of raw material in a product (by %)
- Manufacturing Capacity
- Investment Opportunities
- Product Life Cycles
- Supply Chain Analysis & Vendor Margins
- Upcoming/New Entrant by Regions
- Technology Trend Analysis
- Consumer Preference and Product Specifications
- Go To Market Strategy
- New Product Development/ Product Matrix of Key Players
- Regulatory Guidelines
- Additional company profiles with specific to client's interest
- Additional country or region analysis- market size and forecast
- Average Selling Price Analysis / Price Point Analysis
- Expanded list for Company Profiles
- Import Export Analysis/Data
- Key player details (including location, contact details, supplier/vendor network etc. in excel format)
- List of customers/consumers/raw material suppliers- value chain analysis
- Market share analysis of players at global/region/country level
- Product Consumption Analysis
- SWOT Analysis
- Volume Market Size and Forecast
Key Market Segments
By Resin Type
- Polyester resin
- Vinyl ester resin
- Epoxy resin
- Polyurethane resin
- Others
By Process
- Manual process
- Continuous process
- Compression molding
- Injection molding
By End Use Industry
- Aerospace and defense
- Construction
- Wind energy
- Automotive
- Electrical and electronics
- Others
By Region
- North America
- U.S.
- Canada
- Mexico
- Europe
- Germany
- UK
- France
- Spain
- Italy
- Rest of Europe
- Asia-Pacific
- China
- India
- Japan
- South Korea
- Australia
- Rest of Asia-Pacific
- LAMEA
- Brazil
- Saudi Arabia
- South Africa
- Rest of LAMEA
Key Market Players:
- Owens Corning
- Johns Manville
- 3B - the fibreglass company
- Sancom Composites LLP
- Celanese Corporation
- Nippon Sheet Glass Co., Ltd
- Mitsubishi Chemical Group Corporation
- Asahi Kasei Corporation
- PPG Industries, Inc.
- Nitto Boseki Co., Ltd.
TABLE OF CONTENTS
CHAPTER 1: INTRODUCTION
- 1.1. Report description
- 1.2. Key market segments
- 1.3. Key benefits to the stakeholders
- 1.4. Research methodology
- 1.4.1. Primary research
- 1.4.2. Secondary research
- 1.4.3. Analyst tools and models
CHAPTER 2: EXECUTIVE SUMMARY
- 2.1. CXO Perspective
CHAPTER 3: MARKET OVERVIEW
- 3.1. Market definition and scope
- 3.2. Key findings
- 3.2.1. Top impacting factors
- 3.2.2. Top investment pockets
- 3.3. Porter's five forces analysis
- 3.3.1. Moderate bargaining power of suppliers
- 3.3.2. Low threat of new entrants
- 3.3.3. Moderate threat of substitutes
- 3.3.4. Moderate intensity of rivalry
- 3.3.5. High bargaining power of buyers
- 3.4. Market dynamics
- 3.4.1. Drivers
- 3.4.1.1. Increased demand in aerospace and automotive industries
- 3.4.1.2. Increasing focus on sustainable and eco-friendly materials
- 3.4.2. Restraints
- 3.4.2.1. Recycling and sustainability concerns
- 3.4.3. Opportunities
- 3.4.3.1. Technological advancements
- 3.4.1. Drivers
- 3.5. Value Chain Analysis
- 3.6. Key Regulation Analysis
- 3.7. Patent Landscape
- 3.8. Pricing Analysis
- 3.9. Regulatory Guidelines
CHAPTER 4: GLASS FIBER REINFORCED PLASTICS (GFRP) COMPOSITES MARKET, BY RESIN TYPE
- 4.1. Overview
- 4.1.1. Market size and forecast
- 4.2. Polyester resin
- 4.2.1. Key market trends, growth factors and opportunities
- 4.2.2. Market size and forecast, by region
- 4.2.3. Market share analysis by country
- 4.3. Vinyl ester resin
- 4.3.1. Key market trends, growth factors and opportunities
- 4.3.2. Market size and forecast, by region
- 4.3.3. Market share analysis by country
- 4.4. Epoxy resin
- 4.4.1. Key market trends, growth factors and opportunities
- 4.4.2. Market size and forecast, by region
- 4.4.3. Market share analysis by country
- 4.5. Polyurethane resin
- 4.5.1. Key market trends, growth factors and opportunities
- 4.5.2. Market size and forecast, by region
- 4.5.3. Market share analysis by country
- 4.6. Others
- 4.6.1. Key market trends, growth factors and opportunities
- 4.6.2. Market size and forecast, by region
- 4.6.3. Market share analysis by country
CHAPTER 5: GLASS FIBER REINFORCED PLASTICS (GFRP) COMPOSITES MARKET, BY PROCESS
- 5.1. Overview
- 5.1.1. Market size and forecast
- 5.2. Manual process
- 5.2.1. Key market trends, growth factors and opportunities
- 5.2.2. Market size and forecast, by region
- 5.2.3. Market share analysis by country
- 5.3. Continuous process
- 5.3.1. Key market trends, growth factors and opportunities
- 5.3.2. Market size and forecast, by region
- 5.3.3. Market share analysis by country
- 5.4. Compression molding
- 5.4.1. Key market trends, growth factors and opportunities
- 5.4.2. Market size and forecast, by region
- 5.4.3. Market share analysis by country
- 5.5. Injection molding
- 5.5.1. Key market trends, growth factors and opportunities
- 5.5.2. Market size and forecast, by region
- 5.5.3. Market share analysis by country
CHAPTER 6: GLASS FIBER REINFORCED PLASTICS (GFRP) COMPOSITES MARKET, BY END USE INDUSTRY
- 6.1. Overview
- 6.1.1. Market size and forecast
- 6.2. Aerospace and defense
- 6.2.1. Key market trends, growth factors and opportunities
- 6.2.2. Market size and forecast, by region
- 6.2.3. Market share analysis by country
- 6.3. Construction
- 6.3.1. Key market trends, growth factors and opportunities
- 6.3.2. Market size and forecast, by region
- 6.3.3. Market share analysis by country
- 6.4. Wind energy
- 6.4.1. Key market trends, growth factors and opportunities
- 6.4.2. Market size and forecast, by region
- 6.4.3. Market share analysis by country
- 6.5. Automotive
- 6.5.1. Key market trends, growth factors and opportunities
- 6.5.2. Market size and forecast, by region
- 6.5.3. Market share analysis by country
- 6.6. Electrical and electronics
- 6.6.1. Key market trends, growth factors and opportunities
- 6.6.2. Market size and forecast, by region
- 6.6.3. Market share analysis by country
- 6.7. Others
- 6.7.1. Key market trends, growth factors and opportunities
- 6.7.2. Market size and forecast, by region
- 6.7.3. Market share analysis by country
CHAPTER 7: GLASS FIBER REINFORCED PLASTICS (GFRP) COMPOSITES MARKET, BY REGION
- 7.1. Overview
- 7.1.1. Market size and forecast By Region
- 7.2. North America
- 7.2.1. Key market trends, growth factors and opportunities
- 7.2.2. Market size and forecast, by Resin Type
- 7.2.3. Market size and forecast, by Process
- 7.2.4. Market size and forecast, by End Use Industry
- 7.2.5. Market size and forecast, by country
- 7.2.5.1. U.S.
- 7.2.5.1.1. Market size and forecast, by Resin Type
- 7.2.5.1.2. Market size and forecast, by Process
- 7.2.5.1.3. Market size and forecast, by End Use Industry
- 7.2.5.2. Canada
- 7.2.5.2.1. Market size and forecast, by Resin Type
- 7.2.5.2.2. Market size and forecast, by Process
- 7.2.5.2.3. Market size and forecast, by End Use Industry
- 7.2.5.3. Mexico
- 7.2.5.3.1. Market size and forecast, by Resin Type
- 7.2.5.3.2. Market size and forecast, by Process
- 7.2.5.3.3. Market size and forecast, by End Use Industry
- 7.3. Europe
- 7.3.1. Key market trends, growth factors and opportunities
- 7.3.2. Market size and forecast, by Resin Type
- 7.3.3. Market size and forecast, by Process
- 7.3.4. Market size and forecast, by End Use Industry
- 7.3.5. Market size and forecast, by country
- 7.3.5.1. Germany
- 7.3.5.1.1. Market size and forecast, by Resin Type
- 7.3.5.1.2. Market size and forecast, by Process
- 7.3.5.1.3. Market size and forecast, by End Use Industry
- 7.3.5.2. UK
- 7.3.5.2.1. Market size and forecast, by Resin Type
- 7.3.5.2.2. Market size and forecast, by Process
- 7.3.5.2.3. Market size and forecast, by End Use Industry
- 7.3.5.3. France
- 7.3.5.3.1. Market size and forecast, by Resin Type
- 7.3.5.3.2. Market size and forecast, by Process
- 7.3.5.3.3. Market size and forecast, by End Use Industry
- 7.3.5.4. Spain
- 7.3.5.4.1. Market size and forecast, by Resin Type
- 7.3.5.4.2. Market size and forecast, by Process
- 7.3.5.4.3. Market size and forecast, by End Use Industry
- 7.3.5.5. Italy
- 7.3.5.5.1. Market size and forecast, by Resin Type
- 7.3.5.5.2. Market size and forecast, by Process
- 7.3.5.5.3. Market size and forecast, by End Use Industry
- 7.3.5.6. Rest of Europe
- 7.3.5.6.1. Market size and forecast, by Resin Type
- 7.3.5.6.2. Market size and forecast, by Process
- 7.3.5.6.3. Market size and forecast, by End Use Industry
- 7.4. Asia-Pacific
- 7.4.1. Key market trends, growth factors and opportunities
- 7.4.2. Market size and forecast, by Resin Type
- 7.4.3. Market size and forecast, by Process
- 7.4.4. Market size and forecast, by End Use Industry
- 7.4.5. Market size and forecast, by country
- 7.4.5.1. China
- 7.4.5.1.1. Market size and forecast, by Resin Type
- 7.4.5.1.2. Market size and forecast, by Process
- 7.4.5.1.3. Market size and forecast, by End Use Industry
- 7.4.5.2. India
- 7.4.5.2.1. Market size and forecast, by Resin Type
- 7.4.5.2.2. Market size and forecast, by Process
- 7.4.5.2.3. Market size and forecast, by End Use Industry
- 7.4.5.3. Japan
- 7.4.5.3.1. Market size and forecast, by Resin Type
- 7.4.5.3.2. Market size and forecast, by Process
- 7.4.5.3.3. Market size and forecast, by End Use Industry
- 7.4.5.4. South Korea
- 7.4.5.4.1. Market size and forecast, by Resin Type
- 7.4.5.4.2. Market size and forecast, by Process
- 7.4.5.4.3. Market size and forecast, by End Use Industry
- 7.4.5.5. Australia
- 7.4.5.5.1. Market size and forecast, by Resin Type
- 7.4.5.5.2. Market size and forecast, by Process
- 7.4.5.5.3. Market size and forecast, by End Use Industry
- 7.4.5.6. Rest of Asia-Pacific
- 7.4.5.6.1. Market size and forecast, by Resin Type
- 7.4.5.6.2. Market size and forecast, by Process
- 7.4.5.6.3. Market size and forecast, by End Use Industry
- 7.5. LAMEA
- 7.5.1. Key market trends, growth factors and opportunities
- 7.5.2. Market size and forecast, by Resin Type
- 7.5.3. Market size and forecast, by Process
- 7.5.4. Market size and forecast, by End Use Industry
- 7.5.5. Market size and forecast, by country
- 7.5.5.1. Brazil
- 7.5.5.1.1. Market size and forecast, by Resin Type
- 7.5.5.1.2. Market size and forecast, by Process
- 7.5.5.1.3. Market size and forecast, by End Use Industry
- 7.5.5.2. Saudi Arabia
- 7.5.5.2.1. Market size and forecast, by Resin Type
- 7.5.5.2.2. Market size and forecast, by Process
- 7.5.5.2.3. Market size and forecast, by End Use Industry
- 7.5.5.3. South Africa
- 7.5.5.3.1. Market size and forecast, by Resin Type
- 7.5.5.3.2. Market size and forecast, by Process
- 7.5.5.3.3. Market size and forecast, by End Use Industry
- 7.5.5.4. Rest of LAMEA
- 7.5.5.4.1. Market size and forecast, by Resin Type
- 7.5.5.4.2. Market size and forecast, by Process
- 7.5.5.4.3. Market size and forecast, by End Use Industry
CHAPTER 8: COMPETITIVE LANDSCAPE
- 8.1. Introduction
- 8.2. Top winning strategies
- 8.3. Product mapping of top 10 player
- 8.4. Competitive dashboard
- 8.5. Competitive heatmap
- 8.6. Top player positioning, 2022
CHAPTER 9: COMPANY PROFILES
- 9.1. Owens Corning
- 9.1.1. Company overview
- 9.1.2. Key executives
- 9.1.3. Company snapshot
- 9.1.4. Operating business segments
- 9.1.5. Product portfolio
- 9.1.6. Business performance
- 9.1.7. Key strategic moves and developments
- 9.2. Johns Manville
- 9.2.1. Company overview
- 9.2.2. Key executives
- 9.2.3. Company snapshot
- 9.2.4. Operating business segments
- 9.2.5. Product portfolio
- 9.3. Sancom Composites LLP
- 9.3.1. Company overview
- 9.3.2. Key executives
- 9.3.3. Company snapshot
- 9.3.4. Operating business segments
- 9.3.5. Product portfolio
- 9.4. Asahi Kasei Corporation
- 9.4.1. Company overview
- 9.4.2. Key executives
- 9.4.3. Company snapshot
- 9.4.4. Operating business segments
- 9.4.5. Product portfolio
- 9.4.6. Business performance
- 9.5. PPG Industries, Inc.
- 9.5.1. Company overview
- 9.5.2. Key executives
- 9.5.3. Company snapshot
- 9.5.4. Operating business segments
- 9.5.5. Product portfolio
- 9.5.6. Business performance
- 9.6. 3B - the fibreglass company
- 9.6.1. Company overview
- 9.6.2. Key executives
- 9.6.3. Company snapshot
- 9.6.4. Operating business segments
- 9.6.5. Product portfolio
- 9.7. Nippon Sheet Glass Co., Ltd
- 9.7.1. Company overview
- 9.7.2. Key executives
- 9.7.3. Company snapshot
- 9.7.4. Operating business segments
- 9.7.5. Product portfolio
- 9.7.6. Business performance
- 9.8. Nitto Boseki Co., Ltd.
- 9.8.1. Company overview
- 9.8.2. Key executives
- 9.8.3. Company snapshot
- 9.8.4. Operating business segments
- 9.8.5. Product portfolio
- 9.8.6. Business performance
- 9.9. Celanese Corporation
- 9.9.1. Company overview
- 9.9.2. Key executives
- 9.9.3. Company snapshot
- 9.9.4. Operating business segments
- 9.9.5. Product portfolio
- 9.9.6. Business performance
- 9.10. Mitsubishi Chemical Group Corporation
- 9.10.1. Company overview
- 9.10.2. Key executives
- 9.10.3. Company snapshot
- 9.10.4. Operating business segments
- 9.10.5. Product portfolio
- 9.10.6. Business performance
LIST OF TABLES
- TABLE 01. GLOBAL GLASS FIBER REINFORCED PLASTICS (GFRP) COMPOSITES MARKET, BY RESIN TYPE, 2022-2032 ($MILLION)
- TABLE 02. GLOBAL GLASS FIBER REINFORCED PLASTICS (GFRP) COMPOSITES MARKET, BY RESIN TYPE, 2022-2032 (KILOTON)
- TABLE 03. GLASS FIBER REINFORCED PLASTICS (GFRP) COMPOSITES MARKET FOR POLYESTER RESIN, BY REGION, 2022-2032 ($MILLION)
- TABLE 04. GLASS FIBER REINFORCED PLASTICS (GFRP) COMPOSITES MARKET FOR POLYESTER RESIN, BY REGION, 2022-2032 (KILOTON)
- TABLE 05. GLASS FIBER REINFORCED PLASTICS (GFRP) COMPOSITES MARKET FOR VINYL ESTER RESIN, BY REGION, 2022-2032 ($MILLION)
- TABLE 06. GLASS FIBER REINFORCED PLASTICS (GFRP) COMPOSITES MARKET FOR VINYL ESTER RESIN, BY REGION, 2022-2032 (KILOTON)
- TABLE 07. GLASS FIBER REINFORCED PLASTICS (GFRP) COMPOSITES MARKET FOR EPOXY RESIN, BY REGION, 2022-2032 ($MILLION)
- TABLE 08. GLASS FIBER REINFORCED PLASTICS (GFRP) COMPOSITES MARKET FOR EPOXY RESIN, BY REGION, 2022-2032 (KILOTON)
- TABLE 09. GLASS FIBER REINFORCED PLASTICS (GFRP) COMPOSITES MARKET FOR POLYURETHANE RESIN, BY REGION, 2022-2032 ($MILLION)
- TABLE 10. GLASS FIBER REINFORCED PLASTICS (GFRP) COMPOSITES MARKET FOR POLYURETHANE RESIN, BY REGION, 2022-2032 (KILOTON)
- TABLE 11. GLASS FIBER REINFORCED PLASTICS (GFRP) COMPOSITES MARKET FOR OTHERS, BY REGION, 2022-2032 ($MILLION)
- TABLE 12. GLASS FIBER REINFORCED PLASTICS (GFRP) COMPOSITES MARKET FOR OTHERS, BY REGION, 2022-2032 (KILOTON)
- TABLE 13. GLOBAL GLASS FIBER REINFORCED PLASTICS (GFRP) COMPOSITES MARKET, BY PROCESS, 2022-2032 ($MILLION)
- TABLE 14. GLOBAL GLASS FIBER REINFORCED PLASTICS (GFRP) COMPOSITES MARKET, BY PROCESS, 2022-2032 (KILOTON)
- TABLE 15. GLASS FIBER REINFORCED PLASTICS (GFRP) COMPOSITES MARKET FOR MANUAL PROCESS, BY REGION, 2022-2032 ($MILLION)
- TABLE 16. GLASS FIBER REINFORCED PLASTICS (GFRP) COMPOSITES MARKET FOR MANUAL PROCESS, BY REGION, 2022-2032 (KILOTON)
- TABLE 17. GLASS FIBER REINFORCED PLASTICS (GFRP) COMPOSITES MARKET FOR CONTINUOUS PROCESS, BY REGION, 2022-2032 ($MILLION)
- TABLE 18. GLASS FIBER REINFORCED PLASTICS (GFRP) COMPOSITES MARKET FOR CONTINUOUS PROCESS, BY REGION, 2022-2032 (KILOTON)
- TABLE 19. GLASS FIBER REINFORCED PLASTICS (GFRP) COMPOSITES MARKET FOR COMPRESSION MOLDING, BY REGION, 2022-2032 ($MILLION)
- TABLE 20. GLASS FIBER REINFORCED PLASTICS (GFRP) COMPOSITES MARKET FOR COMPRESSION MOLDING, BY REGION, 2022-2032 (KILOTON)
- TABLE 21. GLASS FIBER REINFORCED PLASTICS (GFRP) COMPOSITES MARKET FOR INJECTION MOLDING, BY REGION, 2022-2032 ($MILLION)
- TABLE 22. GLASS FIBER REINFORCED PLASTICS (GFRP) COMPOSITES MARKET FOR INJECTION MOLDING, BY REGION, 2022-2032 (KILOTON)
- TABLE 23. GLOBAL GLASS FIBER REINFORCED PLASTICS (GFRP) COMPOSITES MARKET, BY END USE INDUSTRY, 2022-2032 ($MILLION)
- TABLE 24. GLOBAL GLASS FIBER REINFORCED PLASTICS (GFRP) COMPOSITES MARKET, BY END USE INDUSTRY, 2022-2032 (KILOTON)
- TABLE 25. GLASS FIBER REINFORCED PLASTICS (GFRP) COMPOSITES MARKET FOR AEROSPACE AND DEFENSE, BY REGION, 2022-2032 ($MILLION)
- TABLE 26. GLASS FIBER REINFORCED PLASTICS (GFRP) COMPOSITES MARKET FOR AEROSPACE AND DEFENSE, BY REGION, 2022-2032 (KILOTON)
- TABLE 27. GLASS FIBER REINFORCED PLASTICS (GFRP) COMPOSITES MARKET FOR CONSTRUCTION, BY REGION, 2022-2032 ($MILLION)
- TABLE 28. GLASS FIBER REINFORCED PLASTICS (GFRP) COMPOSITES MARKET FOR CONSTRUCTION, BY REGION, 2022-2032 (KILOTON)
- TABLE 29. GLASS FIBER REINFORCED PLASTICS (GFRP) COMPOSITES MARKET FOR WIND ENERGY, BY REGION, 2022-2032 ($MILLION)
- TABLE 30. GLASS FIBER REINFORCED PLASTICS (GFRP) COMPOSITES MARKET FOR WIND ENERGY, BY REGION, 2022-2032 (KILOTON)
- TABLE 31. GLASS FIBER REINFORCED PLASTICS (GFRP) COMPOSITES MARKET FOR AUTOMOTIVE, BY REGION, 2022-2032 ($MILLION)
- TABLE 32. GLASS FIBER REINFORCED PLASTICS (GFRP) COMPOSITES MARKET FOR AUTOMOTIVE, BY REGION, 2022-2032 (KILOTON)
- TABLE 33. GLASS FIBER REINFORCED PLASTICS (GFRP) COMPOSITES MARKET FOR ELECTRICAL AND ELECTRONICS, BY REGION, 2022-2032 ($MILLION)
- TABLE 34. GLASS FIBER REINFORCED PLASTICS (GFRP) COMPOSITES MARKET FOR ELECTRICAL AND ELECTRONICS, BY REGION, 2022-2032 (KILOTON)
- TABLE 35. GLASS FIBER REINFORCED PLASTICS (GFRP) COMPOSITES MARKET FOR OTHERS, BY REGION, 2022-2032 ($MILLION)
- TABLE 36. GLASS FIBER REINFORCED PLASTICS (GFRP) COMPOSITES MARKET FOR OTHERS, BY REGION, 2022-2032 (KILOTON)
- TABLE 37. GLASS FIBER REINFORCED PLASTICS (GFRP) COMPOSITES MARKET, BY REGION, 2022-2032 ($MILLION)
- TABLE 38. GLASS FIBER REINFORCED PLASTICS (GFRP) COMPOSITES MARKET, BY REGION, 2022-2032 (KILOTON)
- TABLE 39. NORTH AMERICA GLASS FIBER REINFORCED PLASTICS (GFRP) COMPOSITES MARKET, BY RESIN TYPE, 2022-2032 ($MILLION)
- TABLE 40. NORTH AMERICA GLASS FIBER REINFORCED PLASTICS (GFRP) COMPOSITES MARKET, BY RESIN TYPE, 2022-2032 (KILOTON)
- TABLE 41. NORTH AMERICA GLASS FIBER REINFORCED PLASTICS (GFRP) COMPOSITES MARKET, BY PROCESS, 2022-2032 ($MILLION)
- TABLE 42. NORTH AMERICA GLASS FIBER REINFORCED PLASTICS (GFRP) COMPOSITES MARKET, BY PROCESS, 2022-2032 (KILOTON)
- TABLE 43. NORTH AMERICA GLASS FIBER REINFORCED PLASTICS (GFRP) COMPOSITES MARKET, BY END USE INDUSTRY, 2022-2032 ($MILLION)
- TABLE 44. NORTH AMERICA GLASS FIBER REINFORCED PLASTICS (GFRP) COMPOSITES MARKET, BY END USE INDUSTRY, 2022-2032 (KILOTON)
- TABLE 45. NORTH AMERICA GLASS FIBER REINFORCED PLASTICS (GFRP) COMPOSITES MARKET, BY COUNTRY, 2022-2032 ($MILLION)
- TABLE 46. NORTH AMERICA GLASS FIBER REINFORCED PLASTICS (GFRP) COMPOSITES MARKET, BY COUNTRY, 2022-2032 (KILOTON)
- TABLE 47. U.S. GLASS FIBER REINFORCED PLASTICS (GFRP) COMPOSITES MARKET, BY RESIN TYPE, 2022-2032 ($MILLION)
- TABLE 48. U.S. GLASS FIBER REINFORCED PLASTICS (GFRP) COMPOSITES MARKET, BY RESIN TYPE, 2022-2032 (KILOTON)
- TABLE 49. U.S. GLASS FIBER REINFORCED PLASTICS (GFRP) COMPOSITES MARKET, BY PROCESS, 2022-2032 ($MILLION)
- TABLE 50. U.S. GLASS FIBER REINFORCED PLASTICS (GFRP) COMPOSITES MARKET, BY PROCESS, 2022-2032 (KILOTON)
- TABLE 51. U.S. GLASS FIBER REINFORCED PLASTICS (GFRP) COMPOSITES MARKET, BY END USE INDUSTRY, 2022-2032 ($MILLION)
- TABLE 52. U.S. GLASS FIBER REINFORCED PLASTICS (GFRP) COMPOSITES MARKET, BY END USE INDUSTRY, 2022-2032 (KILOTON)
- TABLE 53. CANADA GLASS FIBER REINFORCED PLASTICS (GFRP) COMPOSITES MARKET, BY RESIN TYPE, 2022-2032 ($MILLION)
- TABLE 54. CANADA GLASS FIBER REINFORCED PLASTICS (GFRP) COMPOSITES MARKET, BY RESIN TYPE, 2022-2032 (KILOTON)
- TABLE 55. CANADA GLASS FIBER REINFORCED PLASTICS (GFRP) COMPOSITES MARKET, BY PROCESS, 2022-2032 ($MILLION)
- TABLE 56. CANADA GLASS FIBER REINFORCED PLASTICS (GFRP) COMPOSITES MARKET, BY PROCESS, 2022-2032 (KILOTON)
- TABLE 57. CANADA GLASS FIBER REINFORCED PLASTICS (GFRP) COMPOSITES MARKET, BY END USE INDUSTRY, 2022-2032 ($MILLION)
- TABLE 58. CANADA GLASS FIBER REINFORCED PLASTICS (GFRP) COMPOSITES MARKET, BY END USE INDUSTRY, 2022-2032 (KILOTON)
- TABLE 59. MEXICO GLASS FIBER REINFORCED PLASTICS (GFRP) COMPOSITES MARKET, BY RESIN TYPE, 2022-2032 ($MILLION)
- TABLE 60. MEXICO GLASS FIBER REINFORCED PLASTICS (GFRP) COMPOSITES MARKET, BY RESIN TYPE, 2022-2032 (KILOTON)
- TABLE 61. MEXICO GLASS FIBER REINFORCED PLASTICS (GFRP) COMPOSITES MARKET, BY PROCESS, 2022-2032 ($MILLION)
- TABLE 62. MEXICO GLASS FIBER REINFORCED PLASTICS (GFRP) COMPOSITES MARKET, BY PROCESS, 2022-2032 (KILOTON)
- TABLE 63. MEXICO GLASS FIBER REINFORCED PLASTICS (GFRP) COMPOSITES MARKET, BY END USE INDUSTRY, 2022-2032 ($MILLION)
- TABLE 64. MEXICO GLASS FIBER REINFORCED PLASTICS (GFRP) COMPOSITES MARKET, BY END USE INDUSTRY, 2022-2032 (KILOTON)
- TABLE 65. EUROPE GLASS FIBER REINFORCED PLASTICS (GFRP) COMPOSITES MARKET, BY RESIN TYPE, 2022-2032 ($MILLION)
- TABLE 66. EUROPE GLASS FIBER REINFORCED PLASTICS (GFRP) COMPOSITES MARKET, BY RESIN TYPE, 2022-2032 (KILOTON)
- TABLE 67. EUROPE GLASS FIBER REINFORCED PLASTICS (GFRP) COMPOSITES MARKET, BY PROCESS, 2022-2032 ($MILLION)
- TABLE 68. EUROPE GLASS FIBER REINFORCED PLASTICS (GFRP) COMPOSITES MARKET, BY PROCESS, 2022-2032 (KILOTON)
- TABLE 69. EUROPE GLASS FIBER REINFORCED PLASTICS (GFRP) COMPOSITES MARKET, BY END USE INDUSTRY, 2022-2032 ($MILLION)
- TABLE 70. EUROPE GLASS FIBER REINFORCED PLASTICS (GFRP) COMPOSITES MARKET, BY END USE INDUSTRY, 2022-2032 (KILOTON)
- TABLE 71. EUROPE GLASS FIBER REINFORCED PLASTICS (GFRP) COMPOSITES MARKET, BY COUNTRY, 2022-2032 ($MILLION)
- TABLE 72. EUROPE GLASS FIBER REINFORCED PLASTICS (GFRP) COMPOSITES MARKET, BY COUNTRY, 2022-2032 (KILOTON)
- TABLE 73. GERMANY GLASS FIBER REINFORCED PLASTICS (GFRP) COMPOSITES MARKET, BY RESIN TYPE, 2022-2032 ($MILLION)
- TABLE 74. GERMANY GLASS FIBER REINFORCED PLASTICS (GFRP) COMPOSITES MARKET, BY RESIN TYPE, 2022-2032 (KILOTON)
- TABLE 75. GERMANY GLASS FIBER REINFORCED PLASTICS (GFRP) COMPOSITES MARKET, BY PROCESS, 2022-2032 ($MILLION)
- TABLE 76. GERMANY GLASS FIBER REINFORCED PLASTICS (GFRP) COMPOSITES MARKET, BY PROCESS, 2022-2032 (KILOTON)
- TABLE 77. GERMANY GLASS FIBER REINFORCED PLASTICS (GFRP) COMPOSITES MARKET, BY END USE INDUSTRY, 2022-2032 ($MILLION)
- TABLE 78. GERMANY GLASS FIBER REINFORCED PLASTICS (GFRP) COMPOSITES MARKET, BY END USE INDUSTRY, 2022-2032 (KILOTON)
- TABLE 79. UK GLASS FIBER REINFORCED PLASTICS (GFRP) COMPOSITES MARKET, BY RESIN TYPE, 2022-2032 ($MILLION)
- TABLE 80. UK GLASS FIBER REINFORCED PLASTICS (GFRP) COMPOSITES MARKET, BY RESIN TYPE, 2022-2032 (KILOTON)
- TABLE 81. UK GLASS FIBER REINFORCED PLASTICS (GFRP) COMPOSITES MARKET, BY PROCESS, 2022-2032 ($MILLION)
- TABLE 82. UK GLASS FIBER REINFORCED PLASTICS (GFRP) COMPOSITES MARKET, BY PROCESS, 2022-2032 (KILOTON)
- TABLE 83. UK GLASS FIBER REINFORCED PLASTICS (GFRP) COMPOSITES MARKET, BY END USE INDUSTRY, 2022-2032 ($MILLION)
- TABLE 84. UK GLASS FIBER REINFORCED PLASTICS (GFRP) COMPOSITES MARKET, BY END USE INDUSTRY, 2022-2032 (KILOTON)
- TABLE 85. FRANCE GLASS FIBER REINFORCED PLASTICS (GFRP) COMPOSITES MARKET, BY RESIN TYPE, 2022-2032 ($MILLION)
- TABLE 86. FRANCE GLASS FIBER REINFORCED PLASTICS (GFRP) COMPOSITES MARKET, BY RESIN TYPE, 2022-2032 (KILOTON)
- TABLE 87. FRANCE GLASS FIBER REINFORCED PLASTICS (GFRP) COMPOSITES MARKET, BY PROCESS, 2022-2032 ($MILLION)
- TABLE 88. FRANCE GLASS FIBER REINFORCED PLASTICS (GFRP) COMPOSITES MARKET, BY PROCESS, 2022-2032 (KILOTON)
- TABLE 89. FRANCE GLASS FIBER REINFORCED PLASTICS (GFRP) COMPOSITES MARKET, BY END USE INDUSTRY, 2022-2032 ($MILLION)
- TABLE 90. FRANCE GLASS FIBER REINFORCED PLASTICS (GFRP) COMPOSITES MARKET, BY END USE INDUSTRY, 2022-2032 (KILOTON)
- TABLE 91. SPAIN GLASS FIBER REINFORCED PLASTICS (GFRP) COMPOSITES MARKET, BY RESIN TYPE, 2022-2032 ($MILLION)
- TABLE 92. SPAIN GLASS FIBER REINFORCED PLASTICS (GFRP) COMPOSITES MARKET, BY RESIN TYPE, 2022-2032 (KILOTON)
- TABLE 93. SPAIN GLASS FIBER REINFORCED PLASTICS (GFRP) COMPOSITES MARKET, BY PROCESS, 2022-2032 ($MILLION)
- TABLE 94. SPAIN GLASS FIBER REINFORCED PLASTICS (GFRP) COMPOSITES MARKET, BY PROCESS, 2022-2032 (KILOTON)
- TABLE 95. SPAIN GLASS FIBER REINFORCED PLASTICS (GFRP) COMPOSITES MARKET, BY END USE INDUSTRY, 2022-2032 ($MILLION)
- TABLE 96. SPAIN GLASS FIBER REINFORCED PLASTICS (GFRP) COMPOSITES MARKET, BY END USE INDUSTRY, 2022-2032 (KILOTON)
- TABLE 97. ITALY GLASS FIBER REINFORCED PLASTICS (GFRP) COMPOSITES MARKET, BY RESIN TYPE, 2022-2032 ($MILLION)
- TABLE 98. ITALY GLASS FIBER REINFORCED PLASTICS (GFRP) COMPOSITES MARKET, BY RESIN TYPE, 2022-2032 (KILOTON)
- TABLE 99. ITALY GLASS FIBER REINFORCED PLASTICS (GFRP) COMPOSITES MARKET, BY PROCESS, 2022-2032 ($MILLION)
- TABLE 100. ITALY GLASS FIBER REINFORCED PLASTICS (GFRP) COMPOSITES MARKET, BY PROCESS, 2022-2032 (KILOTON)
- TABLE 101. ITALY GLASS FIBER REINFORCED PLASTICS (GFRP) COMPOSITES MARKET, BY END USE INDUSTRY, 2022-2032 ($MILLION)
- TABLE 102. ITALY GLASS FIBER REINFORCED PLASTICS (GFRP) COMPOSITES MARKET, BY END USE INDUSTRY, 2022-2032 (KILOTON)
- TABLE 103. REST OF EUROPE GLASS FIBER REINFORCED PLASTICS (GFRP) COMPOSITES MARKET, BY RESIN TYPE, 2022-2032 ($MILLION)
- TABLE 104. REST OF EUROPE GLASS FIBER REINFORCED PLASTICS (GFRP) COMPOSITES MARKET, BY RESIN TYPE, 2022-2032 (KILOTON)
- TABLE 105. REST OF EUROPE GLASS FIBER REINFORCED PLASTICS (GFRP) COMPOSITES MARKET, BY PROCESS, 2022-2032 ($MILLION)
- TABLE 106. REST OF EUROPE GLASS FIBER REINFORCED PLASTICS (GFRP) COMPOSITES MARKET, BY PROCESS, 2022-2032 (KILOTON)
- TABLE 107. REST OF EUROPE GLASS FIBER REINFORCED PLASTICS (GFRP) COMPOSITES MARKET, BY END USE INDUSTRY, 2022-2032 ($MILLION)
- TABLE 108. REST OF EUROPE GLASS FIBER REINFORCED PLASTICS (GFRP) COMPOSITES MARKET, BY END USE INDUSTRY, 2022-2032 (KILOTON)
- TABLE 109. ASIA-PACIFIC GLASS FIBER REINFORCED PLASTICS (GFRP) COMPOSITES MARKET, BY RESIN TYPE, 2022-2032 ($MILLION)
- TABLE 110. ASIA-PACIFIC GLASS FIBER REINFORCED PLASTICS (GFRP) COMPOSITES MARKET, BY RESIN TYPE, 2022-2032 (KILOTON)
- TABLE 111. ASIA-PACIFIC GLASS FIBER REINFORCED PLASTICS (GFRP) COMPOSITES MARKET, BY PROCESS, 2022-2032 ($MILLION)
- TABLE 112. ASIA-PACIFIC GLASS FIBER REINFORCED PLASTICS (GFRP) COMPOSITES MARKET, BY PROCESS, 2022-2032 (KILOTON)
- TABLE 113. ASIA-PACIFIC GLASS FIBER REINFORCED PLASTICS (GFRP) COMPOSITES MARKET, BY END USE INDUSTRY, 2022-2032 ($MILLION)
- TABLE 114. ASIA-PACIFIC GLASS FIBER REINFORCED PLASTICS (GFRP) COMPOSITES MARKET, BY END USE INDUSTRY, 2022-2032 (KILOTON)
- TABLE 115. ASIA-PACIFIC GLASS FIBER REINFORCED PLASTICS (GFRP) COMPOSITES MARKET, BY COUNTRY, 2022-2032 ($MILLION)
- TABLE 116. ASIA-PACIFIC GLASS FIBER REINFORCED PLASTICS (GFRP) COMPOSITES MARKET, BY COUNTRY, 2022-2032 (KILOTON)
- TABLE 117. CHINA GLASS FIBER REINFORCED PLASTICS (GFRP) COMPOSITES MARKET, BY RESIN TYPE, 2022-2032 ($MILLION)
- TABLE 118. CHINA GLASS FIBER REINFORCED PLASTICS (GFRP) COMPOSITES MARKET, BY RESIN TYPE, 2022-2032 (KILOTON)
- TABLE 119. CHINA GLASS FIBER REINFORCED PLASTICS (GFRP) COMPOSITES MARKET, BY PROCESS, 2022-2032 ($MILLION)
- TABLE 120. CHINA GLASS FIBER REINFORCED PLASTICS (GFRP) COMPOSITES MARKET, BY PROCESS, 2022-2032 (KILOTON)
- TABLE 121. CHINA GLASS FIBER REINFORCED PLASTICS (GFRP) COMPOSITES MARKET, BY END USE INDUSTRY, 2022-2032 ($MILLION)
- TABLE 122. CHINA GLASS FIBER REINFORCED PLASTICS (GFRP) COMPOSITES MARKET, BY END USE INDUSTRY, 2022-2032 (KILOTON)
- TABLE 123. INDIA GLASS FIBER REINFORCED PLASTICS (GFRP) COMPOSITES MARKET, BY RESIN TYPE, 2022-2032 ($MILLION)
- TABLE 124. INDIA GLASS FIBER REINFORCED PLASTICS (GFRP) COMPOSITES MARKET, BY RESIN TYPE, 2022-2032 (KILOTON)
- TABLE 125. INDIA GLASS FIBER REINFORCED PLASTICS (GFRP) COMPOSITES MARKET, BY PROCESS, 2022-2032 ($MILLION)
- TABLE 126. INDIA GLASS FIBER REINFORCED PLASTICS (GFRP) COMPOSITES MARKET, BY PROCESS, 2022-2032 (KILOTON)
- TABLE 127. INDIA GLASS FIBER REINFORCED PLASTICS (GFRP) COMPOSITES MARKET, BY END USE INDUSTRY, 2022-2032 ($MILLION)
- TABLE 128. INDIA GLASS FIBER REINFORCED PLASTICS (GFRP) COMPOSITES MARKET, BY END USE INDUSTRY, 2022-2032 (KILOTON)
- TABLE 129. JAPAN GLASS FIBER REINFORCED PLASTICS (GFRP) COMPOSITES MARKET, BY RESIN TYPE, 2022-2032 ($MILLION)
- TABLE 130. JAPAN GLASS FIBER REINFORCED PLASTICS (GFRP) COMPOSITES MARKET, BY RESIN TYPE, 2022-2032 (KILOTON)
- TABLE 131. JAPAN GLASS FIBER REINFORCED PLASTICS (GFRP) COMPOSITES MARKET, BY PROCESS, 2022-2032 ($MILLION)
- TABLE 132. JAPAN GLASS FIBER REINFORCED PLASTICS (GFRP) COMPOSITES MARKET, BY PROCESS, 2022-2032 (KILOTON)
- TABLE 133. JAPAN GLASS FIBER REINFORCED PLASTICS (GFRP) COMPOSITES MARKET, BY END USE INDUSTRY, 2022-2032 ($MILLION)
- TABLE 134. JAPAN GLASS FIBER REINFORCED PLASTICS (GFRP) COMPOSITES MARKET, BY END USE INDUSTRY, 2022-2032 (KILOTON)
- TABLE 135. SOUTH KOREA GLASS FIBER REINFORCED PLASTICS (GFRP) COMPOSITES MARKET, BY RESIN TYPE, 2022-2032 ($MILLION)
- TABLE 136. SOUTH KOREA GLASS FIBER REINFORCED PLASTICS (GFRP) COMPOSITES MARKET, BY RESIN TYPE, 2022-2032 (KILOTON)
- TABLE 137. SOUTH KOREA GLASS FIBER REINFORCED PLASTICS (GFRP) COMPOSITES MARKET, BY PROCESS, 2022-2032 ($MILLION)
- TABLE 138. SOUTH KOREA GLASS FIBER REINFORCED PLASTICS (GFRP) COMPOSITES MARKET, BY PROCESS, 2022-2032 (KILOTON)
- TABLE 139. SOUTH KOREA GLASS FIBER REINFORCED PLASTICS (GFRP) COMPOSITES MARKET, BY END USE INDUSTRY, 2022-2032 ($MILLION)
- TABLE 140. SOUTH KOREA GLASS FIBER REINFORCED PLASTICS (GFRP) COMPOSITES MARKET, BY END USE INDUSTRY, 2022-2032 (KILOTON)
- TABLE 141. AUSTRALIA GLASS FIBER REINFORCED PLASTICS (GFRP) COMPOSITES MARKET, BY RESIN TYPE, 2022-2032 ($MILLION)
- TABLE 142. AUSTRALIA GLASS FIBER REINFORCED PLASTICS (GFRP) COMPOSITES MARKET, BY RESIN TYPE, 2022-2032 (KILOTON)
- TABLE 143. AUSTRALIA GLASS FIBER REINFORCED PLASTICS (GFRP) COMPOSITES MARKET, BY PROCESS, 2022-2032 ($MILLION)
- TABLE 144. AUSTRALIA GLASS FIBER REINFORCED PLASTICS (GFRP) COMPOSITES MARKET, BY PROCESS, 2022-2032 (KILOTON)
- TABLE 145. AUSTRALIA GLASS FIBER REINFORCED PLASTICS (GFRP) COMPOSITES MARKET, BY END USE INDUSTRY, 2022-2032 ($MILLION)
- TABLE 146. AUSTRALIA GLASS FIBER REINFORCED PLASTICS (GFRP) COMPOSITES MARKET, BY END USE INDUSTRY, 2022-2032 (KILOTON)
- TABLE 147. REST OF ASIA-PACIFIC GLASS FIBER REINFORCED PLASTICS (GFRP) COMPOSITES MARKET, BY RESIN TYPE, 2022-2032 ($MILLION)
- TABLE 148. REST OF ASIA-PACIFIC GLASS FIBER REINFORCED PLASTICS (GFRP) COMPOSITES MARKET, BY RESIN TYPE, 2022-2032 (KILOTON)
- TABLE 149. REST OF ASIA-PACIFIC GLASS FIBER REINFORCED PLASTICS (GFRP) COMPOSITES MARKET, BY PROCESS, 2022-2032 ($MILLION)
- TABLE 150. REST OF ASIA-PACIFIC GLASS FIBER REINFORCED PLASTICS (GFRP) COMPOSITES MARKET, BY PROCESS, 2022-2032 (KILOTON)
- TABLE 151. REST OF ASIA-PACIFIC GLASS FIBER REINFORCED PLASTICS (GFRP) COMPOSITES MARKET, BY END USE INDUSTRY, 2022-2032 ($MILLION)
- TABLE 152. REST OF ASIA-PACIFIC GLASS FIBER REINFORCED PLASTICS (GFRP) COMPOSITES MARKET, BY END USE INDUSTRY, 2022-2032 (KILOTON)
- TABLE 153. LAMEA GLASS FIBER REINFORCED PLASTICS (GFRP) COMPOSITES MARKET, BY RESIN TYPE, 2022-2032 ($MILLION)
- TABLE 154. LAMEA GLASS FIBER REINFORCED PLASTICS (GFRP) COMPOSITES MARKET, BY RESIN TYPE, 2022-2032 (KILOTON)
- TABLE 155. LAMEA GLASS FIBER REINFORCED PLASTICS (GFRP) COMPOSITES MARKET, BY PROCESS, 2022-2032 ($MILLION)
- TABLE 156. LAMEA GLASS FIBER REINFORCED PLASTICS (GFRP) COMPOSITES MARKET, BY PROCESS, 2022-2032 (KILOTON)
- TABLE 157. LAMEA GLASS FIBER REINFORCED PLASTICS (GFRP) COMPOSITES MARKET, BY END USE INDUSTRY, 2022-2032 ($MILLION)
- TABLE 158. LAMEA GLASS FIBER REINFORCED PLASTICS (GFRP) COMPOSITES MARKET, BY END USE INDUSTRY, 2022-2032 (KILOTON)
- TABLE 159. LAMEA GLASS FIBER REINFORCED PLASTICS (GFRP) COMPOSITES MARKET, BY COUNTRY, 2022-2032 ($MILLION)
- TABLE 160. LAMEA GLASS FIBER REINFORCED PLASTICS (GFRP) COMPOSITES MARKET, BY COUNTRY, 2022-2032 (KILOTON)
- TABLE 161. BRAZIL GLASS FIBER REINFORCED PLASTICS (GFRP) COMPOSITES MARKET, BY RESIN TYPE, 2022-2032 ($MILLION)
- TABLE 162. BRAZIL GLASS FIBER REINFORCED PLASTICS (GFRP) COMPOSITES MARKET, BY RESIN TYPE, 2022-2032 (KILOTON)
- TABLE 163. BRAZIL GLASS FIBER REINFORCED PLASTICS (GFRP) COMPOSITES MARKET, BY PROCESS, 2022-2032 ($MILLION)
- TABLE 164. BRAZIL GLASS FIBER REINFORCED PLASTICS (GFRP) COMPOSITES MARKET, BY PROCESS, 2022-2032 (KILOTON)
- TABLE 165. BRAZIL GLASS FIBER REINFORCED PLASTICS (GFRP) COMPOSITES MARKET, BY END USE INDUSTRY, 2022-2032 ($MILLION)
- TABLE 166. BRAZIL GLASS FIBER REINFORCED PLASTICS (GFRP) COMPOSITES MARKET, BY END USE INDUSTRY, 2022-2032 (KILOTON)
- TABLE 167. SAUDI ARABIA GLASS FIBER REINFORCED PLASTICS (GFRP) COMPOSITES MARKET, BY RESIN TYPE, 2022-2032 ($MILLION)
- TABLE 168. SAUDI ARABIA GLASS FIBER REINFORCED PLASTICS (GFRP) COMPOSITES MARKET, BY RESIN TYPE, 2022-2032 (KILOTON)
- TABLE 169. SAUDI ARABIA GLASS FIBER REINFORCED PLASTICS (GFRP) COMPOSITES MARKET, BY PROCESS, 2022-2032 ($MILLION)
- TABLE 170. SAUDI ARABIA GLASS FIBER REINFORCED PLASTICS (GFRP) COMPOSITES MARKET, BY PROCESS, 2022-2032 (KILOTON)
- TABLE 171. SAUDI ARABIA GLASS FIBER REINFORCED PLASTICS (GFRP) COMPOSITES MARKET, BY END USE INDUSTRY, 2022-2032 ($MILLION)
- TABLE 172. SAUDI ARABIA GLASS FIBER REINFORCED PLASTICS (GFRP) COMPOSITES MARKET, BY END USE INDUSTRY, 2022-2032 (KILOTON)
- TABLE 173. SOUTH AFRICA GLASS FIBER REINFORCED PLASTICS (GFRP) COMPOSITES MARKET, BY RESIN TYPE, 2022-2032 ($MILLION)
- TABLE 174. SOUTH AFRICA GLASS FIBER REINFORCED PLASTICS (GFRP) COMPOSITES MARKET, BY RESIN TYPE, 2022-2032 (KILOTON)
- TABLE 175. SOUTH AFRICA GLASS FIBER REINFORCED PLASTICS (GFRP) COMPOSITES MARKET, BY PROCESS, 2022-2032 ($MILLION)
- TABLE 176. SOUTH AFRICA GLASS FIBER REINFORCED PLASTICS (GFRP) COMPOSITES MARKET, BY PROCESS, 2022-2032 (KILOTON)
- TABLE 177. SOUTH AFRICA GLASS FIBER REINFORCED PLASTICS (GFRP) COMPOSITES MARKET, BY END USE INDUSTRY, 2022-2032 ($MILLION)
- TABLE 178. SOUTH AFRICA GLASS FIBER REINFORCED PLASTICS (GFRP) COMPOSITES MARKET, BY END USE INDUSTRY, 2022-2032 (KILOTON)
- TABLE 179. REST OF LAMEA GLASS FIBER REINFORCED PLASTICS (GFRP) COMPOSITES MARKET, BY RESIN TYPE, 2022-2032 ($MILLION)
- TABLE 180. REST OF LAMEA GLASS FIBER REINFORCED PLASTICS (GFRP) COMPOSITES MARKET, BY RESIN TYPE, 2022-2032 (KILOTON)
- TABLE 181. REST OF LAMEA GLASS FIBER REINFORCED PLASTICS (GFRP) COMPOSITES MARKET, BY PROCESS, 2022-2032 ($MILLION)
- TABLE 182. REST OF LAMEA GLASS FIBER REINFORCED PLASTICS (GFRP) COMPOSITES MARKET, BY PROCESS, 2022-2032 (KILOTON)
- TABLE 183. REST OF LAMEA GLASS FIBER REINFORCED PLASTICS (GFRP) COMPOSITES MARKET, BY END USE INDUSTRY, 2022-2032 ($MILLION)
- TABLE 184. REST OF LAMEA GLASS FIBER REINFORCED PLASTICS (GFRP) COMPOSITES MARKET, BY END USE INDUSTRY, 2022-2032 (KILOTON)
- TABLE 185. OWENS CORNING: KEY EXECUTIVES
- TABLE 186. OWENS CORNING: COMPANY SNAPSHOT
- TABLE 187. OWENS CORNING: PRODUCT SEGMENTS
- TABLE 188. OWENS CORNING: PRODUCT PORTFOLIO
- TABLE 189. OWENS CORNING: KEY STRATERGIES
- TABLE 190. JOHNS MANVILLE: KEY EXECUTIVES
- TABLE 191. JOHNS MANVILLE: COMPANY SNAPSHOT
- TABLE 192. JOHNS MANVILLE: PRODUCT SEGMENTS
- TABLE 193. JOHNS MANVILLE: PRODUCT PORTFOLIO
- TABLE 194. SANCOM COMPOSITES LLP: KEY EXECUTIVES
- TABLE 195. SANCOM COMPOSITES LLP: COMPANY SNAPSHOT
- TABLE 196. SANCOM COMPOSITES LLP: PRODUCT SEGMENTS
- TABLE 197. SANCOM COMPOSITES LLP: PRODUCT PORTFOLIO
- TABLE 198. ASAHI KASEI CORPORATION: KEY EXECUTIVES
- TABLE 199. ASAHI KASEI CORPORATION: COMPANY SNAPSHOT
- TABLE 200. ASAHI KASEI CORPORATION: PRODUCT SEGMENTS
- TABLE 201. ASAHI KASEI CORPORATION: PRODUCT PORTFOLIO
- TABLE 202. PPG INDUSTRIES, INC.: KEY EXECUTIVES
- TABLE 203. PPG INDUSTRIES, INC.: COMPANY SNAPSHOT
- TABLE 204. PPG INDUSTRIES, INC.: PRODUCT SEGMENTS
- TABLE 205. PPG INDUSTRIES, INC.: PRODUCT PORTFOLIO
- TABLE 206. 3B - THE FIBREGLASS COMPANY: KEY EXECUTIVES
- TABLE 207. 3B - THE FIBREGLASS COMPANY: COMPANY SNAPSHOT
- TABLE 208. 3B - THE FIBREGLASS COMPANY: PRODUCT SEGMENTS
- TABLE 209. 3B - THE FIBREGLASS COMPANY: PRODUCT PORTFOLIO
- TABLE 210. NIPPON SHEET GLASS CO., LTD: KEY EXECUTIVES
- TABLE 211. NIPPON SHEET GLASS CO., LTD: COMPANY SNAPSHOT
- TABLE 212. NIPPON SHEET GLASS CO., LTD: PRODUCT SEGMENTS
- TABLE 213. NIPPON SHEET GLASS CO., LTD: PRODUCT PORTFOLIO
- TABLE 214. NITTO BOSEKI CO., LTD.: KEY EXECUTIVES
- TABLE 215. NITTO BOSEKI CO., LTD.: COMPANY SNAPSHOT
- TABLE 216. NITTO BOSEKI CO., LTD.: PRODUCT SEGMENTS
- TABLE 217. NITTO BOSEKI CO., LTD.: PRODUCT PORTFOLIO
- TABLE 218. CELANESE CORPORATION: KEY EXECUTIVES
- TABLE 219. CELANESE CORPORATION: COMPANY SNAPSHOT
- TABLE 220. CELANESE CORPORATION: PRODUCT SEGMENTS
- TABLE 221. CELANESE CORPORATION: PRODUCT PORTFOLIO
- TABLE 222. MITSUBISHI CHEMICAL GROUP CORPORATION: KEY EXECUTIVES
- TABLE 223. MITSUBISHI CHEMICAL GROUP CORPORATION: COMPANY SNAPSHOT
- TABLE 224. MITSUBISHI CHEMICAL GROUP CORPORATION: PRODUCT SEGMENTS
- TABLE 225. MITSUBISHI CHEMICAL GROUP CORPORATION: PRODUCT PORTFOLIO
LIST OF FIGURES
- FIGURE 01. GLASS FIBER REINFORCED PLASTICS (GFRP) COMPOSITES MARKET, 2022-2032
- FIGURE 02. SEGMENTATION OF GLASS FIBER REINFORCED PLASTICS (GFRP) COMPOSITES MARKET,2022-2032
- FIGURE 03. TOP IMPACTING FACTORS IN GLASS FIBER REINFORCED PLASTICS (GFRP) COMPOSITES MARKET (2022 TO 2032)
- FIGURE 04. TOP INVESTMENT POCKETS IN GLASS FIBER REINFORCED PLASTICS (GFRP) COMPOSITES MARKET (2023-2032)
- FIGURE 05. MODERATE BARGAINING POWER OF SUPPLIERS
- FIGURE 06. LOW THREAT OF NEW ENTRANTS
- FIGURE 07. MODERATE THREAT OF SUBSTITUTES
- FIGURE 08. MODERATE INTENSITY OF RIVALRY
- FIGURE 09. HIGH BARGAINING POWER OF BUYERS
- FIGURE 10. GLOBAL GLASS FIBER REINFORCED PLASTICS (GFRP) COMPOSITES MARKET:DRIVERS, RESTRAINTS AND OPPORTUNITIES
- FIGURE 11. IMPACT OF KEY REGULATION: GLASS FIBER REINFORCED PLASTICS (GFRP) COMPOSITES MARKET
- FIGURE 12. PATENT ANALYSIS BY COMPANY
- FIGURE 13. PATENT ANALYSIS BY COUNTRY
- FIGURE 14. PRICING ANALYSIS: GLASS FIBER REINFORCED PLASTICS (GFRP) COMPOSITES MARKET 2022 AND 2032
- FIGURE 15. REGULATORY GUIDELINES: GLASS FIBER REINFORCED PLASTICS (GFRP) COMPOSITES MARKET
- FIGURE 16. GLASS FIBER REINFORCED PLASTICS (GFRP) COMPOSITES MARKET, BY RESIN TYPE, 2022 AND 2032(%)
- FIGURE 17. COMPARATIVE SHARE ANALYSIS OF GLASS FIBER REINFORCED PLASTICS (GFRP) COMPOSITES MARKET FOR POLYESTER RESIN, BY COUNTRY 2022 AND 2032(%)
- FIGURE 18. COMPARATIVE SHARE ANALYSIS OF GLASS FIBER REINFORCED PLASTICS (GFRP) COMPOSITES MARKET FOR VINYL ESTER RESIN, BY COUNTRY 2022 AND 2032(%)
- FIGURE 19. COMPARATIVE SHARE ANALYSIS OF GLASS FIBER REINFORCED PLASTICS (GFRP) COMPOSITES MARKET FOR EPOXY RESIN, BY COUNTRY 2022 AND 2032(%)
- FIGURE 20. COMPARATIVE SHARE ANALYSIS OF GLASS FIBER REINFORCED PLASTICS (GFRP) COMPOSITES MARKET FOR POLYURETHANE RESIN, BY COUNTRY 2022 AND 2032(%)
- FIGURE 21. COMPARATIVE SHARE ANALYSIS OF GLASS FIBER REINFORCED PLASTICS (GFRP) COMPOSITES MARKET FOR OTHERS, BY COUNTRY 2022 AND 2032(%)
- FIGURE 22. GLASS FIBER REINFORCED PLASTICS (GFRP) COMPOSITES MARKET, BY PROCESS, 2022 AND 2032(%)
- FIGURE 23. COMPARATIVE SHARE ANALYSIS OF GLASS FIBER REINFORCED PLASTICS (GFRP) COMPOSITES MARKET FOR MANUAL PROCESS, BY COUNTRY 2022 AND 2032(%)
- FIGURE 24. COMPARATIVE SHARE ANALYSIS OF GLASS FIBER REINFORCED PLASTICS (GFRP) COMPOSITES MARKET FOR CONTINUOUS PROCESS, BY COUNTRY 2022 AND 2032(%)
- FIGURE 25. COMPARATIVE SHARE ANALYSIS OF GLASS FIBER REINFORCED PLASTICS (GFRP) COMPOSITES MARKET FOR COMPRESSION MOLDING, BY COUNTRY 2022 AND 2032(%)
- FIGURE 26. COMPARATIVE SHARE ANALYSIS OF GLASS FIBER REINFORCED PLASTICS (GFRP) COMPOSITES MARKET FOR INJECTION MOLDING, BY COUNTRY 2022 AND 2032(%)
- FIGURE 27. GLASS FIBER REINFORCED PLASTICS (GFRP) COMPOSITES MARKET, BY END USE INDUSTRY, 2022 AND 2032(%)
- FIGURE 28. COMPARATIVE SHARE ANALYSIS OF GLASS FIBER REINFORCED PLASTICS (GFRP) COMPOSITES MARKET FOR AEROSPACE AND DEFENSE, BY COUNTRY 2022 AND 2032(%)
- FIGURE 29. COMPARATIVE SHARE ANALYSIS OF GLASS FIBER REINFORCED PLASTICS (GFRP) COMPOSITES MARKET FOR CONSTRUCTION, BY COUNTRY 2022 AND 2032(%)
- FIGURE 30. COMPARATIVE SHARE ANALYSIS OF GLASS FIBER REINFORCED PLASTICS (GFRP) COMPOSITES MARKET FOR WIND ENERGY, BY COUNTRY 2022 AND 2032(%)
- FIGURE 31. COMPARATIVE SHARE ANALYSIS OF GLASS FIBER REINFORCED PLASTICS (GFRP) COMPOSITES MARKET FOR AUTOMOTIVE, BY COUNTRY 2022 AND 2032(%)
- FIGURE 32. COMPARATIVE SHARE ANALYSIS OF GLASS FIBER REINFORCED PLASTICS (GFRP) COMPOSITES MARKET FOR ELECTRICAL AND ELECTRONICS, BY COUNTRY 2022 AND 2032(%)
- FIGURE 33. COMPARATIVE SHARE ANALYSIS OF GLASS FIBER REINFORCED PLASTICS (GFRP) COMPOSITES MARKET FOR OTHERS, BY COUNTRY 2022 AND 2032(%)
- FIGURE 34. GLASS FIBER REINFORCED PLASTICS (GFRP) COMPOSITES MARKET BY REGION, 2022 AND 2032(%)
- FIGURE 35. U.S. GLASS FIBER REINFORCED PLASTICS (GFRP) COMPOSITES MARKET, 2022-2032 ($MILLION)
- FIGURE 36. CANADA GLASS FIBER REINFORCED PLASTICS (GFRP) COMPOSITES MARKET, 2022-2032 ($MILLION)
- FIGURE 37. MEXICO GLASS FIBER REINFORCED PLASTICS (GFRP) COMPOSITES MARKET, 2022-2032 ($MILLION)
- FIGURE 38. GERMANY GLASS FIBER REINFORCED PLASTICS (GFRP) COMPOSITES MARKET, 2022-2032 ($MILLION)
- FIGURE 39. UK GLASS FIBER REINFORCED PLASTICS (GFRP) COMPOSITES MARKET, 2022-2032 ($MILLION)
- FIGURE 40. FRANCE GLASS FIBER REINFORCED PLASTICS (GFRP) COMPOSITES MARKET, 2022-2032 ($MILLION)
- FIGURE 41. SPAIN GLASS FIBER REINFORCED PLASTICS (GFRP) COMPOSITES MARKET, 2022-2032 ($MILLION)
- FIGURE 42. ITALY GLASS FIBER REINFORCED PLASTICS (GFRP) COMPOSITES MARKET, 2022-2032 ($MILLION)
- FIGURE 43. REST OF EUROPE GLASS FIBER REINFORCED PLASTICS (GFRP) COMPOSITES MARKET, 2022-2032 ($MILLION)
- FIGURE 44. CHINA GLASS FIBER REINFORCED PLASTICS (GFRP) COMPOSITES MARKET, 2022-2032 ($MILLION)
- FIGURE 45. INDIA GLASS FIBER REINFORCED PLASTICS (GFRP) COMPOSITES MARKET, 2022-2032 ($MILLION)
- FIGURE 46. JAPAN GLASS FIBER REINFORCED PLASTICS (GFRP) COMPOSITES MARKET, 2022-2032 ($MILLION)
- FIGURE 47. SOUTH KOREA GLASS FIBER REINFORCED PLASTICS (GFRP) COMPOSITES MARKET, 2022-2032 ($MILLION)
- FIGURE 48. AUSTRALIA GLASS FIBER REINFORCED PLASTICS (GFRP) COMPOSITES MARKET, 2022-2032 ($MILLION)
- FIGURE 49. REST OF ASIA-PACIFIC GLASS FIBER REINFORCED PLASTICS (GFRP) COMPOSITES MARKET, 2022-2032 ($MILLION)
- FIGURE 50. BRAZIL GLASS FIBER REINFORCED PLASTICS (GFRP) COMPOSITES MARKET, 2022-2032 ($MILLION)
- FIGURE 51. SAUDI ARABIA GLASS FIBER REINFORCED PLASTICS (GFRP) COMPOSITES MARKET, 2022-2032 ($MILLION)
- FIGURE 52. SOUTH AFRICA GLASS FIBER REINFORCED PLASTICS (GFRP) COMPOSITES MARKET, 2022-2032 ($MILLION)
- FIGURE 53. REST OF LAMEA GLASS FIBER REINFORCED PLASTICS (GFRP) COMPOSITES MARKET, 2022-2032 ($MILLION)
- FIGURE 54. TOP WINNING STRATEGIES, BY YEAR (2022)
- FIGURE 55. TOP WINNING STRATEGIES, BY DEVELOPMENT (2022)
- FIGURE 56. TOP WINNING STRATEGIES, BY COMPANY (2022)
- FIGURE 57. PRODUCT MAPPING OF TOP 10 PLAYERS
- FIGURE 58. COMPETITIVE DASHBOARD
- FIGURE 59. COMPETITIVE HEATMAP: GLASS FIBER REINFORCED PLASTICS (GFRP) COMPOSITES MARKET
- FIGURE 60. TOP PLAYER POSITIONING, 2022
- FIGURE 61. OWENS CORNING: NET SALES, 2020-2022 ($MILLION)
- FIGURE 62. OWENS CORNING: REVENUE SHARE BY SEGMENT, 2022 (%)
- FIGURE 63. OWENS CORNING: REVENUE SHARE BY REGION, 2022 (%)
- FIGURE 64. ASAHI KASEI CORPORATION: NET SALES, 2020-2022 ($MILLION)
- FIGURE 65. ASAHI KASEI CORPORATION: REVENUE SHARE BY SEGMENT, 2022 (%)
- FIGURE 66. ASAHI KASEI CORPORATION: REVENUE SHARE BY REGION, 2022 (%)
- FIGURE 67. PPG INDUSTRIES, INC.: NET SALES, 2020-2022 ($MILLION)
- FIGURE 68. PPG INDUSTRIES, INC.: RESEARCH & DEVELOPMENT EXPENDITURE, 2020-2022 ($MILLION)
- FIGURE 69. PPG INDUSTRIES, INC.: REVENUE SHARE BY SEGMENT, 2022 (%)
- FIGURE 70. PPG INDUSTRIES, INC.: REVENUE SHARE BY REGION, 2022 (%)
- FIGURE 71. NIPPON SHEET GLASS CO., LTD: NET SALES, 2020-2022 ($MILLION)
- FIGURE 72. NIPPON SHEET GLASS CO., LTD: RESEARCH & DEVELOPMENT EXPENDITURE, 2020-2022 ($MILLION)
- FIGURE 73. NIPPON SHEET GLASS CO., LTD: REVENUE SHARE BY SEGMENT, 2022 (%)
- FIGURE 74. NIPPON SHEET GLASS CO., LTD: REVENUE SHARE BY REGION, 2022 (%)
- FIGURE 75. NITTO BOSEKI CO., LTD.: NET SALES, 2020-2022 ($MILLION)
- FIGURE 76. NITTO BOSEKI CO., LTD.: REVENUE SHARE BY SEGMENT, 2022 (%)
- FIGURE 77. NITTO BOSEKI CO., LTD.: REVENUE SHARE BY REGION, 2022 (%)
- FIGURE 78. CELANESE CORPORATION: NET REVENUE, 2020-2022 ($MILLION)
- FIGURE 79. CELANESE CORPORATION: REVENUE SHARE BY SEGMENT, 2022 (%)
- FIGURE 80. CELANESE CORPORATION: REVENUE SHARE BY REGION, 2022 (%)
- FIGURE 81. MITSUBISHI CHEMICAL GROUP CORPORATION: NET REVENUE, 2020-2022 ($MILLION)
- FIGURE 82. MITSUBISHI CHEMICAL GROUP CORPORATION: REVENUE SHARE BY SEGMENT, 2022 (%)
 2023-2028 年 GF 和 GFRP 複合材料市場報告(按類型(通用玻璃纖維、專用玻璃纖維)、應用(建築、電子、交通等)和地區)
 玻璃纖維PCB層壓板市場:趨勢,機會,競爭分析【2023-2028年】
 玻璃纖維強化塑膠(GFRP)的全球市場:趨勢,機會,競爭分析(2023年~2028年)
 GFRP複合材料的全球市場
 玻璃纖維強化塑膠 (GFRP) 的全球市場:2016-2032年
 GF(玻璃纖維)、GFRP(玻璃纖維強化塑膠)複合材料的全球市場:2022年
 玻璃纖維強化塑膠(GFRP)複合材料的全球市場:聚酯樹脂持續是最廣泛使用的原料
 全球玻璃纖維增強熱塑性塑料市場、性能和預測(2017-2028)