


 |
市場調查報告書
商品編碼
1414902
國防安全保障市場:按類型、最終用戶、技術分類:全球機會分析和產業預測,2023-2032 年Homeland Security Market By Type, By End User, By Technology : Global Opportunity Analysis and Industry Forecast, 2023-2032 |
||||||
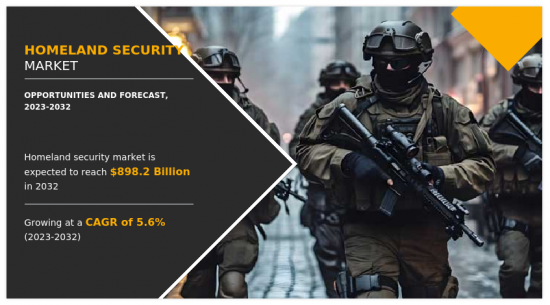
國防安全保障市場是由政府努力保護國家免受跨境衝突和內戰、全球恐怖主義增加、網路犯罪、跨境入侵、監視和生物安全造成的安全威脅增加所推動的。國土安全市場可能會出現顯著成長由於生物識別、成像系統等方面的技術進步,2023 年至 2032 年成長率為 5.6%。
歐洲是世界國防安全保障產業的關鍵地區之一,法國、德國和英國等西歐國家優先加強關鍵基礎設施,特別是在金融服務、能源分配和公共交通領域。主導的。英國正在部署先進的人工智慧CCTV視覺分析網路來監控人群行為,而法國和德國正在加強對敏感設施和初期應變人員動員平台的存取控制。
此外,歐洲國家正在與技術解決方案提供者合作,以進一步提高國家安全。例如,2022年2月,空中巴士歐洲公司與聯合武器合作組織(OCCAR)簽署了Eurodrone全球合約。該合約涵蓋 20 個系統的開發和製造,以及為期五年的初始營運支援。 OCCAR代表德國、法國、義大利和西班牙這四個發射國簽署了該協議。 Eurodrone 是一種中高度增程增程 (MALE) 遙控飛機系統 (RPAS),專為情報、監視、目標捕獲和偵察 (ISTAR) 任務和國防安全保障行動而設計。
目錄
第1章簡介
第 2 章執行摘要
第3章市場概況
- 市場定義和範圍
- 主要發現
- 影響因素
- 主要投資機會
- 波特五力分析
- 市場動態
- 促進因素
- 政府努力保護國家免受跨境衝突和內戰的影響
- 由於全球恐怖主義、網路犯罪和跨境入侵的增加,安全威脅日益增加
- 監視、生物識別和成像系統的技術進步
- 抑制因素
- 隱私問題、與廣泛監視相關的道德問題是社會接受的障礙
- 未實施必要措施 延遲實施安全解決方案
- 機會
- 資訊安全需求快速成長
- 智慧城市理念進展
- 促進因素
第 4 章國防安全保障市場:按類型
- 概述
- 邊防安全
- 航空安全
- 海上安全
- 關鍵基礎設施安全
- 網路安全
- 大眾運輸安全
- 執法
- 化生核安全
- 其他
第5章國防安全保障市場:依最終用戶分類
- 概述
- 公共部門
- 私部門
第6章國防安全保障市場:依技術分類
- 概述
- 識別/監控系統
- 基於人工智慧的解決方案
- 安全平台
- 其他
第7章國防安全保障市場:依地區
- 概述
- 北美洲
- 美國
- 加拿大
- 墨西哥
- 歐洲
- 英國
- 德國
- 法國
- 俄羅斯
- 其他
- 亞太地區
- 中國
- 日本
- 印度
- 韓國
- 其他
- 拉丁美洲
- 拉丁美洲
- 中東
- 非洲
第8章 競爭形勢
- 介紹
- 關鍵成功策略
- 10家主要企業產品圖譜
- 競爭對手儀表板
- 競爭熱圖
- 2022年主要企業定位
第9章 公司簡介
- General Dynamics Corporation
- International Business Machines Corporation
- L3Harris Technologies, Inc.
- Leonardo SpA
- Lockheed Martin Corporation
- Northrop Grumman Corporation.
- Science Applications International Corporation(SAIC)
- Thales Group
- Unisys Corporation
- ELBIT SYSTEMS LTD.
The Homeland security market is likely to experience a significant growth rate of 5.6% from 2023-2032 owing to as government initiatives to protect nation from cross border disputes and civil wars, rise in security threats from increasing terrorism, cybercrimes, cross-border infiltration incidents globally, and technological advancements in surveillance, biometric identification, imaging systems- Allied Market Research
Europe is one of the major regions of the global homeland security industry, dominated by Western European countries like France, Germany and the UK which are prioritizing critical infrastructure hardening initiatives particularly across the financial services, energy distribution and mass transportation sectors. The UK has implemented sophisticated CCTV visual analytics networks leveraging AI for crowd behavioral monitoring while France and Germany are tightening sensitive facilities access controls and first responder mobilization platforms.
Moreover, European countries have collaborated with technology solutions providers to further improve national security. For instance, in February 2022, Europe Airbus and the Organization for Joint Armament Co-operation (OCCAR) signed the Eurodrone global contract. This contract covers the development and manufacturing of 20 systems and five years of initial in-service support. OCCAR signed the contract on behalf of the four launch nations Germany, France, Italy, and Spain. Eurodrone is a Medium Altitude Long Endurance (MALE) Remotely Piloted Aircraft System (RPAS) designed for Intelligence, Surveillance, Target Acquisition, and Reconnaissance (ISTAR) missions and homeland security operations.
In addition, in July 2022, the European Public Prosecutor's Office (EPPO) signed a working arrangement with the U.S. Department of Justice and the U.S. Department of Homeland Security. This agreement, signed on aims to facilitate cooperation in investigations and prosecutions related to criminal offenses falling within their respective jurisdictions and competences. Therefore, many initiatives and investments by European governments support the market growth in the region. European countries, including the UK, France, and Germany, prioritize homeland security with measures like AI-based crowd monitoring and facility access controls. Collaborations with tech firms, such as
1) Airbus, and international agreements, like the one with the U.S., demonstrate a commitment to enhancing national security and driving market growth.
Moreover, the Japan Network Security Association (JNSA) in Japan, the Homeland Security Information Network (HSIN) in the U.S., and the Information Security Research Association (ISRA), a global association for information security research, are some examples of nations that have departments and ministries dedicated to information security as part of their homeland security efforts.
Therefore, as agencies prioritize budget allocations towards shoring information infrastructure security gaps institution-wide, a lucrative long term modernization opportunities pathway emerges for cybersecurity partners supporting necessary transformation. There is apprehension regarding unregulated government tracking of innocent civilians without reasonable cause or obtaining proper consent. Suspicions persist around potential misuse of captured information for purposes beyond just public safety like targeted advertising or suppression of political dissenters.
In addition, many governments are adopting AI technologies to improve the accuracy of security systems. For instance, in September 2023, the U.S. Department of Homeland Security (DHS) revealed new policies concerning the utilization and procurement of artificial intelligence (AI) technologies, which focus on facial recognition and face capture technologies. These policies establish guidelines for the department's exploration of leveraging AI to enhance critical missions and developing defenses against potential malicious uses of AI by adversaries. Such developments are expected to propel the growth of the market.
The homeland security market is segmented on the basis of type, end-user, technology, and region. Based on the type of homeland security, the market is segmented into border security, aviation security, maritime security, critical infrastructure security, cyber security, mass transport security, law enforcement, CBRN security, and others. On the basis of end-user, the market is categorized into public sector and private sector. In terms of technology, the homeland security market has been segmented into recognition and surveillance systems, AI-based solutions, security platforms, and others. Region wise, the market is analyzed across North America, Europe, Asia-Pacific, and LAMEA.
The key players profiled in the global homeland security market include IBM Corporation, Lockheed Martin Corporation, General Dynamics Corporation, Northrop Grumman Corporation, L3Harris Technologies, Inc., Unisys Corporation, Elbit Systems Ltd., and Science Applications International Corporation (SAIC).
Key Benefits For Stakeholders
- This report provides a quantitative analysis of the market segments, current trends, estimations, and dynamics of the homeland security market analysis from 2022 to 2032 to identify the prevailing homeland security market opportunities.
- The market research is offered along with information related to key drivers, restraints, and opportunities.
- Porter's five forces analysis highlights the potency of buyers and suppliers to enable stakeholders make profit-oriented business decisions and strengthen their supplier-buyer network.
- In-depth analysis of the homeland security market segmentation assists to determine the prevailing market opportunities.
- Major countries in each region are mapped according to their revenue contribution to the global market.
- Market player positioning facilitates benchmarking and provides a clear understanding of the present position of the market players.
- The report includes the analysis of the regional as well as global homeland security market trends, key players, market segments, application areas, and market growth strategies.
Additional benefits you will get with this purchase are:
- Quarterly Update and* (only available with a corporate license, on listed price)
- 5 additional Company Profile of client Choice pre- or Post-purchase, as a free update.
- Free Upcoming Version on the Purchase of Five and Enterprise User License.
- 16 analyst hours of support* (post-purchase, if you find additional data requirements upon review of the report, you may receive support amounting to 16 analyst hours to solve questions, and post-sale queries)
- 15% Free Customization* (in case the scope or segment of the report does not match your requirements, 15% is equivalent to 3 working days of free work, applicable once)
- Free data Pack on the Five and Enterprise User License. (Excel version of the report)
- Free Updated report if the report is 6-12 months old or older.
- 24-hour priority response*
- Free Industry updates and white papers.
Possible Customization with this report (with additional cost and timeline, please talk to the sales executive to know more)
- Additional company profiles with specific to client's interest
- Additional country or region analysis- market size and forecast
- Expanded list for Company Profiles
- SWOT Analysis
Key Market Segments
By Type
- Border Security
- Aviation Security
- Maritime Security
- Critical Infrastructure Security
- Cyber Security
- Mass Transport Security
- Law Enforcement
- CBRN Security
- Others
By End User
- Public Sector
- Private Sector
By Technology
- Recognition and Surveillance Systems
- AI-based Solutions
- Security Platforms
- Others
By Region
- North America
- U.S.
- Canada
- Mexico
- Europe
- UK
- Germany
- France
- Russia
- Rest of Europe
- Asia-Pacific
- China
- Japan
- India
- South Korea
- Rest of Asia-Pacific
- LAMEA
- Latin America
- Middle East
- Africa
Key Market Players:
- General Dynamics Corporation
- L3Harris Technologies, Inc.
- Leonardo S.p.A.
- Northrop Grumman Corporation.
- Thales Group
- Unisys Corporation
- International Business Machines Corporation
- Lockheed Martin Corporation
- Science Applications International Corporation (SAIC)
- ELBIT SYSTEMS LTD.
TABLE OF CONTENTS
CHAPTER 1: INTRODUCTION
- 1.1. Report description
- 1.2. Key market segments
- 1.3. Key benefits to the stakeholders
- 1.4. Research methodology
- 1.4.1. Primary research
- 1.4.2. Secondary research
- 1.4.3. Analyst tools and models
CHAPTER 2: EXECUTIVE SUMMARY
- 2.1. CXO Perspective
CHAPTER 3: MARKET OVERVIEW
- 3.1. Market definition and scope
- 3.2. Key findings
- 3.2.1. Top impacting factors
- 3.2.2. Top investment pockets
- 3.3. Porter's five forces analysis
- 3.3.1. High bargaining power of suppliers
- 3.3.2. Low threat of new entrants
- 3.3.3. Low threat of substitutes
- 3.3.4. Low intensity of rivalry
- 3.3.5. Low bargaining power of buyers
- 3.4. Market dynamics
- 3.4.1. Drivers
- 3.4.1.1. Government initiatives to protect nation from cross border disputes and civil wars
- 3.4.1.2. Rise in security threats from increasing terrorism, cybercrimes, cross-border infiltration incidents globally
- 3.4.1.3. Technological advancements in surveillance, biometric identification, imaging systems
- 3.4.2. Restraints
- 3.4.2.1. Privacy issues, ethical concerns related to pervasive monitoring posing public acceptance barriers
- 3.4.2.2. Lack of implementation of required measures and slow adoption of security solutions
- 3.4.3. Opportunities
- 3.4.3.1. Surge in demand for information security
- 3.4.3.2. The development of smart city initiatives
- 3.4.1. Drivers
CHAPTER 4: HOMELAND SECURITY MARKET, BY TYPE
- 4.1. Overview
- 4.1.1. Market size and forecast
- 4.2. Border Security
- 4.2.1. Key market trends, growth factors and opportunities
- 4.2.2. Market size and forecast, by region
- 4.2.3. Market share analysis by country
- 4.3. Aviation Security
- 4.3.1. Key market trends, growth factors and opportunities
- 4.3.2. Market size and forecast, by region
- 4.3.3. Market share analysis by country
- 4.4. Maritime Security
- 4.4.1. Key market trends, growth factors and opportunities
- 4.4.2. Market size and forecast, by region
- 4.4.3. Market share analysis by country
- 4.5. Critical Infrastructure Security
- 4.5.1. Key market trends, growth factors and opportunities
- 4.5.2. Market size and forecast, by region
- 4.5.3. Market share analysis by country
- 4.6. Cyber Security
- 4.6.1. Key market trends, growth factors and opportunities
- 4.6.2. Market size and forecast, by region
- 4.6.3. Market share analysis by country
- 4.7. Mass Transport Security
- 4.7.1. Key market trends, growth factors and opportunities
- 4.7.2. Market size and forecast, by region
- 4.7.3. Market share analysis by country
- 4.8. Law Enforcement
- 4.8.1. Key market trends, growth factors and opportunities
- 4.8.2. Market size and forecast, by region
- 4.8.3. Market share analysis by country
- 4.9. CBRN Security
- 4.9.1. Key market trends, growth factors and opportunities
- 4.9.2. Market size and forecast, by region
- 4.9.3. Market share analysis by country
- 4.10. Others
- 4.10.1. Key market trends, growth factors and opportunities
- 4.10.2. Market size and forecast, by region
- 4.10.3. Market share analysis by country
CHAPTER 5: HOMELAND SECURITY MARKET, BY END USER
- 5.1. Overview
- 5.1.1. Market size and forecast
- 5.2. Public Sector
- 5.2.1. Key market trends, growth factors and opportunities
- 5.2.2. Market size and forecast, by region
- 5.2.3. Market share analysis by country
- 5.3. Private Sector
- 5.3.1. Key market trends, growth factors and opportunities
- 5.3.2. Market size and forecast, by region
- 5.3.3. Market share analysis by country
CHAPTER 6: HOMELAND SECURITY MARKET, BY TECHNOLOGY
- 6.1. Overview
- 6.1.1. Market size and forecast
- 6.2. Recognition and Surveillance Systems
- 6.2.1. Key market trends, growth factors and opportunities
- 6.2.2. Market size and forecast, by region
- 6.2.3. Market share analysis by country
- 6.3. AI-based Solutions
- 6.3.1. Key market trends, growth factors and opportunities
- 6.3.2. Market size and forecast, by region
- 6.3.3. Market share analysis by country
- 6.4. Security Platforms
- 6.4.1. Key market trends, growth factors and opportunities
- 6.4.2. Market size and forecast, by region
- 6.4.3. Market share analysis by country
- 6.5. Others
- 6.5.1. Key market trends, growth factors and opportunities
- 6.5.2. Market size and forecast, by region
- 6.5.3. Market share analysis by country
CHAPTER 7: HOMELAND SECURITY MARKET, BY REGION
- 7.1. Overview
- 7.1.1. Market size and forecast By Region
- 7.2. North America
- 7.2.1. Key market trends, growth factors and opportunities
- 7.2.2. Market size and forecast, by Type
- 7.2.3. Market size and forecast, by End User
- 7.2.4. Market size and forecast, by Technology
- 7.2.5. Market size and forecast, by country
- 7.2.5.1. U.S.
- 7.2.5.1.1. Market size and forecast, by Type
- 7.2.5.1.2. Market size and forecast, by End User
- 7.2.5.1.3. Market size and forecast, by Technology
- 7.2.5.2. Canada
- 7.2.5.2.1. Market size and forecast, by Type
- 7.2.5.2.2. Market size and forecast, by End User
- 7.2.5.2.3. Market size and forecast, by Technology
- 7.2.5.3. Mexico
- 7.2.5.3.1. Market size and forecast, by Type
- 7.2.5.3.2. Market size and forecast, by End User
- 7.2.5.3.3. Market size and forecast, by Technology
- 7.3. Europe
- 7.3.1. Key market trends, growth factors and opportunities
- 7.3.2. Market size and forecast, by Type
- 7.3.3. Market size and forecast, by End User
- 7.3.4. Market size and forecast, by Technology
- 7.3.5. Market size and forecast, by country
- 7.3.5.1. UK
- 7.3.5.1.1. Market size and forecast, by Type
- 7.3.5.1.2. Market size and forecast, by End User
- 7.3.5.1.3. Market size and forecast, by Technology
- 7.3.5.2. Germany
- 7.3.5.2.1. Market size and forecast, by Type
- 7.3.5.2.2. Market size and forecast, by End User
- 7.3.5.2.3. Market size and forecast, by Technology
- 7.3.5.3. France
- 7.3.5.3.1. Market size and forecast, by Type
- 7.3.5.3.2. Market size and forecast, by End User
- 7.3.5.3.3. Market size and forecast, by Technology
- 7.3.5.4. Russia
- 7.3.5.4.1. Market size and forecast, by Type
- 7.3.5.4.2. Market size and forecast, by End User
- 7.3.5.4.3. Market size and forecast, by Technology
- 7.3.5.5. Rest of Europe
- 7.3.5.5.1. Market size and forecast, by Type
- 7.3.5.5.2. Market size and forecast, by End User
- 7.3.5.5.3. Market size and forecast, by Technology
- 7.4. Asia-Pacific
- 7.4.1. Key market trends, growth factors and opportunities
- 7.4.2. Market size and forecast, by Type
- 7.4.3. Market size and forecast, by End User
- 7.4.4. Market size and forecast, by Technology
- 7.4.5. Market size and forecast, by country
- 7.4.5.1. China
- 7.4.5.1.1. Market size and forecast, by Type
- 7.4.5.1.2. Market size and forecast, by End User
- 7.4.5.1.3. Market size and forecast, by Technology
- 7.4.5.2. Japan
- 7.4.5.2.1. Market size and forecast, by Type
- 7.4.5.2.2. Market size and forecast, by End User
- 7.4.5.2.3. Market size and forecast, by Technology
- 7.4.5.3. India
- 7.4.5.3.1. Market size and forecast, by Type
- 7.4.5.3.2. Market size and forecast, by End User
- 7.4.5.3.3. Market size and forecast, by Technology
- 7.4.5.4. South Korea
- 7.4.5.4.1. Market size and forecast, by Type
- 7.4.5.4.2. Market size and forecast, by End User
- 7.4.5.4.3. Market size and forecast, by Technology
- 7.4.5.5. Rest of Asia-Pacific
- 7.4.5.5.1. Market size and forecast, by Type
- 7.4.5.5.2. Market size and forecast, by End User
- 7.4.5.5.3. Market size and forecast, by Technology
- 7.5. LAMEA
- 7.5.1. Key market trends, growth factors and opportunities
- 7.5.2. Market size and forecast, by Type
- 7.5.3. Market size and forecast, by End User
- 7.5.4. Market size and forecast, by Technology
- 7.5.5. Market size and forecast, by country
- 7.5.5.1. Latin America
- 7.5.5.1.1. Market size and forecast, by Type
- 7.5.5.1.2. Market size and forecast, by End User
- 7.5.5.1.3. Market size and forecast, by Technology
- 7.5.5.2. Middle East
- 7.5.5.2.1. Market size and forecast, by Type
- 7.5.5.2.2. Market size and forecast, by End User
- 7.5.5.2.3. Market size and forecast, by Technology
- 7.5.5.3. Africa
- 7.5.5.3.1. Market size and forecast, by Type
- 7.5.5.3.2. Market size and forecast, by End User
- 7.5.5.3.3. Market size and forecast, by Technology
CHAPTER 8: COMPETITIVE LANDSCAPE
- 8.1. Introduction
- 8.2. Top winning strategies
- 8.3. Product mapping of top 10 player
- 8.4. Competitive dashboard
- 8.5. Competitive heatmap
- 8.6. Top player positioning, 2022
CHAPTER 9: COMPANY PROFILES
- 9.1. General Dynamics Corporation
- 9.1.1. Company overview
- 9.1.2. Key executives
- 9.1.3. Company snapshot
- 9.1.4. Operating business segments
- 9.1.5. Product portfolio
- 9.1.6. Business performance
- 9.1.7. Key strategic moves and developments
- 9.2. International Business Machines Corporation
- 9.2.1. Company overview
- 9.2.2. Key executives
- 9.2.3. Company snapshot
- 9.2.4. Operating business segments
- 9.2.5. Product portfolio
- 9.2.6. Business performance
- 9.2.7. Key strategic moves and developments
- 9.3. L3Harris Technologies, Inc.
- 9.3.1. Company overview
- 9.3.2. Key executives
- 9.3.3. Company snapshot
- 9.3.4. Operating business segments
- 9.3.5. Product portfolio
- 9.3.6. Business performance
- 9.3.7. Key strategic moves and developments
- 9.4. Leonardo S.p.A.
- 9.4.1. Company overview
- 9.4.2. Key executives
- 9.4.3. Company snapshot
- 9.4.4. Operating business segments
- 9.4.5. Product portfolio
- 9.4.6. Business performance
- 9.4.7. Key strategic moves and developments
- 9.5. Lockheed Martin Corporation
- 9.5.1. Company overview
- 9.5.2. Key executives
- 9.5.3. Company snapshot
- 9.5.4. Operating business segments
- 9.5.5. Product portfolio
- 9.5.6. Business performance
- 9.5.7. Key strategic moves and developments
- 9.6. Northrop Grumman Corporation.
- 9.6.1. Company overview
- 9.6.2. Key executives
- 9.6.3. Company snapshot
- 9.6.4. Operating business segments
- 9.6.5. Product portfolio
- 9.6.6. Business performance
- 9.6.7. Key strategic moves and developments
- 9.7. Science Applications International Corporation (SAIC)
- 9.7.1. Company overview
- 9.7.2. Key executives
- 9.7.3. Company snapshot
- 9.7.4. Operating business segments
- 9.7.5. Product portfolio
- 9.7.6. Business performance
- 9.7.7. Key strategic moves and developments
- 9.8. Thales Group
- 9.8.1. Company overview
- 9.8.2. Key executives
- 9.8.3. Company snapshot
- 9.8.4. Operating business segments
- 9.8.5. Product portfolio
- 9.8.6. Business performance
- 9.8.7. Key strategic moves and developments
- 9.9. Unisys Corporation
- 9.9.1. Company overview
- 9.9.2. Key executives
- 9.9.3. Company snapshot
- 9.9.4. Operating business segments
- 9.9.5. Product portfolio
- 9.9.6. Business performance
- 9.9.7. Key strategic moves and developments
- 9.10. ELBIT SYSTEMS LTD.
- 9.10.1. Company overview
- 9.10.2. Key executives
- 9.10.3. Company snapshot
- 9.10.4. Operating business segments
- 9.10.5. Product portfolio
- 9.10.6. Business performance
- 9.10.7. Key strategic moves and developments
LIST OF TABLES
- TABLE 01. GLOBAL HOMELAND SECURITY MARKET, BY TYPE, 2022-2032 ($BILLION)
- TABLE 02. HOMELAND SECURITY MARKET FOR BORDER SECURITY, BY REGION, 2022-2032 ($BILLION)
- TABLE 03. HOMELAND SECURITY MARKET FOR AVIATION SECURITY, BY REGION, 2022-2032 ($BILLION)
- TABLE 04. HOMELAND SECURITY MARKET FOR MARITIME SECURITY, BY REGION, 2022-2032 ($BILLION)
- TABLE 05. HOMELAND SECURITY MARKET FOR CRITICAL INFRASTRUCTURE SECURITY, BY REGION, 2022-2032 ($BILLION)
- TABLE 06. HOMELAND SECURITY MARKET FOR CYBER SECURITY, BY REGION, 2022-2032 ($BILLION)
- TABLE 07. HOMELAND SECURITY MARKET FOR MASS TRANSPORT SECURITY, BY REGION, 2022-2032 ($BILLION)
- TABLE 08. HOMELAND SECURITY MARKET FOR LAW ENFORCEMENT, BY REGION, 2022-2032 ($BILLION)
- TABLE 09. HOMELAND SECURITY MARKET FOR CBRN SECURITY, BY REGION, 2022-2032 ($BILLION)
- TABLE 10. HOMELAND SECURITY MARKET FOR OTHERS, BY REGION, 2022-2032 ($BILLION)
- TABLE 11. GLOBAL HOMELAND SECURITY MARKET, BY END USER, 2022-2032 ($BILLION)
- TABLE 12. HOMELAND SECURITY MARKET FOR PUBLIC SECTOR, BY REGION, 2022-2032 ($BILLION)
- TABLE 13. HOMELAND SECURITY MARKET FOR PRIVATE SECTOR, BY REGION, 2022-2032 ($BILLION)
- TABLE 14. GLOBAL HOMELAND SECURITY MARKET, BY TECHNOLOGY, 2022-2032 ($BILLION)
- TABLE 15. HOMELAND SECURITY MARKET FOR RECOGNITION AND SURVEILLANCE SYSTEMS, BY REGION, 2022-2032 ($BILLION)
- TABLE 16. HOMELAND SECURITY MARKET FOR AI-BASED SOLUTIONS, BY REGION, 2022-2032 ($BILLION)
- TABLE 17. HOMELAND SECURITY MARKET FOR SECURITY PLATFORMS, BY REGION, 2022-2032 ($BILLION)
- TABLE 18. HOMELAND SECURITY MARKET FOR OTHERS, BY REGION, 2022-2032 ($BILLION)
- TABLE 19. HOMELAND SECURITY MARKET, BY REGION, 2022-2032 ($BILLION)
- TABLE 20. NORTH AMERICA HOMELAND SECURITY MARKET, BY TYPE, 2022-2032 ($BILLION)
- TABLE 21. NORTH AMERICA HOMELAND SECURITY MARKET, BY END USER, 2022-2032 ($BILLION)
- TABLE 22. NORTH AMERICA HOMELAND SECURITY MARKET, BY TECHNOLOGY, 2022-2032 ($BILLION)
- TABLE 23. NORTH AMERICA HOMELAND SECURITY MARKET, BY COUNTRY, 2022-2032 ($BILLION)
- TABLE 24. U.S. HOMELAND SECURITY MARKET, BY TYPE, 2022-2032 ($BILLION)
- TABLE 25. U.S. HOMELAND SECURITY MARKET, BY END USER, 2022-2032 ($BILLION)
- TABLE 26. U.S. HOMELAND SECURITY MARKET, BY TECHNOLOGY, 2022-2032 ($BILLION)
- TABLE 27. CANADA HOMELAND SECURITY MARKET, BY TYPE, 2022-2032 ($BILLION)
- TABLE 28. CANADA HOMELAND SECURITY MARKET, BY END USER, 2022-2032 ($BILLION)
- TABLE 29. CANADA HOMELAND SECURITY MARKET, BY TECHNOLOGY, 2022-2032 ($BILLION)
- TABLE 30. MEXICO HOMELAND SECURITY MARKET, BY TYPE, 2022-2032 ($BILLION)
- TABLE 31. MEXICO HOMELAND SECURITY MARKET, BY END USER, 2022-2032 ($BILLION)
- TABLE 32. MEXICO HOMELAND SECURITY MARKET, BY TECHNOLOGY, 2022-2032 ($BILLION)
- TABLE 33. EUROPE HOMELAND SECURITY MARKET, BY TYPE, 2022-2032 ($BILLION)
- TABLE 34. EUROPE HOMELAND SECURITY MARKET, BY END USER, 2022-2032 ($BILLION)
- TABLE 35. EUROPE HOMELAND SECURITY MARKET, BY TECHNOLOGY, 2022-2032 ($BILLION)
- TABLE 36. EUROPE HOMELAND SECURITY MARKET, BY COUNTRY, 2022-2032 ($BILLION)
- TABLE 37. UK HOMELAND SECURITY MARKET, BY TYPE, 2022-2032 ($BILLION)
- TABLE 38. UK HOMELAND SECURITY MARKET, BY END USER, 2022-2032 ($BILLION)
- TABLE 39. UK HOMELAND SECURITY MARKET, BY TECHNOLOGY, 2022-2032 ($BILLION)
- TABLE 40. GERMANY HOMELAND SECURITY MARKET, BY TYPE, 2022-2032 ($BILLION)
- TABLE 41. GERMANY HOMELAND SECURITY MARKET, BY END USER, 2022-2032 ($BILLION)
- TABLE 42. GERMANY HOMELAND SECURITY MARKET, BY TECHNOLOGY, 2022-2032 ($BILLION)
- TABLE 43. FRANCE HOMELAND SECURITY MARKET, BY TYPE, 2022-2032 ($BILLION)
- TABLE 44. FRANCE HOMELAND SECURITY MARKET, BY END USER, 2022-2032 ($BILLION)
- TABLE 45. FRANCE HOMELAND SECURITY MARKET, BY TECHNOLOGY, 2022-2032 ($BILLION)
- TABLE 46. RUSSIA HOMELAND SECURITY MARKET, BY TYPE, 2022-2032 ($BILLION)
- TABLE 47. RUSSIA HOMELAND SECURITY MARKET, BY END USER, 2022-2032 ($BILLION)
- TABLE 48. RUSSIA HOMELAND SECURITY MARKET, BY TECHNOLOGY, 2022-2032 ($BILLION)
- TABLE 49. REST OF EUROPE HOMELAND SECURITY MARKET, BY TYPE, 2022-2032 ($BILLION)
- TABLE 50. REST OF EUROPE HOMELAND SECURITY MARKET, BY END USER, 2022-2032 ($BILLION)
- TABLE 51. REST OF EUROPE HOMELAND SECURITY MARKET, BY TECHNOLOGY, 2022-2032 ($BILLION)
- TABLE 52. ASIA-PACIFIC HOMELAND SECURITY MARKET, BY TYPE, 2022-2032 ($BILLION)
- TABLE 53. ASIA-PACIFIC HOMELAND SECURITY MARKET, BY END USER, 2022-2032 ($BILLION)
- TABLE 54. ASIA-PACIFIC HOMELAND SECURITY MARKET, BY TECHNOLOGY, 2022-2032 ($BILLION)
- TABLE 55. ASIA-PACIFIC HOMELAND SECURITY MARKET, BY COUNTRY, 2022-2032 ($BILLION)
- TABLE 56. CHINA HOMELAND SECURITY MARKET, BY TYPE, 2022-2032 ($BILLION)
- TABLE 57. CHINA HOMELAND SECURITY MARKET, BY END USER, 2022-2032 ($BILLION)
- TABLE 58. CHINA HOMELAND SECURITY MARKET, BY TECHNOLOGY, 2022-2032 ($BILLION)
- TABLE 59. JAPAN HOMELAND SECURITY MARKET, BY TYPE, 2022-2032 ($BILLION)
- TABLE 60. JAPAN HOMELAND SECURITY MARKET, BY END USER, 2022-2032 ($BILLION)
- TABLE 61. JAPAN HOMELAND SECURITY MARKET, BY TECHNOLOGY, 2022-2032 ($BILLION)
- TABLE 62. INDIA HOMELAND SECURITY MARKET, BY TYPE, 2022-2032 ($BILLION)
- TABLE 63. INDIA HOMELAND SECURITY MARKET, BY END USER, 2022-2032 ($BILLION)
- TABLE 64. INDIA HOMELAND SECURITY MARKET, BY TECHNOLOGY, 2022-2032 ($BILLION)
- TABLE 65. SOUTH KOREA HOMELAND SECURITY MARKET, BY TYPE, 2022-2032 ($BILLION)
- TABLE 66. SOUTH KOREA HOMELAND SECURITY MARKET, BY END USER, 2022-2032 ($BILLION)
- TABLE 67. SOUTH KOREA HOMELAND SECURITY MARKET, BY TECHNOLOGY, 2022-2032 ($BILLION)
- TABLE 68. REST OF ASIA-PACIFIC HOMELAND SECURITY MARKET, BY TYPE, 2022-2032 ($BILLION)
- TABLE 69. REST OF ASIA-PACIFIC HOMELAND SECURITY MARKET, BY END USER, 2022-2032 ($BILLION)
- TABLE 70. REST OF ASIA-PACIFIC HOMELAND SECURITY MARKET, BY TECHNOLOGY, 2022-2032 ($BILLION)
- TABLE 71. LAMEA HOMELAND SECURITY MARKET, BY TYPE, 2022-2032 ($BILLION)
- TABLE 72. LAMEA HOMELAND SECURITY MARKET, BY END USER, 2022-2032 ($BILLION)
- TABLE 73. LAMEA HOMELAND SECURITY MARKET, BY TECHNOLOGY, 2022-2032 ($BILLION)
- TABLE 74. LAMEA HOMELAND SECURITY MARKET, BY COUNTRY, 2022-2032 ($BILLION)
- TABLE 75. LATIN AMERICA HOMELAND SECURITY MARKET, BY TYPE, 2022-2032 ($BILLION)
- TABLE 76. LATIN AMERICA HOMELAND SECURITY MARKET, BY END USER, 2022-2032 ($BILLION)
- TABLE 77. LATIN AMERICA HOMELAND SECURITY MARKET, BY TECHNOLOGY, 2022-2032 ($BILLION)
- TABLE 78. MIDDLE EAST HOMELAND SECURITY MARKET, BY TYPE, 2022-2032 ($BILLION)
- TABLE 79. MIDDLE EAST HOMELAND SECURITY MARKET, BY END USER, 2022-2032 ($BILLION)
- TABLE 80. MIDDLE EAST HOMELAND SECURITY MARKET, BY TECHNOLOGY, 2022-2032 ($BILLION)
- TABLE 81. AFRICA HOMELAND SECURITY MARKET, BY TYPE, 2022-2032 ($BILLION)
- TABLE 82. AFRICA HOMELAND SECURITY MARKET, BY END USER, 2022-2032 ($BILLION)
- TABLE 83. AFRICA HOMELAND SECURITY MARKET, BY TECHNOLOGY, 2022-2032 ($BILLION)
- TABLE 84. GENERAL DYNAMICS CORPORATION: KEY EXECUTIVES
- TABLE 85. GENERAL DYNAMICS CORPORATION: COMPANY SNAPSHOT
- TABLE 86. GENERAL DYNAMICS CORPORATION: PRODUCT SEGMENTS
- TABLE 87. GENERAL DYNAMICS CORPORATION: PRODUCT PORTFOLIO
- TABLE 88. GENERAL DYNAMICS CORPORATION: KEY STRATERGIES
- TABLE 89. INTERNATIONAL BUSINESS MACHINES CORPORATION: KEY EXECUTIVES
- TABLE 90. INTERNATIONAL BUSINESS MACHINES CORPORATION: COMPANY SNAPSHOT
- TABLE 91. INTERNATIONAL BUSINESS MACHINES CORPORATION: PRODUCT SEGMENTS
- TABLE 92. INTERNATIONAL BUSINESS MACHINES CORPORATION: PRODUCT PORTFOLIO
- TABLE 93. INTERNATIONAL BUSINESS MACHINES CORPORATION: KEY STRATERGIES
- TABLE 94. L3HARRIS TECHNOLOGIES, INC.: KEY EXECUTIVES
- TABLE 95. L3HARRIS TECHNOLOGIES, INC.: COMPANY SNAPSHOT
- TABLE 96. L3HARRIS TECHNOLOGIES, INC.: PRODUCT SEGMENTS
- TABLE 97. L3HARRIS TECHNOLOGIES, INC.: PRODUCT PORTFOLIO
- TABLE 98. L3HARRIS TECHNOLOGIES, INC.: KEY STRATERGIES
- TABLE 99. LEONARDO S.P.A.: KEY EXECUTIVES
- TABLE 100. LEONARDO S.P.A.: COMPANY SNAPSHOT
- TABLE 101. LEONARDO S.P.A.: PRODUCT SEGMENTS
- TABLE 102. LEONARDO S.P.A.: PRODUCT PORTFOLIO
- TABLE 103. LEONARDO S.P.A.: KEY STRATERGIES
- TABLE 104. LOCKHEED MARTIN CORPORATION: KEY EXECUTIVES
- TABLE 105. LOCKHEED MARTIN CORPORATION: COMPANY SNAPSHOT
- TABLE 106. LOCKHEED MARTIN CORPORATION: PRODUCT SEGMENTS
- TABLE 107. LOCKHEED MARTIN CORPORATION: PRODUCT PORTFOLIO
- TABLE 108. LOCKHEED MARTIN CORPORATION: KEY STRATERGIES
- TABLE 109. NORTHROP GRUMMAN CORPORATION.: KEY EXECUTIVES
- TABLE 110. NORTHROP GRUMMAN CORPORATION.: COMPANY SNAPSHOT
- TABLE 111. NORTHROP GRUMMAN CORPORATION.: PRODUCT SEGMENTS
- TABLE 112. NORTHROP GRUMMAN CORPORATION.: PRODUCT PORTFOLIO
- TABLE 113. NORTHROP GRUMMAN CORPORATION.: KEY STRATERGIES
- TABLE 114. SCIENCE APPLICATIONS INTERNATIONAL CORPORATION (SAIC): KEY EXECUTIVES
- TABLE 115. SCIENCE APPLICATIONS INTERNATIONAL CORPORATION (SAIC): COMPANY SNAPSHOT
- TABLE 116. SCIENCE APPLICATIONS INTERNATIONAL CORPORATION (SAIC): PRODUCT SEGMENTS
- TABLE 117. SCIENCE APPLICATIONS INTERNATIONAL CORPORATION (SAIC): PRODUCT PORTFOLIO
- TABLE 118. SCIENCE APPLICATIONS INTERNATIONAL CORPORATION (SAIC): KEY STRATERGIES
- TABLE 119. THALES GROUP: KEY EXECUTIVES
- TABLE 120. THALES GROUP: COMPANY SNAPSHOT
- TABLE 121. THALES GROUP: PRODUCT SEGMENTS
- TABLE 122. THALES GROUP: PRODUCT PORTFOLIO
- TABLE 123. THALES GROUP: KEY STRATERGIES
- TABLE 124. UNISYS CORPORATION: KEY EXECUTIVES
- TABLE 125. UNISYS CORPORATION: COMPANY SNAPSHOT
- TABLE 126. UNISYS CORPORATION: PRODUCT SEGMENTS
- TABLE 127. UNISYS CORPORATION: PRODUCT PORTFOLIO
- TABLE 128. UNISYS CORPORATION: KEY STRATERGIES
- TABLE 129. ELBIT SYSTEMS LTD.: KEY EXECUTIVES
- TABLE 130. ELBIT SYSTEMS LTD.: COMPANY SNAPSHOT
- TABLE 131. ELBIT SYSTEMS LTD.: PRODUCT SEGMENTS
- TABLE 132. ELBIT SYSTEMS LTD.: PRODUCT PORTFOLIO
- TABLE 133. ELBIT SYSTEMS LTD.: KEY STRATERGIES
LIST OF FIGURES
- FIGURE 01. HOMELAND SECURITY MARKET, 2022-2032
- FIGURE 02. SEGMENTATION OF HOMELAND SECURITY MARKET,2022-2032
- FIGURE 03. TOP IMPACTING FACTORS IN HOMELAND SECURITY MARKET (2022 TO 2032)
- FIGURE 04. TOP INVESTMENT POCKETS IN HOMELAND SECURITY MARKET (2023-2032)
- FIGURE 05. HIGH BARGAINING POWER OF SUPPLIERS
- FIGURE 06. LOW THREAT OF NEW ENTRANTS
- FIGURE 07. LOW THREAT OF SUBSTITUTES
- FIGURE 08. LOW INTENSITY OF RIVALRY
- FIGURE 09. LOW BARGAINING POWER OF BUYERS
- FIGURE 10. GLOBAL HOMELAND SECURITY MARKET:DRIVERS, RESTRAINTS AND OPPORTUNITIES
- FIGURE 11. HOMELAND SECURITY MARKET, BY TYPE, 2022 AND 2032(%)
- FIGURE 12. COMPARATIVE SHARE ANALYSIS OF HOMELAND SECURITY MARKET FOR BORDER SECURITY, BY COUNTRY 2022 AND 2032(%)
- FIGURE 13. COMPARATIVE SHARE ANALYSIS OF HOMELAND SECURITY MARKET FOR AVIATION SECURITY, BY COUNTRY 2022 AND 2032(%)
- FIGURE 14. COMPARATIVE SHARE ANALYSIS OF HOMELAND SECURITY MARKET FOR MARITIME SECURITY, BY COUNTRY 2022 AND 2032(%)
- FIGURE 15. COMPARATIVE SHARE ANALYSIS OF HOMELAND SECURITY MARKET FOR CRITICAL INFRASTRUCTURE SECURITY, BY COUNTRY 2022 AND 2032(%)
- FIGURE 16. COMPARATIVE SHARE ANALYSIS OF HOMELAND SECURITY MARKET FOR CYBER SECURITY, BY COUNTRY 2022 AND 2032(%)
- FIGURE 17. COMPARATIVE SHARE ANALYSIS OF HOMELAND SECURITY MARKET FOR MASS TRANSPORT SECURITY, BY COUNTRY 2022 AND 2032(%)
- FIGURE 18. COMPARATIVE SHARE ANALYSIS OF HOMELAND SECURITY MARKET FOR LAW ENFORCEMENT, BY COUNTRY 2022 AND 2032(%)
- FIGURE 19. COMPARATIVE SHARE ANALYSIS OF HOMELAND SECURITY MARKET FOR CBRN SECURITY, BY COUNTRY 2022 AND 2032(%)
- FIGURE 20. COMPARATIVE SHARE ANALYSIS OF HOMELAND SECURITY MARKET FOR OTHERS, BY COUNTRY 2022 AND 2032(%)
- FIGURE 21. HOMELAND SECURITY MARKET, BY END USER, 2022 AND 2032(%)
- FIGURE 22. COMPARATIVE SHARE ANALYSIS OF HOMELAND SECURITY MARKET FOR PUBLIC SECTOR, BY COUNTRY 2022 AND 2032(%)
- FIGURE 23. COMPARATIVE SHARE ANALYSIS OF HOMELAND SECURITY MARKET FOR PRIVATE SECTOR, BY COUNTRY 2022 AND 2032(%)
- FIGURE 24. HOMELAND SECURITY MARKET, BY TECHNOLOGY, 2022 AND 2032(%)
- FIGURE 25. COMPARATIVE SHARE ANALYSIS OF HOMELAND SECURITY MARKET FOR RECOGNITION AND SURVEILLANCE SYSTEMS, BY COUNTRY 2022 AND 2032(%)
- FIGURE 26. COMPARATIVE SHARE ANALYSIS OF HOMELAND SECURITY MARKET FOR AI-BASED SOLUTIONS, BY COUNTRY 2022 AND 2032(%)
- FIGURE 27. COMPARATIVE SHARE ANALYSIS OF HOMELAND SECURITY MARKET FOR SECURITY PLATFORMS, BY COUNTRY 2022 AND 2032(%)
- FIGURE 28. COMPARATIVE SHARE ANALYSIS OF HOMELAND SECURITY MARKET FOR OTHERS, BY COUNTRY 2022 AND 2032(%)
- FIGURE 29. HOMELAND SECURITY MARKET BY REGION, 2022 AND 2032(%)
- FIGURE 30. U.S. HOMELAND SECURITY MARKET, 2022-2032 ($BILLION)
- FIGURE 31. CANADA HOMELAND SECURITY MARKET, 2022-2032 ($BILLION)
- FIGURE 32. MEXICO HOMELAND SECURITY MARKET, 2022-2032 ($BILLION)
- FIGURE 33. UK HOMELAND SECURITY MARKET, 2022-2032 ($BILLION)
- FIGURE 34. GERMANY HOMELAND SECURITY MARKET, 2022-2032 ($BILLION)
- FIGURE 35. FRANCE HOMELAND SECURITY MARKET, 2022-2032 ($BILLION)
- FIGURE 36. RUSSIA HOMELAND SECURITY MARKET, 2022-2032 ($BILLION)
- FIGURE 37. REST OF EUROPE HOMELAND SECURITY MARKET, 2022-2032 ($BILLION)
- FIGURE 38. CHINA HOMELAND SECURITY MARKET, 2022-2032 ($BILLION)
- FIGURE 39. JAPAN HOMELAND SECURITY MARKET, 2022-2032 ($BILLION)
- FIGURE 40. INDIA HOMELAND SECURITY MARKET, 2022-2032 ($BILLION)
- FIGURE 41. SOUTH KOREA HOMELAND SECURITY MARKET, 2022-2032 ($BILLION)
- FIGURE 42. REST OF ASIA-PACIFIC HOMELAND SECURITY MARKET, 2022-2032 ($BILLION)
- FIGURE 43. LATIN AMERICA HOMELAND SECURITY MARKET, 2022-2032 ($BILLION)
- FIGURE 44. MIDDLE EAST HOMELAND SECURITY MARKET, 2022-2032 ($BILLION)
- FIGURE 45. AFRICA HOMELAND SECURITY MARKET, 2022-2032 ($BILLION)
- FIGURE 46. TOP WINNING STRATEGIES, BY YEAR (2020-2023)
- FIGURE 47. TOP WINNING STRATEGIES, BY DEVELOPMENT (2020-2023)
- FIGURE 48. TOP WINNING STRATEGIES, BY COMPANY (2020-2023)
- FIGURE 49. PRODUCT MAPPING OF TOP 10 PLAYERS
- FIGURE 50. COMPETITIVE DASHBOARD
- FIGURE 51. COMPETITIVE HEATMAP: HOMELAND SECURITY MARKET
- FIGURE 52. TOP PLAYER POSITIONING, 2022
- FIGURE 53. GENERAL DYNAMICS CORPORATION: NET REVENUE, 2020-2022 ($MILLION)
- FIGURE 54. GENERAL DYNAMICS CORPORATION: RESEARCH & DEVELOPMENT EXPENDITURE, 2020-2022 ($MILLION)
- FIGURE 55. GENERAL DYNAMICS CORPORATION: REVENUE SHARE BY SEGMENT, 2021 (%)
- FIGURE 56. GENERAL DYNAMICS CORPORATION: REVENUE SHARE BY REGION, 2022 (%)
- FIGURE 57. INTERNATIONAL BUSINESS MACHINES CORPORATION: RESEARCH & DEVELOPMENT EXPENDITURE, 2020-2022 ($MILLION
- FIGURE 58. INTERNATIONAL BUSINESS MACHINES CORPORATION: NET REVENUE, 2020-2022 ($MILLION)
- FIGURE 59. INTERNATIONAL BUSINESS MACHINES CORPORATION: REVENUE SHARE BY SEGMENT, 2022 (%)
- FIGURE 60. INTERNATIONAL BUSINESS MACHINES CORPORATION: REVENUE SHARE BY REGION, 2022 (%)
- FIGURE 61. L3HARRIS TECHNOLOGIES, INC.: NET REVENUE, 2020-2022 ($MILLION)
- FIGURE 62. L3HARRIS TECHNOLOGIES, INC.: RESEARCH & DEVELOPMENT EXPENDITURE, 2020-2022 ($MILLION)
- FIGURE 63. L3HARRIS TECHNOLOGIES, INC.: REVENUE SHARE BY SEGMENT, 2022 (%)
- FIGURE 64. L3HARRIS TECHNOLOGIES, INC.: REVENUE SHARE BY REGION, 2022 (%)
- FIGURE 65. LEONARDO S.P.A.: NET REVENUE, 2020-2022 ($MILLION)
- FIGURE 66. LEONARDO S.P.A.: RESEARCH & DEVELOPMENT EXPENDITURE, 2020-2022 ($MILLION)
- FIGURE 67. LEONARDO S.P.A.: REVENUE SHARE BY SEGMENT, 2022 (%)
- FIGURE 68. LEONARDO S.P.A.: REVENUE SHARE BY REGION, 2022 (%)
- FIGURE 69. LOCKHEED MARTIN CORPORATION: NET REVENUE, 2020-2022 ($MILLION)
- FIGURE 70. LOCKHEED MARTIN CORPORATION: RESEARCH & DEVELOPMENT EXPENDITURE, 2020-2022 ($MILLION)
- FIGURE 71. LOCKHEED MARTIN CORPORATION: REVENUE SHARE BY SEGMENT, 2022 (%)
- FIGURE 72. LOCKHEED MARTIN CORPORATION: REVENUE SHARE BY REGION, 2022 (%)
- FIGURE 73. NORTHROP GRUMMAN CORPORATION.: RESEARCH & DEVELOPMENT EXPENDITURE, 2020-2022 ($MILLION)
- FIGURE 74. NORTHROP GRUMMAN CORPORATION.: NET REVENUE, 2020-2022 ($MILLION)
- FIGURE 75. NORTHROP GRUMMAN CORPORATION.: REVENUE SHARE BY SEGMENT, 2022 (%)
- FIGURE 76. NORTHROP GRUMMAN CORPORATION.: REVENUE SHARE BY REGION, 2022 (%)
- FIGURE 77. SCIENCE APPLICATIONS INTERNATIONAL CORPORATION (SAIC): RESEARCH & DEVELOPMENT EXPENDITURE, 2020-2022
- FIGURE 78. SCIENCE APPLICATIONS INTERNATIONAL CORPORATION (SAIC): NET REVENUE, 2020-2022 ($MILLION)
- FIGURE 79. THALES GROUP: NET REVENUE, 2020-2022 ($MILLION)
- FIGURE 80. THALES GROUP: RESEARCH & DEVELOPMENT EXPENDITURE, 2020-2022 ($MILLION)
- FIGURE 81. THALES GROUP: REVENUE SHARE BY REGION, 2022 (%)
- FIGURE 82. THALES GROUP: REVENUE SHARE BY SEGMENT, 2022 (%)
- FIGURE 83. UNISYS CORPORATION: SALES REVENUE, 2020-2022 ($MILLION)
- FIGURE 84. UNISYS CORPORATION: RESEARCH & DEVELOPMENT EXPENDITURE, 2020-2022 ($MILLION)
- FIGURE 85. UNISYS CORPORATION: REVENUE SHARE BY SEGMENT, 2022 (%)
- FIGURE 86. UNISYS CORPORATION: REVENUE SHARE BY REGION, 2022 (%)
- FIGURE 87. ELBIT SYSTEMS LTD.: RESEARCH & DEVELOPMENT EXPENDITURE, 2020-2022 ($MILLION)
- FIGURE 88. ELBIT SYSTEMS LTD.: NET REVENUE, 2020-2022 ($MILLION)
- FIGURE 89. ELBIT SYSTEMS LTD.: REVENUE SHARE BY SEGMENT, 2022 (%)
- FIGURE 90. ELBIT SYSTEMS LTD.: REVENUE SHARE BY REGION, 2022 (%)
 全球國土安全市場規模、佔有率、成長分析(按類型、技術、最終用戶)- 2024-2031 年產業預測
 2024 年國防安全保障與緊急管理全球市場報告
 國土安全與緊急管理市場:現況分析與預測(2023-2030)
 2024 年國防安全保障全球市場報告
 國防安全保障市場規模、佔有率、趨勢分析報告:按類型、地區、細分市場預測,2023-2030 年
 國土安全和緊急管理市場:按解決方案、安裝基礎、用途和最終用戶分類 - COVID-19、俄羅斯-烏克蘭衝突和高通膨的累積影響 - 2023-2030 年全球預測
 國土安全市場:按解決方案、技術和安全類型分類 - COVID-19、俄羅斯-烏克蘭衝突和高累積的累積影響 - 2023-2030 年全球預測
 全球國土安全市場:按類型、最終用戶、技術、地區劃分——規模、份額、前景、機會分析,2023-2030 年
 國防安全保障·緊急事態管理的全球市場
 國防安全保障的全球市場