


 |
市場調查報告書
商品編碼
1414879
電池技術市場:按電池類型、按應用分類:2023-2032年全球機會分析與產業預測Battery Technology Market By Battery Type, By Application : Global Opportunity Analysis and Industry Forecast, 2023-2032 |
||||||
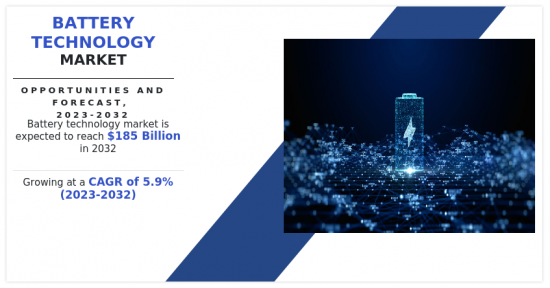
2022年電池技術市場規模預計為1,029億美元,預計2032年將達到1,850億美元,2023年至2032年年複合成長率為5.9%。
電池是由一個或多個電池組成的電池組,每個電池都有正極(陰極)、負極(陽極)、隔膜和電解。新電池技術的突破迅速進展。目前開發先進的新型電池,其中一些已經推出市場。最新一代的電網規模電池具有更高的容量、更高的效率和更長的壽命。
電池技術產業的成長和業績高度依賴電動車(EV)和電池技術之間的相互作用。二次電池是電動車中主要的能源儲存設備,為轉動車輪的電動馬達提供動力。電動車應用最廣泛的電池技術是鋰離子技術,其能量密度高、重量相對較輕,並且擁有成熟的生產基礎設施。電動車的續航里程由電池的能量密度決定。能量密度更高的電池可以在充電之間行駛更遠的距離。進行的研究的目標是提高電動車的續航里程和能量密度。
電動車充電基礎設施的擴張與電動車的興起密切相關。充電等級分為三種:快速補充能量的超快充電、公共站點快充、家庭慢充。充電速度受電池技術的影響。更快的充電能力是減少充電時間並增加電動車便利性的首選。電動車的續航里程有限導致了「里程焦慮」,但電池技術的進步緩解這種焦慮。如果電池具有高能量密度,則可以延長充電間隔。電池管理系統可監控和調節電池組內每個電池的性能和健康狀況。 BMS 技術可延長電池壽命、提高安全性並最佳化充電/放電週期。
電池的生命週期包括多個階段,包括原料提取、製造、使用以及使用壽命結束時的回收和處置。當鋰、鈷、鎳和稀土元素等礦物被開採用於電池時,生態系統可能會因棲息地擾亂、土壤劣化和水污染而受到損害。鈷礦開採尤其引起了一些採礦作業中侵犯人權和工作條件的道德問題。使用不再生能源來源時,能源集中電池製造方法會增加溫室氣體排放。若控制不當,製造過程中會使用以下化學品:
- 在製造過程中使用塗料和溶劑等化學品會對環境產生負面影響。
電池技術市場按電池類型、應用和地區細分。依電池類型分為鉛酸電池、鋰離子電池、鋰金屬電池、鎳鎘電池、鎳金屬電池等。鋰離子電池領域將主導2022年電池技術市場的成長。預計在電池技術市場的預測期內,它將以最高的年複合成長率成長。依用途分為汽車工業、家電工業、住宅/商業工業、電力工業、國防/航空工業等。汽車產業將主導2022年電池技術市場的成長。預計在電池技術市場的預測期內,它將以最高的年複合成長率成長。
從區域來看,對北美、歐洲、亞太地區和LAMEA的電池技術市場進行了分析。亞太地區主導了2022年電池技術市場的成長。預計在電池技術市場的預測期內,它將以最高的年複合成長率成長。電池技術產業的主要企業包括Exide Industries Ltd., Hitachi Ltd., Samsung SDI Co., Ltd., Sony Corporation, General Electric, Honda Motor Co., Ltd., Honeywell International Inc., BAK Power Battery Co., Ltd., Fujitsu, American Battery Charging Inc.。
本報告透過詳細考察市場的各個方面,對電池技術市場進行了全面分析:
- 市場動態、關鍵細分市場、關鍵區域、主要企業和競爭形勢。本報告根據各種市場動態和影響市場的關鍵力量的影響,揭示了電池技術市場的現狀和未來趨勢。市場促進因素和市場成長機會在市場動態中得到認可。電池技術市場也面臨可能阻礙市場成長的挑戰和市場抑制因素。波特五力分析是準確強調關鍵力量對電池技術市場影響的報告。本報告提供了市場規模和估計,透過各個細分市場分析了電池技術市場。此外,本報告還涵蓋了電池技術市場的競爭情況。研究電池技術市場的主要企業,了解他們目前的市場地位和產業競爭力。
目錄
第1章 簡介
第2章 執行摘要
第3章 市場概況
- 市場定義和範圍
- 主要發現
- 影響因素
- 主要投資機會
- 波特五力分析
- 市場動態
- 促進因素
- 再生能源併網
- 電動車需求的增加將推動市場成長
- 抑制因素
- 原物料採購及成本問題
- 人們越來越關注電池對環境的影響
- 機會
- 電網規模能源儲存
- 促進因素
- 價值鏈分析
- 專利形勢
第4章 電池技術市場:按電池類型
- 概述
- 鉛酸蓄電池
- 鋰離子電池
- 鋰金屬電池
- 鎳鎘電池
- 鎳金屬電池
- 其他
第5章 電池技術市場:依應用分類
- 概述
- 汽車產業
- 家用電器
- 住宅/商業業
- 電力業
- 國防/航空
- 其他
第6章 電池技術市場:依地區
- 概述
- 北美洲
- 美國
- 加拿大
- 墨西哥
- 歐洲
- 德國
- 英國
- 法國
- 義大利
- 西班牙
- 其他
- 亞太地區
- 中國
- 日本
- 印度
- 韓國
- 澳洲
- 其他
- 拉丁美洲、中東、非洲
- 巴西
- 沙烏地阿拉伯
- 南非
- 其他
第7章 競爭形勢
- 介紹
- 關鍵成功策略
- 10家主要企業產品圖譜
- 競爭對手儀表板
- 競爭熱圖
- 2022年主要企業定位
第8章 公司簡介
- EXIDE INDUSTRIES LTD.
- Hitachi Ltd.
- Samsung SDI Co., Ltd.
- Sony Corporation
- General Electric
- Honda Motor Co., Ltd.
- Honeywell International Inc.
- BAK Power Battery Co., Ltd.
- Fujitsu
- American Battery Charging Inc.
According to a new report published by Allied Market Research, titled, "Battery Technology Market," The battery technology market was valued at $102.9 billion in 2022, and is estimated to reach $185 billion by 2032, growing at a CAGR of 5.9% from 2023 to 2032.
A battery is a pack of one or more cells, each of which has a positive electrode (the cathode), a negative electrode (the anode), a separator, and an electrolyte. New battery technology breakthrough is happening rapidly. Advanced new batteries are currently being developed, with some already on the market. The latest generation of grid scale storage batteries have a higher capacity, a higher efficiency, and are longer-lasting.
The growth and performance of the battery technology industry are largely dependent on the interaction between electric vehicles (EVs) and battery technology. Rechargeable batteries are the main energy storage device in electric cars, providing power to the electric motors that turn the wheels. The most widely utilized battery technology in electric cars is lithium-ion technology because of its high energy density, relative lightweight, and well-established production infrastructure. An electric vehicle's range is determined by the energy density of its batteries. Longer driving distances between charges are possible with batteries with higher energy densities. The goal of ongoing research is to increase electric vehicle range and energy density.
The expansion of infrastructure for charging electric cars is intimately linked to the rise of these vehicles. There are three different charging levels: ultra-fast charging for quick energy replenishment, fast charging at public stations, and slow charging at home. Charging speed is influenced by battery technology. In order to shorten charging periods and enhance the convenience of electric vehicles, faster charging capabilities are preferred. The restricted range of electric vehicles has led to "range anxiety," which is lessened with advancements in battery technology. A car can go farther between charges if its batteries have a higher energy density. Battery management systems keep an eye on and regulate each cell's performance and health inside a battery pack. Battery life is increased, safety is improved, and charging and discharging cycles are optimized with BMS technology.
The life cycle of a battery includes several stages, including extraction of raw materials, manufacture, usage, and recycling or disposal at the end of the battery's useful life. When minerals like lithium, cobalt, nickel, and rare earth elements are mined for batteries, the ecosystem may suffer from disturbed habitats, degraded soil, and contaminated water. The extraction of some materials-cobalt in particular-has sparked ethical questions about human rights abuses and working conditions in some mining operations. Energy-intensive battery manufacturing methods can increase greenhouse gas emissions if they employ energy from non-renewable sources. If not appropriately controlled, the use of chemicals in manufacturing processes-such as coatings and solvents-may have an adverse effect on the environment.
The battery technology market is segmented on the basis of battery type, application, and region. By battery type, the market is classified into lead acid battery, lithium-ion battery, lithium-metal battery, nickel cadmium battery, nickel metal battery, and others. The lithium-ion battery segment dominated the battery technology market growth in 2022. It is also projected to grow at the highest CAGR during the battery technology market forecast period. By application, the market is segmented into automotive industry, consumer electronics, residential and commercial industry, power industry, defense and aviation, and others. Automotive industry segment dominated the battery technology market growth in 2022. It is also projected to grow at the highest CAGR during the battery technology market forecast period.
Region-wise, the battery technology market analysis is done across North America, Europe, Asia-Pacific, and LAMEA. The Asia-Pacific region dominated the battery technology market growth in 2022. It is also projected to grow at the highest CAGR during the battery technology market forecast period. Key players operating in the battery technology industry include Exide Industries Ltd., Hitachi Ltd., Samsung SDI Co., Ltd., Sony Corporation, General Electric, Honda Motor Co., Ltd., Honeywell International Inc., BAK Power Battery Co., Ltd., Fujitsu, and American Battery Charging Inc.
The report offers a thorough analysis of the battery technology market with detailed study of various aspects of the market such as market dynamics, vital segments, major geographies, key players, and competitive landscape. The report provides a clear picture of the current market situation and future trends of the battery technology market based on the impact of various market dynamics and vital forces influencing the market. The drivers and opportunities contributing toward the market growth are acknowledged in the market dynamics. Besides, challenges and restraints that hold potential to hamper market growth are also provided in the battery technology market. Porter's five forces analysis is delivered through the report which precisely highlights the effects of key forces on the battery technology market. The report offers market size and estimations analyzing battery technology market through various segments. Furthermore, the report covers the competitive scenario of the battery technology market. The key players operating in the battery technology market are studied in the report to understand their current market position and competitive strengths in the industry.
Key Benefits For Stakeholders
- This report provides a quantitative analysis of the market segments, current trends, estimations, and dynamics of the battery technology market analysis from 2022 to 2032 to identify the prevailing battery technology market opportunities.
- The market research is offered along with information related to key drivers, restraints, and opportunities.
- Porter's five forces analysis highlights the potency of buyers and suppliers to enable stakeholders make profit-oriented business decisions and strengthen their supplier-buyer network.
- In-depth analysis of the battery technology market segmentation assists to determine the prevailing market opportunities.
- Major countries in each region are mapped according to their revenue contribution to the global market.
- Market player positioning facilitates benchmarking and provides a clear understanding of the present position of the market players.
- The report includes the analysis of the regional as well as global battery technology market trends, key players, market segments, application areas, and market growth strategies.
Additional benefits you will get with this purchase are:
- Quarterly Update and* (only available with a corporate license, on listed price)
- 5 additional Company Profile of client Choice pre- or Post-purchase, as a free update.
- Free Upcoming Version on the Purchase of Five and Enterprise User License.
- 16 analyst hours of support* (post-purchase, if you find additional data requirements upon review of the report, you may receive support amounting to 16 analyst hours to solve questions, and post-sale queries)
- 15% Free Customization* (in case the scope or segment of the report does not match your requirements, 15% is equivalent to 3 working days of free work, applicable once)
- Free data Pack on the Five and Enterprise User License. (Excel version of the report)
- Free Updated report if the report is 6-12 months old or older.
- 24-hour priority response*
- Free Industry updates and white papers.
Possible Customization with this report (with additional cost and timeline, please talk to the sales executive to know more)
- Additional company profiles with specific to client's interest
- Additional country or region analysis- market size and forecast
- Historic market data
- Import Export Analysis/Data
- SWOT Analysis
Key Market Segments
By Application
- Automotive Industry
- Consumer Electronics
- Residential and Commercial Industry
- Power Industry
- Defense and Aviation
- Others
By Battery Type
- Lead acid battery
- Lithium-ion battery
- Lithium-metal battery
- Nickel cadmium battery
- Nickel metal battery
- Others
By Region
- North America
- U.S.
- Canada
- Mexico
- Europe
- Germany
- UK
- France
- Italy
- Spain
- Rest of Europe
- Asia-Pacific
- China
- Japan
- India
- South Korea
- Australia
- Rest of Asia-Pacific
- LAMEA
- Brazil
- Saudi Arabia
- South Africa
- Rest of LAMEA
Key Market Players:
- EXIDE INDUSTRIES LTD.
- Fujitsu
- American Battery Charging Inc.
- Honeywell International Inc.
- Honda Motor Co., Ltd.
- Hitachi Ltd.
- General Electric
- Sony Corporation
- Samsung SDI Co., Ltd.
- BAK Power Battery Co., Ltd.
TABLE OF CONTENTS
CHAPTER 1: INTRODUCTION
- 1.1. Report description
- 1.2. Key market segments
- 1.3. Key benefits to the stakeholders
- 1.4. Research methodology
- 1.4.1. Primary research
- 1.4.2. Secondary research
- 1.4.3. Analyst tools and models
CHAPTER 2: EXECUTIVE SUMMARY
- 2.1. CXO Perspective
CHAPTER 3: MARKET OVERVIEW
- 3.1. Market definition and scope
- 3.2. Key findings
- 3.2.1. Top impacting factors
- 3.2.2. Top investment pockets
- 3.3. Porter's five forces analysis
- 3.3.1. Low bargaining power of suppliers
- 3.3.2. Low threat of new entrants
- 3.3.3. Low threat of substitutes
- 3.3.4. Low intensity of rivalry
- 3.3.5. Low bargaining power of buyers
- 3.4. Market dynamics
- 3.4.1. Drivers
- 3.4.1.1. Renewable energy integration
- 3.4.1.2. Rise in demand for electric vehicle to drive the market growth
- 3.4.2. Restraints
- 3.4.2.1. Raw material procurement and cost challenges
- 3.4.2.2. Rise in concerns over environmental impact of batteries
- 3.4.3. Opportunities
- 3.4.3.1. Grid-scale energy storage
- 3.4.1. Drivers
- 3.5. Value Chain Analysis
- 3.6. Patent Landscape
CHAPTER 4: BATTERY TECHNOLOGY MARKET, BY BATTERY TYPE
- 4.1. Overview
- 4.1.1. Market size and forecast
- 4.2. Lead acid battery
- 4.2.1. Key market trends, growth factors and opportunities
- 4.2.2. Market size and forecast, by region
- 4.2.3. Market share analysis by country
- 4.3. Lithium-ion battery
- 4.3.1. Key market trends, growth factors and opportunities
- 4.3.2. Market size and forecast, by region
- 4.3.3. Market share analysis by country
- 4.4. Lithium-metal battery
- 4.4.1. Key market trends, growth factors and opportunities
- 4.4.2. Market size and forecast, by region
- 4.4.3. Market share analysis by country
- 4.5. Nickel cadmium battery
- 4.5.1. Key market trends, growth factors and opportunities
- 4.5.2. Market size and forecast, by region
- 4.5.3. Market share analysis by country
- 4.6. Nickel metal battery
- 4.6.1. Key market trends, growth factors and opportunities
- 4.6.2. Market size and forecast, by region
- 4.6.3. Market share analysis by country
- 4.7. Others
- 4.7.1. Key market trends, growth factors and opportunities
- 4.7.2. Market size and forecast, by region
- 4.7.3. Market share analysis by country
CHAPTER 5: BATTERY TECHNOLOGY MARKET, BY APPLICATION
- 5.1. Overview
- 5.1.1. Market size and forecast
- 5.2. Automotive Industry
- 5.2.1. Key market trends, growth factors and opportunities
- 5.2.2. Market size and forecast, by region
- 5.2.3. Market share analysis by country
- 5.3. Consumer Electronics
- 5.3.1. Key market trends, growth factors and opportunities
- 5.3.2. Market size and forecast, by region
- 5.3.3. Market share analysis by country
- 5.4. Residential and Commercial Industry
- 5.4.1. Key market trends, growth factors and opportunities
- 5.4.2. Market size and forecast, by region
- 5.4.3. Market share analysis by country
- 5.5. Power Industry
- 5.5.1. Key market trends, growth factors and opportunities
- 5.5.2. Market size and forecast, by region
- 5.5.3. Market share analysis by country
- 5.6. Defense and Aviation
- 5.6.1. Key market trends, growth factors and opportunities
- 5.6.2. Market size and forecast, by region
- 5.6.3. Market share analysis by country
- 5.7. Others
- 5.7.1. Key market trends, growth factors and opportunities
- 5.7.2. Market size and forecast, by region
- 5.7.3. Market share analysis by country
CHAPTER 6: BATTERY TECHNOLOGY MARKET, BY REGION
- 6.1. Overview
- 6.1.1. Market size and forecast By Region
- 6.2. North America
- 6.2.1. Key market trends, growth factors and opportunities
- 6.2.2. Market size and forecast, by Battery Type
- 6.2.3. Market size and forecast, by Application
- 6.2.4. Market size and forecast, by country
- 6.2.4.1. U.S.
- 6.2.4.1.1. Market size and forecast, by Battery Type
- 6.2.4.1.2. Market size and forecast, by Application
- 6.2.4.2. Canada
- 6.2.4.2.1. Market size and forecast, by Battery Type
- 6.2.4.2.2. Market size and forecast, by Application
- 6.2.4.3. Mexico
- 6.2.4.3.1. Market size and forecast, by Battery Type
- 6.2.4.3.2. Market size and forecast, by Application
- 6.3. Europe
- 6.3.1. Key market trends, growth factors and opportunities
- 6.3.2. Market size and forecast, by Battery Type
- 6.3.3. Market size and forecast, by Application
- 6.3.4. Market size and forecast, by country
- 6.3.4.1. Germany
- 6.3.4.1.1. Market size and forecast, by Battery Type
- 6.3.4.1.2. Market size and forecast, by Application
- 6.3.4.2. UK
- 6.3.4.2.1. Market size and forecast, by Battery Type
- 6.3.4.2.2. Market size and forecast, by Application
- 6.3.4.3. France
- 6.3.4.3.1. Market size and forecast, by Battery Type
- 6.3.4.3.2. Market size and forecast, by Application
- 6.3.4.4. Italy
- 6.3.4.4.1. Market size and forecast, by Battery Type
- 6.3.4.4.2. Market size and forecast, by Application
- 6.3.4.5. Spain
- 6.3.4.5.1. Market size and forecast, by Battery Type
- 6.3.4.5.2. Market size and forecast, by Application
- 6.3.4.6. Rest of Europe
- 6.3.4.6.1. Market size and forecast, by Battery Type
- 6.3.4.6.2. Market size and forecast, by Application
- 6.4. Asia-Pacific
- 6.4.1. Key market trends, growth factors and opportunities
- 6.4.2. Market size and forecast, by Battery Type
- 6.4.3. Market size and forecast, by Application
- 6.4.4. Market size and forecast, by country
- 6.4.4.1. China
- 6.4.4.1.1. Market size and forecast, by Battery Type
- 6.4.4.1.2. Market size and forecast, by Application
- 6.4.4.2. Japan
- 6.4.4.2.1. Market size and forecast, by Battery Type
- 6.4.4.2.2. Market size and forecast, by Application
- 6.4.4.3. India
- 6.4.4.3.1. Market size and forecast, by Battery Type
- 6.4.4.3.2. Market size and forecast, by Application
- 6.4.4.4. South Korea
- 6.4.4.4.1. Market size and forecast, by Battery Type
- 6.4.4.4.2. Market size and forecast, by Application
- 6.4.4.5. Australia
- 6.4.4.5.1. Market size and forecast, by Battery Type
- 6.4.4.5.2. Market size and forecast, by Application
- 6.4.4.6. Rest of Asia-Pacific
- 6.4.4.6.1. Market size and forecast, by Battery Type
- 6.4.4.6.2. Market size and forecast, by Application
- 6.5. LAMEA
- 6.5.1. Key market trends, growth factors and opportunities
- 6.5.2. Market size and forecast, by Battery Type
- 6.5.3. Market size and forecast, by Application
- 6.5.4. Market size and forecast, by country
- 6.5.4.1. Brazil
- 6.5.4.1.1. Market size and forecast, by Battery Type
- 6.5.4.1.2. Market size and forecast, by Application
- 6.5.4.2. Saudi Arabia
- 6.5.4.2.1. Market size and forecast, by Battery Type
- 6.5.4.2.2. Market size and forecast, by Application
- 6.5.4.3. South Africa
- 6.5.4.3.1. Market size and forecast, by Battery Type
- 6.5.4.3.2. Market size and forecast, by Application
- 6.5.4.4. Rest of LAMEA
- 6.5.4.4.1. Market size and forecast, by Battery Type
- 6.5.4.4.2. Market size and forecast, by Application
CHAPTER 7: COMPETITIVE LANDSCAPE
- 7.1. Introduction
- 7.2. Top winning strategies
- 7.3. Product mapping of top 10 player
- 7.4. Competitive dashboard
- 7.5. Competitive heatmap
- 7.6. Top player positioning, 2022
CHAPTER 8: COMPANY PROFILES
- 8.1. EXIDE INDUSTRIES LTD.
- 8.1.1. Company overview
- 8.1.2. Key executives
- 8.1.3. Company snapshot
- 8.1.4. Operating business segments
- 8.1.5. Product portfolio
- 8.1.6. Business performance
- 8.2. Hitachi Ltd.
- 8.2.1. Company overview
- 8.2.2. Key executives
- 8.2.3. Company snapshot
- 8.2.4. Operating business segments
- 8.2.5. Product portfolio
- 8.2.6. Business performance
- 8.3. Samsung SDI Co., Ltd.
- 8.3.1. Company overview
- 8.3.2. Key executives
- 8.3.3. Company snapshot
- 8.3.4. Operating business segments
- 8.3.5. Product portfolio
- 8.3.6. Business performance
- 8.4. Sony Corporation
- 8.4.1. Company overview
- 8.4.2. Key executives
- 8.4.3. Company snapshot
- 8.4.4. Operating business segments
- 8.4.5. Product portfolio
- 8.4.6. Business performance
- 8.5. General Electric
- 8.5.1. Company overview
- 8.5.2. Key executives
- 8.5.3. Company snapshot
- 8.5.4. Operating business segments
- 8.5.5. Product portfolio
- 8.5.6. Business performance
- 8.5.7. Key strategic moves and developments
- 8.6. Honda Motor Co., Ltd.
- 8.6.1. Company overview
- 8.6.2. Key executives
- 8.6.3. Company snapshot
- 8.6.4. Operating business segments
- 8.6.5. Product portfolio
- 8.6.6. Business performance
- 8.7. Honeywell International Inc.
- 8.7.1. Company overview
- 8.7.2. Key executives
- 8.7.3. Company snapshot
- 8.7.4. Operating business segments
- 8.7.5. Product portfolio
- 8.7.6. Business performance
- 8.7.7. Key strategic moves and developments
- 8.8. BAK Power Battery Co., Ltd.
- 8.8.1. Company overview
- 8.8.2. Key executives
- 8.8.3. Company snapshot
- 8.8.4. Operating business segments
- 8.8.5. Product portfolio
- 8.9. Fujitsu
- 8.9.1. Company overview
- 8.9.2. Key executives
- 8.9.3. Company snapshot
- 8.9.4. Operating business segments
- 8.9.5. Product portfolio
- 8.9.6. Business performance
- 8.10. American Battery Charging Inc.
- 8.10.1. Company overview
- 8.10.2. Key executives
- 8.10.3. Company snapshot
- 8.10.4. Operating business segments
- 8.10.5. Product portfolio
LIST OF TABLES
- TABLE 01. GLOBAL BATTERY TECHNOLOGY MARKET, BY BATTERY TYPE, 2022-2032 ($MILLION)
- TABLE 02. BATTERY TECHNOLOGY MARKET FOR LEAD ACID BATTERY, BY REGION, 2022-2032 ($MILLION)
- TABLE 03. BATTERY TECHNOLOGY MARKET FOR LITHIUM-ION BATTERY, BY REGION, 2022-2032 ($MILLION)
- TABLE 04. BATTERY TECHNOLOGY MARKET FOR LITHIUM-METAL BATTERY, BY REGION, 2022-2032 ($MILLION)
- TABLE 05. BATTERY TECHNOLOGY MARKET FOR NICKEL CADMIUM BATTERY, BY REGION, 2022-2032 ($MILLION)
- TABLE 06. BATTERY TECHNOLOGY MARKET FOR NICKEL METAL BATTERY, BY REGION, 2022-2032 ($MILLION)
- TABLE 07. BATTERY TECHNOLOGY MARKET FOR OTHERS, BY REGION, 2022-2032 ($MILLION)
- TABLE 08. GLOBAL BATTERY TECHNOLOGY MARKET, BY APPLICATION, 2022-2032 ($MILLION)
- TABLE 09. BATTERY TECHNOLOGY MARKET FOR AUTOMOTIVE INDUSTRY, BY REGION, 2022-2032 ($MILLION)
- TABLE 10. BATTERY TECHNOLOGY MARKET FOR CONSUMER ELECTRONICS, BY REGION, 2022-2032 ($MILLION)
- TABLE 11. BATTERY TECHNOLOGY MARKET FOR RESIDENTIAL AND COMMERCIAL INDUSTRY, BY REGION, 2022-2032 ($MILLION)
- TABLE 12. BATTERY TECHNOLOGY MARKET FOR POWER INDUSTRY, BY REGION, 2022-2032 ($MILLION)
- TABLE 13. BATTERY TECHNOLOGY MARKET FOR DEFENSE AND AVIATION, BY REGION, 2022-2032 ($MILLION)
- TABLE 14. BATTERY TECHNOLOGY MARKET FOR OTHERS, BY REGION, 2022-2032 ($MILLION)
- TABLE 15. BATTERY TECHNOLOGY MARKET, BY REGION, 2022-2032 ($MILLION)
- TABLE 16. NORTH AMERICA BATTERY TECHNOLOGY MARKET, BY BATTERY TYPE, 2022-2032 ($MILLION)
- TABLE 17. NORTH AMERICA BATTERY TECHNOLOGY MARKET, BY APPLICATION, 2022-2032 ($MILLION)
- TABLE 18. NORTH AMERICA BATTERY TECHNOLOGY MARKET, BY COUNTRY, 2022-2032 ($MILLION)
- TABLE 19. U.S. BATTERY TECHNOLOGY MARKET, BY BATTERY TYPE, 2022-2032 ($MILLION)
- TABLE 20. U.S. BATTERY TECHNOLOGY MARKET, BY APPLICATION, 2022-2032 ($MILLION)
- TABLE 21. CANADA BATTERY TECHNOLOGY MARKET, BY BATTERY TYPE, 2022-2032 ($MILLION)
- TABLE 22. CANADA BATTERY TECHNOLOGY MARKET, BY APPLICATION, 2022-2032 ($MILLION)
- TABLE 23. MEXICO BATTERY TECHNOLOGY MARKET, BY BATTERY TYPE, 2022-2032 ($MILLION)
- TABLE 24. MEXICO BATTERY TECHNOLOGY MARKET, BY APPLICATION, 2022-2032 ($MILLION)
- TABLE 25. EUROPE BATTERY TECHNOLOGY MARKET, BY BATTERY TYPE, 2022-2032 ($MILLION)
- TABLE 26. EUROPE BATTERY TECHNOLOGY MARKET, BY APPLICATION, 2022-2032 ($MILLION)
- TABLE 27. EUROPE BATTERY TECHNOLOGY MARKET, BY COUNTRY, 2022-2032 ($MILLION)
- TABLE 28. GERMANY BATTERY TECHNOLOGY MARKET, BY BATTERY TYPE, 2022-2032 ($MILLION)
- TABLE 29. GERMANY BATTERY TECHNOLOGY MARKET, BY APPLICATION, 2022-2032 ($MILLION)
- TABLE 30. UK BATTERY TECHNOLOGY MARKET, BY BATTERY TYPE, 2022-2032 ($MILLION)
- TABLE 31. UK BATTERY TECHNOLOGY MARKET, BY APPLICATION, 2022-2032 ($MILLION)
- TABLE 32. FRANCE BATTERY TECHNOLOGY MARKET, BY BATTERY TYPE, 2022-2032 ($MILLION)
- TABLE 33. FRANCE BATTERY TECHNOLOGY MARKET, BY APPLICATION, 2022-2032 ($MILLION)
- TABLE 34. ITALY BATTERY TECHNOLOGY MARKET, BY BATTERY TYPE, 2022-2032 ($MILLION)
- TABLE 35. ITALY BATTERY TECHNOLOGY MARKET, BY APPLICATION, 2022-2032 ($MILLION)
- TABLE 36. SPAIN BATTERY TECHNOLOGY MARKET, BY BATTERY TYPE, 2022-2032 ($MILLION)
- TABLE 37. SPAIN BATTERY TECHNOLOGY MARKET, BY APPLICATION, 2022-2032 ($MILLION)
- TABLE 38. REST OF EUROPE BATTERY TECHNOLOGY MARKET, BY BATTERY TYPE, 2022-2032 ($MILLION)
- TABLE 39. REST OF EUROPE BATTERY TECHNOLOGY MARKET, BY APPLICATION, 2022-2032 ($MILLION)
- TABLE 40. ASIA-PACIFIC BATTERY TECHNOLOGY MARKET, BY BATTERY TYPE, 2022-2032 ($MILLION)
- TABLE 41. ASIA-PACIFIC BATTERY TECHNOLOGY MARKET, BY APPLICATION, 2022-2032 ($MILLION)
- TABLE 42. ASIA-PACIFIC BATTERY TECHNOLOGY MARKET, BY COUNTRY, 2022-2032 ($MILLION)
- TABLE 43. CHINA BATTERY TECHNOLOGY MARKET, BY BATTERY TYPE, 2022-2032 ($MILLION)
- TABLE 44. CHINA BATTERY TECHNOLOGY MARKET, BY APPLICATION, 2022-2032 ($MILLION)
- TABLE 45. JAPAN BATTERY TECHNOLOGY MARKET, BY BATTERY TYPE, 2022-2032 ($MILLION)
- TABLE 46. JAPAN BATTERY TECHNOLOGY MARKET, BY APPLICATION, 2022-2032 ($MILLION)
- TABLE 47. INDIA BATTERY TECHNOLOGY MARKET, BY BATTERY TYPE, 2022-2032 ($MILLION)
- TABLE 48. INDIA BATTERY TECHNOLOGY MARKET, BY APPLICATION, 2022-2032 ($MILLION)
- TABLE 49. SOUTH KOREA BATTERY TECHNOLOGY MARKET, BY BATTERY TYPE, 2022-2032 ($MILLION)
- TABLE 50. SOUTH KOREA BATTERY TECHNOLOGY MARKET, BY APPLICATION, 2022-2032 ($MILLION)
- TABLE 51. AUSTRALIA BATTERY TECHNOLOGY MARKET, BY BATTERY TYPE, 2022-2032 ($MILLION)
- TABLE 52. AUSTRALIA BATTERY TECHNOLOGY MARKET, BY APPLICATION, 2022-2032 ($MILLION)
- TABLE 53. REST OF ASIA-PACIFIC BATTERY TECHNOLOGY MARKET, BY BATTERY TYPE, 2022-2032 ($MILLION)
- TABLE 54. REST OF ASIA-PACIFIC BATTERY TECHNOLOGY MARKET, BY APPLICATION, 2022-2032 ($MILLION)
- TABLE 55. LAMEA BATTERY TECHNOLOGY MARKET, BY BATTERY TYPE, 2022-2032 ($MILLION)
- TABLE 56. LAMEA BATTERY TECHNOLOGY MARKET, BY APPLICATION, 2022-2032 ($MILLION)
- TABLE 57. LAMEA BATTERY TECHNOLOGY MARKET, BY COUNTRY, 2022-2032 ($MILLION)
- TABLE 58. BRAZIL BATTERY TECHNOLOGY MARKET, BY BATTERY TYPE, 2022-2032 ($MILLION)
- TABLE 59. BRAZIL BATTERY TECHNOLOGY MARKET, BY APPLICATION, 2022-2032 ($MILLION)
- TABLE 60. SAUDI ARABIA BATTERY TECHNOLOGY MARKET, BY BATTERY TYPE, 2022-2032 ($MILLION)
- TABLE 61. SAUDI ARABIA BATTERY TECHNOLOGY MARKET, BY APPLICATION, 2022-2032 ($MILLION)
- TABLE 62. SOUTH AFRICA BATTERY TECHNOLOGY MARKET, BY BATTERY TYPE, 2022-2032 ($MILLION)
- TABLE 63. SOUTH AFRICA BATTERY TECHNOLOGY MARKET, BY APPLICATION, 2022-2032 ($MILLION)
- TABLE 64. REST OF LAMEA BATTERY TECHNOLOGY MARKET, BY BATTERY TYPE, 2022-2032 ($MILLION)
- TABLE 65. REST OF LAMEA BATTERY TECHNOLOGY MARKET, BY APPLICATION, 2022-2032 ($MILLION)
- TABLE 66. EXIDE INDUSTRIES LTD.: KEY EXECUTIVES
- TABLE 67. EXIDE INDUSTRIES LTD.: COMPANY SNAPSHOT
- TABLE 68. EXIDE INDUSTRIES LTD.: PRODUCT SEGMENTS
- TABLE 69. EXIDE INDUSTRIES LTD.: PRODUCT PORTFOLIO
- TABLE 70. HITACHI LTD.: KEY EXECUTIVES
- TABLE 71. HITACHI LTD.: COMPANY SNAPSHOT
- TABLE 72. HITACHI LTD.: SERVICE SEGMENTS
- TABLE 73. HITACHI LTD.: PRODUCT PORTFOLIO
- TABLE 74. SAMSUNG SDI CO., LTD.: KEY EXECUTIVES
- TABLE 75. SAMSUNG SDI CO., LTD.: COMPANY SNAPSHOT
- TABLE 76. SAMSUNG SDI CO., LTD.: PRODUCT SEGMENTS
- TABLE 77. SAMSUNG SDI CO., LTD.: PRODUCT PORTFOLIO
- TABLE 78. SONY CORPORATION: KEY EXECUTIVES
- TABLE 79. SONY CORPORATION: COMPANY SNAPSHOT
- TABLE 80. SONY CORPORATION: SERVICE SEGMENTS
- TABLE 81. SONY CORPORATION: PRODUCT PORTFOLIO
- TABLE 82. GENERAL ELECTRIC: KEY EXECUTIVES
- TABLE 83. GENERAL ELECTRIC: COMPANY SNAPSHOT
- TABLE 84. GENERAL ELECTRIC: PRODUCT SEGMENTS
- TABLE 85. GENERAL ELECTRIC: PRODUCT PORTFOLIO
- TABLE 86. GENERAL ELECTRIC: KEY STRATERGIES
- TABLE 87. HONDA MOTOR CO., LTD.: KEY EXECUTIVES
- TABLE 88. HONDA MOTOR CO., LTD.: COMPANY SNAPSHOT
- TABLE 89. HONDA MOTOR CO., LTD.: PRODUCT SEGMENTS
- TABLE 90. HONDA MOTOR CO., LTD.: PRODUCT PORTFOLIO
- TABLE 91. HONEYWELL INTERNATIONAL INC.: KEY EXECUTIVES
- TABLE 92. HONEYWELL INTERNATIONAL INC.: COMPANY SNAPSHOT
- TABLE 93. HONEYWELL INTERNATIONAL INC.: PRODUCT SEGMENTS
- TABLE 94. HONEYWELL INTERNATIONAL INC.: PRODUCT PORTFOLIO
- TABLE 95. HONEYWELL INTERNATIONAL INC.: KEY STRATERGIES
- TABLE 96. BAK POWER BATTERY CO., LTD.: KEY EXECUTIVES
- TABLE 97. BAK POWER BATTERY CO., LTD.: COMPANY SNAPSHOT
- TABLE 98. BAK POWER BATTERY CO., LTD.: PRODUCT SEGMENTS
- TABLE 99. BAK POWER BATTERY CO., LTD.: PRODUCT PORTFOLIO
- TABLE 100. FUJITSU: KEY EXECUTIVES
- TABLE 101. FUJITSU: COMPANY SNAPSHOT
- TABLE 102. FUJITSU: SERVICE SEGMENTS
- TABLE 103. FUJITSU: PRODUCT PORTFOLIO
- TABLE 104. AMERICAN BATTERY CHARGING INC.: KEY EXECUTIVES
- TABLE 105. AMERICAN BATTERY CHARGING INC.: COMPANY SNAPSHOT
- TABLE 106. AMERICAN BATTERY CHARGING INC.: PRODUCT SEGMENTS
- TABLE 107. AMERICAN BATTERY CHARGING INC.: PRODUCT PORTFOLIO
LIST OF FIGURES
- FIGURE 01. BATTERY TECHNOLOGY MARKET, 2022-2032
- FIGURE 02. SEGMENTATION OF BATTERY TECHNOLOGY MARKET,2022-2032
- FIGURE 03. TOP IMPACTING FACTORS IN BATTERY TECHNOLOGY MARKET (2022 TO 2032)
- FIGURE 04. TOP INVESTMENT POCKETS IN BATTERY TECHNOLOGY MARKET (2023-2032)
- FIGURE 05. LOW BARGAINING POWER OF SUPPLIERS
- FIGURE 06. LOW THREAT OF NEW ENTRANTS
- FIGURE 07. LOW THREAT OF SUBSTITUTES
- FIGURE 08. LOW INTENSITY OF RIVALRY
- FIGURE 09. LOW BARGAINING POWER OF BUYERS
- FIGURE 10. GLOBAL BATTERY TECHNOLOGY MARKET:DRIVERS, RESTRAINTS AND OPPORTUNITIES
- FIGURE 11. PATENT ANALYSIS BY COMPANY
- FIGURE 12. PATENT ANALYSIS BY COUNTRY
- FIGURE 13. BATTERY TECHNOLOGY MARKET, BY BATTERY TYPE, 2022 AND 2032(%)
- FIGURE 14. COMPARATIVE SHARE ANALYSIS OF BATTERY TECHNOLOGY MARKET FOR LEAD ACID BATTERY, BY COUNTRY 2022 AND 2032(%)
- FIGURE 15. COMPARATIVE SHARE ANALYSIS OF BATTERY TECHNOLOGY MARKET FOR LITHIUM-ION BATTERY, BY COUNTRY 2022 AND 2032(%)
- FIGURE 16. COMPARATIVE SHARE ANALYSIS OF BATTERY TECHNOLOGY MARKET FOR LITHIUM-METAL BATTERY, BY COUNTRY 2022 AND 2032(%)
- FIGURE 17. COMPARATIVE SHARE ANALYSIS OF BATTERY TECHNOLOGY MARKET FOR NICKEL CADMIUM BATTERY, BY COUNTRY 2022 AND 2032(%)
- FIGURE 18. COMPARATIVE SHARE ANALYSIS OF BATTERY TECHNOLOGY MARKET FOR NICKEL METAL BATTERY, BY COUNTRY 2022 AND 2032(%)
- FIGURE 19. COMPARATIVE SHARE ANALYSIS OF BATTERY TECHNOLOGY MARKET FOR OTHERS, BY COUNTRY 2022 AND 2032(%)
- FIGURE 20. BATTERY TECHNOLOGY MARKET, BY APPLICATION, 2022 AND 2032(%)
- FIGURE 21. COMPARATIVE SHARE ANALYSIS OF BATTERY TECHNOLOGY MARKET FOR AUTOMOTIVE INDUSTRY, BY COUNTRY 2022 AND 2032(%)
- FIGURE 22. COMPARATIVE SHARE ANALYSIS OF BATTERY TECHNOLOGY MARKET FOR CONSUMER ELECTRONICS, BY COUNTRY 2022 AND 2032(%)
- FIGURE 23. COMPARATIVE SHARE ANALYSIS OF BATTERY TECHNOLOGY MARKET FOR RESIDENTIAL AND COMMERCIAL INDUSTRY, BY COUNTRY 2022 AND 2032(%)
- FIGURE 24. COMPARATIVE SHARE ANALYSIS OF BATTERY TECHNOLOGY MARKET FOR POWER INDUSTRY, BY COUNTRY 2022 AND 2032(%)
- FIGURE 25. COMPARATIVE SHARE ANALYSIS OF BATTERY TECHNOLOGY MARKET FOR DEFENSE AND AVIATION, BY COUNTRY 2022 AND 2032(%)
- FIGURE 26. COMPARATIVE SHARE ANALYSIS OF BATTERY TECHNOLOGY MARKET FOR OTHERS, BY COUNTRY 2022 AND 2032(%)
- FIGURE 27. BATTERY TECHNOLOGY MARKET BY REGION, 2022 AND 2032(%)
- FIGURE 28. U.S. BATTERY TECHNOLOGY MARKET, 2022-2032 ($MILLION)
- FIGURE 29. CANADA BATTERY TECHNOLOGY MARKET, 2022-2032 ($MILLION)
- FIGURE 30. MEXICO BATTERY TECHNOLOGY MARKET, 2022-2032 ($MILLION)
- FIGURE 31. GERMANY BATTERY TECHNOLOGY MARKET, 2022-2032 ($MILLION)
- FIGURE 32. UK BATTERY TECHNOLOGY MARKET, 2022-2032 ($MILLION)
- FIGURE 33. FRANCE BATTERY TECHNOLOGY MARKET, 2022-2032 ($MILLION)
- FIGURE 34. ITALY BATTERY TECHNOLOGY MARKET, 2022-2032 ($MILLION)
- FIGURE 35. SPAIN BATTERY TECHNOLOGY MARKET, 2022-2032 ($MILLION)
- FIGURE 36. REST OF EUROPE BATTERY TECHNOLOGY MARKET, 2022-2032 ($MILLION)
- FIGURE 37. CHINA BATTERY TECHNOLOGY MARKET, 2022-2032 ($MILLION)
- FIGURE 38. JAPAN BATTERY TECHNOLOGY MARKET, 2022-2032 ($MILLION)
- FIGURE 39. INDIA BATTERY TECHNOLOGY MARKET, 2022-2032 ($MILLION)
- FIGURE 40. SOUTH KOREA BATTERY TECHNOLOGY MARKET, 2022-2032 ($MILLION)
- FIGURE 41. AUSTRALIA BATTERY TECHNOLOGY MARKET, 2022-2032 ($MILLION)
- FIGURE 42. REST OF ASIA-PACIFIC BATTERY TECHNOLOGY MARKET, 2022-2032 ($MILLION)
- FIGURE 43. BRAZIL BATTERY TECHNOLOGY MARKET, 2022-2032 ($MILLION)
- FIGURE 44. SAUDI ARABIA BATTERY TECHNOLOGY MARKET, 2022-2032 ($MILLION)
- FIGURE 45. SOUTH AFRICA BATTERY TECHNOLOGY MARKET, 2022-2032 ($MILLION)
- FIGURE 46. REST OF LAMEA BATTERY TECHNOLOGY MARKET, 2022-2032 ($MILLION)
- FIGURE 47. TOP WINNING STRATEGIES, BY YEAR (2021-2023)
- FIGURE 48. TOP WINNING STRATEGIES, BY DEVELOPMENT (2021-2023)
- FIGURE 49. TOP WINNING STRATEGIES, BY COMPANY (2021-2023)
- FIGURE 50. PRODUCT MAPPING OF TOP 10 PLAYERS
- FIGURE 51. COMPETITIVE DASHBOARD
- FIGURE 52. COMPETITIVE HEATMAP: BATTERY TECHNOLOGY MARKET
- FIGURE 53. TOP PLAYER POSITIONING, 2022
- FIGURE 54. EXIDE INDUSTRIES LTD.: NET REVENUE, 2020-2022 ($MILLION)
- FIGURE 55. EXIDE INDUSTRIES LTD.: RESEARCH & DEVELOPMENT EXPENDITURE, 2020-2022 ($MILLION)
- FIGURE 56. EXIDE INDUSTRIES LTD.: REVENUE SHARE BY REGION, 2022 (%)
- FIGURE 57. EXIDE INDUSTRIES LTD.: REVENUE SHARE BY SEGMENT, 2022 (%)
- FIGURE 58. HITACHI LTD.: NET REVENUE, 2020-2022 ($MILLION)
- FIGURE 59. HITACHI LTD.: REVENUE SHARE BY REGION, 2022 (%)
- FIGURE 60. SAMSUNG SDI CO., LTD.: RESEARCH & DEVELOPMENT EXPENDITURE, 2020-2022 ($MILLION)
- FIGURE 61. SAMSUNG SDI CO., LTD.: NET SALES, 2020-2022 ($MILLION)
- FIGURE 62. SAMSUNG SDI CO., LTD.: REVENUE SHARE BY SEGMENT, 2022 (%)
- FIGURE 63. SAMSUNG SDI CO., LTD.: REVENUE SHARE BY REGION, 2022 (%)
- FIGURE 64. SONY CORPORATION: NET REVENUE, 2020-2022 ($MILLION)
- FIGURE 65. SONY CORPORATION: REVENUE SHARE BY SEGMENT, 2022 (%)
- FIGURE 66. SONY CORPORATION: REVENUE SHARE BY REGION, 2022 (%)
- FIGURE 67. GENERAL ELECTRIC: NET REVENUE, 2020-2022 ($MILLION)
- FIGURE 68. GENERAL ELECTRIC: RESEARCH & DEVELOPMENT EXPENDITURE, 2020-2022 ($MILLION)
- FIGURE 69. GENERAL ELECTRIC: REVENUE SHARE BY SEGMENT, 2022 (%)
- FIGURE 70. GENERAL ELECTRIC: REVENUE SHARE BY REGION, 2022 (%)
- FIGURE 71. HONDA MOTOR CO., LTD.: NET REVENUE, 2020-2022 ($MILLION)
- FIGURE 72. HONDA MOTOR CO., LTD.: RESEARCH & DEVELOPMENT EXPENDITURE, 2020-2022 ($MILLION)
- FIGURE 73. HONDA MOTOR CO., LTD.: REVENUE SHARE BY REGION, 2022 (%)
- FIGURE 74. HONEYWELL INTERNATIONAL INC.: NET REVENUE, 2020-2022 ($MILLION)
- FIGURE 75. HONEYWELL INTERNATIONAL INC.: REVENUE SHARE BY SEGMENT, 2022 (%)
- FIGURE 76. HONEYWELL INTERNATIONAL INC.: REVENUE SHARE BY REGION, 2022 (%)
- FIGURE 77. FUJITSU: NET REVENUE, 2020-2022 ($MILLION)
- FIGURE 78. FUJITSU: RESEARCH & DEVELOPMENT EXPENDITURE, 2020-2022 ($MILLION)
- FIGURE 79. FUJITSU: REVENUE SHARE BY SEGMENT, 2022 (%)
- FIGURE 80. FUJITSU: REVENUE SHARE BY REGION, 2022 (%)


