


 |
市場調查報告書
商品編碼
1414798
PoE交換器市場:按類型、連接埠數量和最終用途分類:2023-2032 年全球機會分析和產業預測PoE Switches Market By Type, By Port Count, By End Use : Global Opportunity Analysis and Industry Forecast, 2023-2032 |
||||||
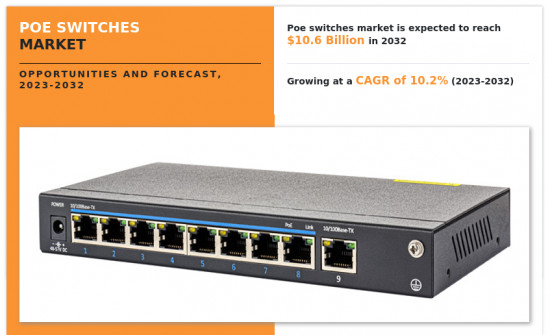
2022年PoE交換器市場規模為40億美元,預計2032年將達106億美元,2023年至2032年複合年成長率為10.2%。
乙太網路供電 (PoE) 是一種存取層技術,它將資料訊號和電源組合到單一乙太網路電纜連接中,從而允許從遠端位置操作受電設備。由於 PoE 透過雙絞線電纜運行,因此可以快速安裝在難以獲得電源的位置。
資料訊號功能可讓您透過監控 PoE 和裝置狀態以及在交換器和受電設備之間共用資訊來管理傳輸到遠端設備的電量。
PoE交換器為網路設備提供 PoE 電源,例如:
1網路基地台、監視錄影機、IP 電話、照明和其他物聯網設備。 PoE交換器通常可以優先考慮並最佳化關鍵網路設備的 PoE 功率分配。
雲端基礎的網路管理解決方案的日益普及也是 PoE(乙太網路供電)交換器市場的促進因素。這些雲端基礎的解決方案提供網路資源(包括 PoE交換器)的集中可見性和控制,簡化管理流程並實現即時故障排除。例如,擁有多家商店的大型零售連鎖店可以使用雲端基礎的網路管理來監控和控制所有商店的 PoE交換器。這種集中管理允許網路管理員遠端控制交換器、追蹤電源使用情況並解決問題。這種策略不僅提高了效率,還減少了網路維護時間和成本。隨著越來越多的企業尋求擴充性的網路解決方案,雲端基礎的網路管理的便利性和有效性正在推動市場發展,PoE交換器的使用在各行業中不斷增加。
然而,使用乙太網路供電 (PoE)交換器需要專門的佈線,這是市場的抑制因素。 PoE交換器需要特定類型的乙太網路電纜,例如:
1 Cat5e 或 Cat6 用於高效傳輸電力和資料。此要求可能會導致額外的成本和安裝注意事項。例如,考慮將小型企業升級到基於 PoE 的網路系統。如果您現有的基礎設施使用較舊或較低等級的電纜,您將需要用 Cat5e 或 Cat6 電纜替換它們,以確保與 PoE交換器的兼容性。這種更換不僅會產生更高等級電纜的額外成本,而且還需要更廣泛的安裝工作。這些因素構成了重大障礙,特別是對於中小型企業或預算有限的企業來說,並限制了 PoE 技術在各種環境中的廣泛採用。
乙太網路供電 (PoE) 在新興應用中的採用為 PoE交換器市場帶來了新的成長機會。例如,考慮在室外無線設備中使用 PoE,例如城市範圍的 Wi-Fi 網路或監控系統。在此類設定中,PoE交換器可以為室外網路基地台和攝影機供電並連接它們,從而無需單獨的電源線並降低安裝複雜性。這在電力接入受限的惡劣環境中尤其有利。在汽車網路中,PoE 對於為大眾交通工具系統中的攝影機、Wi-Fi 路由器和感測器等設備供電以及實現整合連接和監控解決方案至關重要。這種部署的彈性和簡單性使 PoE 解決方案對此類創新應用越來越有吸引力,從而推動了對 PoE交換器的需求。
PoE交換器市場按類型、連接埠數量、最終用途和地區進行細分。按類型分類,市場分為託管 PoE交換器和非託管 PoE交換器。按連接埠數細分為4-8連接埠、9-16連接埠、17-24連接埠、25-48連接埠、48連接埠以上。依最終用途分類,PoE交換器市場分為商業、工業和住宅。依地區分類,以下地區為北美(美國、加拿大、墨西哥)、歐洲(英國、德國、法國其他歐洲國家地區)、亞太地區(中國、日本、印度、韓國等亞太地區)地區)、拉丁美洲(中南美洲、中東),非洲)。
目錄
第1章簡介
第 2 章執行摘要
第3章市場概況
- 市場定義和範圍
- 主要發現
- 影響因素
- 主要投資機會
- 波特五力分析
- 市場動態
- 促進因素
- 基於 IP 的設備的採用率不斷提高
- 集中電源管理的需要
- 對智慧家庭設備的需求增加
- 抑制因素
- 初始成本增加
- 機會
- 開發創新的 PoE 應用
- 促進因素
第 4 章 PoE交換器市場:按類型
- 概述
- 網管型PoE交換器
- 非網管型 PoE交換器
第 5 章 PoE交換器市場:按連接埠數量
- 概述
- 4-8個端口
- 9-16端口
- 17-24端口
- 25-48端口
- 48個或更多端口
第 6 章 PoE交換器市場:依最終用途
- 概述
- 住宅
- 商業的
- 工業的
第 7 章 PoE交換器市場:按地區
- 概述
- 北美洲
- 美國
- 加拿大
- 墨西哥
- 歐洲
- 英國
- 德國
- 法國
- 其他
- 亞太地區
- 中國
- 日本
- 印度
- 韓國
- 其他
- 拉丁美洲
- 拉丁美洲
- 中東
- 非洲
第8章 競爭形勢
- 介紹
- 關鍵成功策略
- 10家主要企業產品圖譜
- 競爭對手儀表板
- 競爭熱圖
- 2022年主要企業定位
第9章 公司簡介
- Advantech Co., Ltd.
- Allied Telesis, Inc.
- Broadcom Inc.
- Cisco Systems, Inc.
- Digi-Key Corporation
- D-Link Corporation
- Maiwe Communication
- Netgear Inc.
- Patton LLC
- TP-Link Corporation Limited
According to a new report published by Allied Market Research, titled, "PoE Switches Market," The PoE switches market was valued at $4 billion in 2022, and is estimated to reach $10.6 billion by 2032, growing at a CAGR of 10.2% from 2023 to 2032.
Power over Ethernet (PoE) is an access layer technology that combines data signals and electrical power into a single Ethernet cable connection to enable remote powered device operation. PoE runs over twisted pair cabling which can be quickly installed, often in difficult to reach locations where pulling electrical power is not feasible.
Using the data signal capabilities, PoE and device status can be monitored, and information shared between a switch and powered device in order to manage the amount of power delivered to the remote device.
A PoE switch provides PoE power to network devices such as access points, surveillance cameras, IP phones, lighting, and other IoT devices. PoE switches often are capable of prioritizing and optimizing PoE power allocations for critical network devices.
The growing adoption of cloud-based network management solutions is another driver for the PoE (Power over Ethernet) switches market. These cloud-based solutions provide centralized visibility and control over network resources, including PoE switches, simplifying the management process and enabling real-time troubleshooting. For instance, in a large retail chain with multiple stores, cloud-based network management can be used to monitor and control PoE switches across all locations. This centralized management enables network administrators to Control switches remotely, track power utilization, and solve problems from a single location, eliminating the need for physical visits to each location. This strategy not only boosts efficiency but also cuts down on the time and expenses related to network maintenance. The market is being driven by the convenience and effectiveness of cloud-based network management and the rising use of PoE switches in different industries, as more organizations look for efficient and expandable network solutions.
However, the need for specialized cabling in the use of Power over Ethernet (PoE) switches poses a restraint for their market. PoE switches require certain types of Ethernet cables, such as Cat5e or Cat6, to effectively carry both power and data. This requirement can lead to additional expenses and considerations in installation. For example, consider a small business upgrading to a PoE-based network system. If their existing infrastructure is equipped with older or lower-grade cabling, they would need to replace it with Cat5e or Cat6 cables to ensure compatibility with PoE switches. This replacement not only incurs extra costs for the higher-grade cables but also demands more extensive installation work. Such factors can be a significant barrier, particularly for smaller enterprises or those with constrained budgets, thereby limiting the broader adoption of PoE technology in various settings.
The adoption of Power over Ethernet (PoE) in emerging applications opens new growth opportunities for the PoE switches market. For instance, consider the use of PoE in outdoor wireless deployments like city-wide Wi-Fi networks or surveillance systems. In such setups, PoE switches can power and connect outdoor access points and cameras, eliminating the need for separate power cables and reducing installation complexities. This is particularly advantageous in challenging environments where power access is limited. For in-vehicle networking, PoE can be crucial in powering devices like cameras, Wi-Fi routers, and sensors in public transportation systems, enabling integrated connectivity and surveillance solutions. This flexibility and simplification in deployment make PoE solutions increasingly attractive for such innovative applications, driving the demand for PoE switches.
The PoE switches market is segmented on the basis of type, port count, end use, and region. By type, the market is bifurcated into managed PoE switches and unmanaged PoE switches. By port count, the market is fragmented into 4-8 ports, 9-16 ports, 17-24 ports, 25-48 ports, and above 48 ports. By end use, the PoE switches market is divided into commercial, industrial, residential. By region, the PoE switches industry is analyzed across North America (the U.S., Canada, and Mexico), Europe (the UK, Germany, France, and rest of Europe), Asia-Pacific (China, Japan, India, South Korea, and rest of Asia-Pacific) and LAMEA (Latin America, Middle East, and Africa).
The Major companies profiled in the report include: Advantech Co., Ltd., Allied Telesis, Inc., Broadcom Inc., Cisco Systems, Inc., Digi-Key Corporation, D-Link Corporation, Maiwe Communication, Netgear Inc., Patton LLC, TP-Link Corporation Limited.
Key Benefits For Stakeholders
- This report provides a quantitative analysis of the market segments, current trends, estimations, and dynamics of the poe switches market analysis from 2022 to 2032 to identify the prevailing poe switches market opportunities.
- The market research is offered along with information related to key drivers, restraints, and opportunities.
- Porter's five forces analysis highlights the potency of buyers and suppliers to enable stakeholders make profit-oriented business decisions and strengthen their supplier-buyer network.
- In-depth analysis of the poe switches market segmentation assists to determine the prevailing market opportunities.
- Major countries in each region are mapped according to their revenue contribution to the global market.
- Market player positioning facilitates benchmarking and provides a clear understanding of the present position of the market players.
- The report includes the analysis of the regional as well as global poe switches market trends, key players, market segments, application areas, and market growth strategies.
Additional benefits you will get with this purchase are:
- Quarterly Update and* (only available with a corporate license, on listed price)
- 5 additional Company Profile of client Choice pre- or Post-purchase, as a free update.
- Free Upcoming Version on the Purchase of Five and Enterprise User License.
- 16 analyst hours of support* (post-purchase, if you find additional data requirements upon review of the report, you may receive support amounting to 16 analyst hours to solve questions, and post-sale queries)
- 15% Free Customization* (in case the scope or segment of the report does not match your requirements, 15% is equivalent to 3 working days of free work, applicable once)
- Free data Pack on the Five and Enterprise User License. (Excel version of the report)
- Free Updated report if the report is 6-12 months old or older.
- 24-hour priority response*
- Free Industry updates and white papers.
Possible Customization with this report (with additional cost and timeline, please talk to the sales executive to know more)
- Product Benchmarking / Product specification and applications
- Product Life Cycles
- Supply Chain Analysis & Vendor Margins
- Upcoming/New Entrant by Regions
- Market share analysis of players by products/segments
- New Product Development/ Product Matrix of Key Players
- Additional company profiles with specific to client's interest
- Additional country or region analysis- market size and forecast
- Expanded list for Company Profiles
- Historic market data
- Key player details (including location, contact details, supplier/vendor network etc. in excel format)
- Market share analysis of players at global/region/country level
Key Market Segments
By End Use
- Residential
- Commercial
- Industrial
By Type
- managed PoE switches
- unmanaged PoE switches
By Port Count
- 4-8 ports
- 9-16 ports
- 17-24 ports
- 25-48 ports
- 48 above
By Region
- North America
- U.S.
- Canada
- Mexico
- Europe
- UK
- Germany
- France
- Rest of Europe
- Asia-Pacific
- China
- Japan
- India
- South Korea
- Rest of Asia-Pacific
- LAMEA
- Latin America
- Middle East
- Africa
Key Market Players:
- Digi-Key Corporation
- Maiwe Communication
- Patton LLC
- Advantech Co., Ltd.
- Allied Telesis, Inc.
- Broadcom Inc.
- Cisco Systems, Inc.
- D-Link Corporation
- Netgear Inc.
- TP-Link Corporation Limited
TABLE OF CONTENTS
CHAPTER 1: INTRODUCTION
- 1.1. Report description
- 1.2. Key market segments
- 1.3. Key benefits to the stakeholders
- 1.4. Research methodology
- 1.4.1. Primary research
- 1.4.2. Secondary research
- 1.4.3. Analyst tools and models
CHAPTER 2: EXECUTIVE SUMMARY
- 2.1. CXO Perspective
CHAPTER 3: MARKET OVERVIEW
- 3.1. Market definition and scope
- 3.2. Key findings
- 3.2.1. Top impacting factors
- 3.2.2. Top investment pockets
- 3.3. Porter's five forces analysis
- 3.3.1. Moderate bargaining power of suppliers
- 3.3.2. Moderate threat of new entrants
- 3.3.3. Low to moderate threat of substitutes
- 3.3.4. High intensity of rivalry
- 3.3.5. Moderate to high bargaining power of buyers
- 3.4. Market dynamics
- 3.4.1. Drivers
- 3.4.1.1. Increase in adoption of IP-based devices
- 3.4.1.2. Need for centralized power management
- 3.4.1.3. Rising demand for smart home devices
- 3.4.2. Restraints
- 3.4.2.1. Higher initial cost
- 3.4.3. Opportunities
- 3.4.3.1. Development of innovative PoE applications
- 3.4.1. Drivers
CHAPTER 4: POE SWITCHES MARKET, BY TYPE
- 4.1. Overview
- 4.1.1. Market size and forecast
- 4.2. managed PoE switches
- 4.2.1. Key market trends, growth factors and opportunities
- 4.2.2. Market size and forecast, by region
- 4.2.3. Market share analysis by country
- 4.3. unmanaged PoE switches
- 4.3.1. Key market trends, growth factors and opportunities
- 4.3.2. Market size and forecast, by region
- 4.3.3. Market share analysis by country
CHAPTER 5: POE SWITCHES MARKET, BY PORT COUNT
- 5.1. Overview
- 5.1.1. Market size and forecast
- 5.2. 4-8 ports
- 5.2.1. Key market trends, growth factors and opportunities
- 5.2.2. Market size and forecast, by region
- 5.2.3. Market share analysis by country
- 5.3. 9-16 ports
- 5.3.1. Key market trends, growth factors and opportunities
- 5.3.2. Market size and forecast, by region
- 5.3.3. Market share analysis by country
- 5.4. 17-24 ports
- 5.4.1. Key market trends, growth factors and opportunities
- 5.4.2. Market size and forecast, by region
- 5.4.3. Market share analysis by country
- 5.5. 25-48 ports
- 5.5.1. Key market trends, growth factors and opportunities
- 5.5.2. Market size and forecast, by region
- 5.5.3. Market share analysis by country
- 5.6. 48 above
- 5.6.1. Key market trends, growth factors and opportunities
- 5.6.2. Market size and forecast, by region
- 5.6.3. Market share analysis by country
CHAPTER 6: POE SWITCHES MARKET, BY END USE
- 6.1. Overview
- 6.1.1. Market size and forecast
- 6.2. Residential
- 6.2.1. Key market trends, growth factors and opportunities
- 6.2.2. Market size and forecast, by region
- 6.2.3. Market share analysis by country
- 6.3. Commercial
- 6.3.1. Key market trends, growth factors and opportunities
- 6.3.2. Market size and forecast, by region
- 6.3.3. Market share analysis by country
- 6.4. Industrial
- 6.4.1. Key market trends, growth factors and opportunities
- 6.4.2. Market size and forecast, by region
- 6.4.3. Market share analysis by country
CHAPTER 7: POE SWITCHES MARKET, BY REGION
- 7.1. Overview
- 7.1.1. Market size and forecast By Region
- 7.2. North America
- 7.2.1. Key market trends, growth factors and opportunities
- 7.2.2. Market size and forecast, by Type
- 7.2.3. Market size and forecast, by Port Count
- 7.2.4. Market size and forecast, by End Use
- 7.2.5. Market size and forecast, by country
- 7.2.5.1. U.S.
- 7.2.5.1.1. Market size and forecast, by Type
- 7.2.5.1.2. Market size and forecast, by Port Count
- 7.2.5.1.3. Market size and forecast, by End Use
- 7.2.5.2. Canada
- 7.2.5.2.1. Market size and forecast, by Type
- 7.2.5.2.2. Market size and forecast, by Port Count
- 7.2.5.2.3. Market size and forecast, by End Use
- 7.2.5.3. Mexico
- 7.2.5.3.1. Market size and forecast, by Type
- 7.2.5.3.2. Market size and forecast, by Port Count
- 7.2.5.3.3. Market size and forecast, by End Use
- 7.3. Europe
- 7.3.1. Key market trends, growth factors and opportunities
- 7.3.2. Market size and forecast, by Type
- 7.3.3. Market size and forecast, by Port Count
- 7.3.4. Market size and forecast, by End Use
- 7.3.5. Market size and forecast, by country
- 7.3.5.1. UK
- 7.3.5.1.1. Market size and forecast, by Type
- 7.3.5.1.2. Market size and forecast, by Port Count
- 7.3.5.1.3. Market size and forecast, by End Use
- 7.3.5.2. Germany
- 7.3.5.2.1. Market size and forecast, by Type
- 7.3.5.2.2. Market size and forecast, by Port Count
- 7.3.5.2.3. Market size and forecast, by End Use
- 7.3.5.3. France
- 7.3.5.3.1. Market size and forecast, by Type
- 7.3.5.3.2. Market size and forecast, by Port Count
- 7.3.5.3.3. Market size and forecast, by End Use
- 7.3.5.4. Rest of Europe
- 7.3.5.4.1. Market size and forecast, by Type
- 7.3.5.4.2. Market size and forecast, by Port Count
- 7.3.5.4.3. Market size and forecast, by End Use
- 7.4. Asia-Pacific
- 7.4.1. Key market trends, growth factors and opportunities
- 7.4.2. Market size and forecast, by Type
- 7.4.3. Market size and forecast, by Port Count
- 7.4.4. Market size and forecast, by End Use
- 7.4.5. Market size and forecast, by country
- 7.4.5.1. China
- 7.4.5.1.1. Market size and forecast, by Type
- 7.4.5.1.2. Market size and forecast, by Port Count
- 7.4.5.1.3. Market size and forecast, by End Use
- 7.4.5.2. Japan
- 7.4.5.2.1. Market size and forecast, by Type
- 7.4.5.2.2. Market size and forecast, by Port Count
- 7.4.5.2.3. Market size and forecast, by End Use
- 7.4.5.3. India
- 7.4.5.3.1. Market size and forecast, by Type
- 7.4.5.3.2. Market size and forecast, by Port Count
- 7.4.5.3.3. Market size and forecast, by End Use
- 7.4.5.4. South Korea
- 7.4.5.4.1. Market size and forecast, by Type
- 7.4.5.4.2. Market size and forecast, by Port Count
- 7.4.5.4.3. Market size and forecast, by End Use
- 7.4.5.5. Rest of Asia-Pacific
- 7.4.5.5.1. Market size and forecast, by Type
- 7.4.5.5.2. Market size and forecast, by Port Count
- 7.4.5.5.3. Market size and forecast, by End Use
- 7.5. LAMEA
- 7.5.1. Key market trends, growth factors and opportunities
- 7.5.2. Market size and forecast, by Type
- 7.5.3. Market size and forecast, by Port Count
- 7.5.4. Market size and forecast, by End Use
- 7.5.5. Market size and forecast, by country
- 7.5.5.1. Latin America
- 7.5.5.1.1. Market size and forecast, by Type
- 7.5.5.1.2. Market size and forecast, by Port Count
- 7.5.5.1.3. Market size and forecast, by End Use
- 7.5.5.2. Middle East
- 7.5.5.2.1. Market size and forecast, by Type
- 7.5.5.2.2. Market size and forecast, by Port Count
- 7.5.5.2.3. Market size and forecast, by End Use
- 7.5.5.3. Africa
- 7.5.5.3.1. Market size and forecast, by Type
- 7.5.5.3.2. Market size and forecast, by Port Count
- 7.5.5.3.3. Market size and forecast, by End Use
CHAPTER 8: COMPETITIVE LANDSCAPE
- 8.1. Introduction
- 8.2. Top winning strategies
- 8.3. Product mapping of top 10 player
- 8.4. Competitive dashboard
- 8.5. Competitive heatmap
- 8.6. Top player positioning, 2022
CHAPTER 9: COMPANY PROFILES
- 9.1. Advantech Co., Ltd.
- 9.1.1. Company overview
- 9.1.2. Key executives
- 9.1.3. Company snapshot
- 9.1.4. Operating business segments
- 9.1.5. Product portfolio
- 9.1.6. Business performance
- 9.1.7. Key strategic moves and developments
- 9.2. Allied Telesis, Inc.
- 9.2.1. Company overview
- 9.2.2. Key executives
- 9.2.3. Company snapshot
- 9.2.4. Operating business segments
- 9.2.5. Product portfolio
- 9.2.6. Business performance
- 9.2.7. Key strategic moves and developments
- 9.3. Broadcom Inc.
- 9.3.1. Company overview
- 9.3.2. Key executives
- 9.3.3. Company snapshot
- 9.3.4. Operating business segments
- 9.3.5. Product portfolio
- 9.3.6. Business performance
- 9.4. Cisco Systems, Inc.
- 9.4.1. Company overview
- 9.4.2. Key executives
- 9.4.3. Company snapshot
- 9.4.4. Operating business segments
- 9.4.5. Product portfolio
- 9.4.6. Business performance
- 9.5. Digi-Key Corporation
- 9.5.1. Company overview
- 9.5.2. Key executives
- 9.5.3. Company snapshot
- 9.5.4. Operating business segments
- 9.5.5. Product portfolio
- 9.5.6. Key strategic moves and developments
- 9.6. D-Link Corporation
- 9.6.1. Company overview
- 9.6.2. Key executives
- 9.6.3. Company snapshot
- 9.6.4. Operating business segments
- 9.6.5. Product portfolio
- 9.6.6. Business performance
- 9.7. Maiwe Communication
- 9.7.1. Company overview
- 9.7.2. Key executives
- 9.7.3. Company snapshot
- 9.7.4. Operating business segments
- 9.7.5. Product portfolio
- 9.8. Netgear Inc.
- 9.8.1. Company overview
- 9.8.2. Key executives
- 9.8.3. Company snapshot
- 9.8.4. Operating business segments
- 9.8.5. Product portfolio
- 9.8.6. Business performance
- 9.8.7. Key strategic moves and developments
- 9.9. Patton LLC
- 9.9.1. Company overview
- 9.9.2. Key executives
- 9.9.3. Company snapshot
- 9.9.4. Operating business segments
- 9.9.5. Product portfolio
- 9.9.6. Key strategic moves and developments
- 9.10. TP-Link Corporation Limited
- 9.10.1. Company overview
- 9.10.2. Key executives
- 9.10.3. Company snapshot
- 9.10.4. Operating business segments
- 9.10.5. Product portfolio
- 9.10.6. Key strategic moves and developments
LIST OF TABLES
- TABLE 01. GLOBAL POE SWITCHES MARKET, BY TYPE, 2022-2032 ($MILLION)
- TABLE 02. POE SWITCHES MARKET FOR MANAGED POE SWITCHES, BY REGION, 2022-2032 ($MILLION)
- TABLE 03. POE SWITCHES MARKET FOR UNMANAGED POE SWITCHES, BY REGION, 2022-2032 ($MILLION)
- TABLE 04. GLOBAL POE SWITCHES MARKET, BY PORT COUNT, 2022-2032 ($MILLION)
- TABLE 05. POE SWITCHES MARKET FOR 4-8 PORTS, BY REGION, 2022-2032 ($MILLION)
- TABLE 06. POE SWITCHES MARKET FOR 9-16 PORTS, BY REGION, 2022-2032 ($MILLION)
- TABLE 07. POE SWITCHES MARKET FOR 17-24 PORTS, BY REGION, 2022-2032 ($MILLION)
- TABLE 08. POE SWITCHES MARKET FOR 25-48 PORTS, BY REGION, 2022-2032 ($MILLION)
- TABLE 09. POE SWITCHES MARKET FOR 48 ABOVE, BY REGION, 2022-2032 ($MILLION)
- TABLE 10. GLOBAL POE SWITCHES MARKET, BY END USE, 2022-2032 ($MILLION)
- TABLE 11. POE SWITCHES MARKET FOR RESIDENTIAL, BY REGION, 2022-2032 ($MILLION)
- TABLE 12. POE SWITCHES MARKET FOR COMMERCIAL, BY REGION, 2022-2032 ($MILLION)
- TABLE 13. POE SWITCHES MARKET FOR INDUSTRIAL, BY REGION, 2022-2032 ($MILLION)
- TABLE 14. POE SWITCHES MARKET, BY REGION, 2022-2032 ($MILLION)
- TABLE 15. NORTH AMERICA POE SWITCHES MARKET, BY TYPE, 2022-2032 ($MILLION)
- TABLE 16. NORTH AMERICA POE SWITCHES MARKET, BY PORT COUNT, 2022-2032 ($MILLION)
- TABLE 17. NORTH AMERICA POE SWITCHES MARKET, BY END USE, 2022-2032 ($MILLION)
- TABLE 18. NORTH AMERICA POE SWITCHES MARKET, BY COUNTRY, 2022-2032 ($MILLION)
- TABLE 19. U.S. POE SWITCHES MARKET, BY TYPE, 2022-2032 ($MILLION)
- TABLE 20. U.S. POE SWITCHES MARKET, BY PORT COUNT, 2022-2032 ($MILLION)
- TABLE 21. U.S. POE SWITCHES MARKET, BY END USE, 2022-2032 ($MILLION)
- TABLE 22. CANADA POE SWITCHES MARKET, BY TYPE, 2022-2032 ($MILLION)
- TABLE 23. CANADA POE SWITCHES MARKET, BY PORT COUNT, 2022-2032 ($MILLION)
- TABLE 24. CANADA POE SWITCHES MARKET, BY END USE, 2022-2032 ($MILLION)
- TABLE 25. MEXICO POE SWITCHES MARKET, BY TYPE, 2022-2032 ($MILLION)
- TABLE 26. MEXICO POE SWITCHES MARKET, BY PORT COUNT, 2022-2032 ($MILLION)
- TABLE 27. MEXICO POE SWITCHES MARKET, BY END USE, 2022-2032 ($MILLION)
- TABLE 28. EUROPE POE SWITCHES MARKET, BY TYPE, 2022-2032 ($MILLION)
- TABLE 29. EUROPE POE SWITCHES MARKET, BY PORT COUNT, 2022-2032 ($MILLION)
- TABLE 30. EUROPE POE SWITCHES MARKET, BY END USE, 2022-2032 ($MILLION)
- TABLE 31. EUROPE POE SWITCHES MARKET, BY COUNTRY, 2022-2032 ($MILLION)
- TABLE 32. UK POE SWITCHES MARKET, BY TYPE, 2022-2032 ($MILLION)
- TABLE 33. UK POE SWITCHES MARKET, BY PORT COUNT, 2022-2032 ($MILLION)
- TABLE 34. UK POE SWITCHES MARKET, BY END USE, 2022-2032 ($MILLION)
- TABLE 35. GERMANY POE SWITCHES MARKET, BY TYPE, 2022-2032 ($MILLION)
- TABLE 36. GERMANY POE SWITCHES MARKET, BY PORT COUNT, 2022-2032 ($MILLION)
- TABLE 37. GERMANY POE SWITCHES MARKET, BY END USE, 2022-2032 ($MILLION)
- TABLE 38. FRANCE POE SWITCHES MARKET, BY TYPE, 2022-2032 ($MILLION)
- TABLE 39. FRANCE POE SWITCHES MARKET, BY PORT COUNT, 2022-2032 ($MILLION)
- TABLE 40. FRANCE POE SWITCHES MARKET, BY END USE, 2022-2032 ($MILLION)
- TABLE 41. REST OF EUROPE POE SWITCHES MARKET, BY TYPE, 2022-2032 ($MILLION)
- TABLE 42. REST OF EUROPE POE SWITCHES MARKET, BY PORT COUNT, 2022-2032 ($MILLION)
- TABLE 43. REST OF EUROPE POE SWITCHES MARKET, BY END USE, 2022-2032 ($MILLION)
- TABLE 44. ASIA-PACIFIC POE SWITCHES MARKET, BY TYPE, 2022-2032 ($MILLION)
- TABLE 45. ASIA-PACIFIC POE SWITCHES MARKET, BY PORT COUNT, 2022-2032 ($MILLION)
- TABLE 46. ASIA-PACIFIC POE SWITCHES MARKET, BY END USE, 2022-2032 ($MILLION)
- TABLE 47. ASIA-PACIFIC POE SWITCHES MARKET, BY COUNTRY, 2022-2032 ($MILLION)
- TABLE 48. CHINA POE SWITCHES MARKET, BY TYPE, 2022-2032 ($MILLION)
- TABLE 49. CHINA POE SWITCHES MARKET, BY PORT COUNT, 2022-2032 ($MILLION)
- TABLE 50. CHINA POE SWITCHES MARKET, BY END USE, 2022-2032 ($MILLION)
- TABLE 51. JAPAN POE SWITCHES MARKET, BY TYPE, 2022-2032 ($MILLION)
- TABLE 52. JAPAN POE SWITCHES MARKET, BY PORT COUNT, 2022-2032 ($MILLION)
- TABLE 53. JAPAN POE SWITCHES MARKET, BY END USE, 2022-2032 ($MILLION)
- TABLE 54. INDIA POE SWITCHES MARKET, BY TYPE, 2022-2032 ($MILLION)
- TABLE 55. INDIA POE SWITCHES MARKET, BY PORT COUNT, 2022-2032 ($MILLION)
- TABLE 56. INDIA POE SWITCHES MARKET, BY END USE, 2022-2032 ($MILLION)
- TABLE 57. SOUTH KOREA POE SWITCHES MARKET, BY TYPE, 2022-2032 ($MILLION)
- TABLE 58. SOUTH KOREA POE SWITCHES MARKET, BY PORT COUNT, 2022-2032 ($MILLION)
- TABLE 59. SOUTH KOREA POE SWITCHES MARKET, BY END USE, 2022-2032 ($MILLION)
- TABLE 60. REST OF ASIA-PACIFIC POE SWITCHES MARKET, BY TYPE, 2022-2032 ($MILLION)
- TABLE 61. REST OF ASIA-PACIFIC POE SWITCHES MARKET, BY PORT COUNT, 2022-2032 ($MILLION)
- TABLE 62. REST OF ASIA-PACIFIC POE SWITCHES MARKET, BY END USE, 2022-2032 ($MILLION)
- TABLE 63. LAMEA POE SWITCHES MARKET, BY TYPE, 2022-2032 ($MILLION)
- TABLE 64. LAMEA POE SWITCHES MARKET, BY PORT COUNT, 2022-2032 ($MILLION)
- TABLE 65. LAMEA POE SWITCHES MARKET, BY END USE, 2022-2032 ($MILLION)
- TABLE 66. LAMEA POE SWITCHES MARKET, BY COUNTRY, 2022-2032 ($MILLION)
- TABLE 67. LATIN AMERICA POE SWITCHES MARKET, BY TYPE, 2022-2032 ($MILLION)
- TABLE 68. LATIN AMERICA POE SWITCHES MARKET, BY PORT COUNT, 2022-2032 ($MILLION)
- TABLE 69. LATIN AMERICA POE SWITCHES MARKET, BY END USE, 2022-2032 ($MILLION)
- TABLE 70. MIDDLE EAST POE SWITCHES MARKET, BY TYPE, 2022-2032 ($MILLION)
- TABLE 71. MIDDLE EAST POE SWITCHES MARKET, BY PORT COUNT, 2022-2032 ($MILLION)
- TABLE 72. MIDDLE EAST POE SWITCHES MARKET, BY END USE, 2022-2032 ($MILLION)
- TABLE 73. AFRICA POE SWITCHES MARKET, BY TYPE, 2022-2032 ($MILLION)
- TABLE 74. AFRICA POE SWITCHES MARKET, BY PORT COUNT, 2022-2032 ($MILLION)
- TABLE 75. AFRICA POE SWITCHES MARKET, BY END USE, 2022-2032 ($MILLION)
- TABLE 76. ADVANTECH CO., LTD.: KEY EXECUTIVES
- TABLE 77. ADVANTECH CO., LTD.: COMPANY SNAPSHOT
- TABLE 78. ADVANTECH CO., LTD.: SERVICE SEGMENTS
- TABLE 79. ADVANTECH CO., LTD.: PRODUCT PORTFOLIO
- TABLE 80. ADVANTECH CO., LTD.: KEY STRATERGIES
- TABLE 81. ALLIED TELESIS, INC. : KEY EXECUTIVES
- TABLE 82. ALLIED TELESIS, INC. : COMPANY SNAPSHOT
- TABLE 83. ALLIED TELESIS, INC. : PRODUCT SEGMENTS
- TABLE 84. ALLIED TELESIS, INC. : PRODUCT PORTFOLIO
- TABLE 85. ALLIED TELESIS, INC. : KEY STRATERGIES
- TABLE 86. BROADCOM INC.: KEY EXECUTIVES
- TABLE 87. BROADCOM INC.: COMPANY SNAPSHOT
- TABLE 88. BROADCOM INC.: SERVICE SEGMENTS
- TABLE 89. BROADCOM INC.: PRODUCT PORTFOLIO
- TABLE 90. CISCO SYSTEMS, INC.: KEY EXECUTIVES
- TABLE 91. CISCO SYSTEMS, INC.: COMPANY SNAPSHOT
- TABLE 92. CISCO SYSTEMS, INC.: SERVICE SEGMENTS
- TABLE 93. CISCO SYSTEMS, INC.: PRODUCT PORTFOLIO
- TABLE 94. DIGI-KEY CORPORATION: KEY EXECUTIVES
- TABLE 95. DIGI-KEY CORPORATION: COMPANY SNAPSHOT
- TABLE 96. DIGI-KEY CORPORATION: PRODUCT SEGMENTS
- TABLE 97. DIGI-KEY CORPORATION: PRODUCT PORTFOLIO
- TABLE 98. DIGI-KEY CORPORATION: KEY STRATERGIES
- TABLE 99. D-LINK CORPORATION: KEY EXECUTIVES
- TABLE 100. D-LINK CORPORATION: COMPANY SNAPSHOT
- TABLE 101. D-LINK CORPORATION: PRODUCT SEGMENTS
- TABLE 102. D-LINK CORPORATION: PRODUCT PORTFOLIO
- TABLE 103. MAIWE COMMUNICATION: KEY EXECUTIVES
- TABLE 104. MAIWE COMMUNICATION: COMPANY SNAPSHOT
- TABLE 105. MAIWE COMMUNICATION: PRODUCT SEGMENTS
- TABLE 106. MAIWE COMMUNICATION: PRODUCT PORTFOLIO
- TABLE 107. NETGEAR INC.: KEY EXECUTIVES
- TABLE 108. NETGEAR INC.: COMPANY SNAPSHOT
- TABLE 109. NETGEAR INC.: PRODUCT SEGMENTS
- TABLE 110. NETGEAR INC.: PRODUCT PORTFOLIO
- TABLE 111. NETGEAR INC.: KEY STRATERGIES
- TABLE 112. PATTON LLC: KEY EXECUTIVES
- TABLE 113. PATTON LLC: COMPANY SNAPSHOT
- TABLE 114. PATTON LLC: PRODUCT SEGMENTS
- TABLE 115. PATTON LLC: PRODUCT PORTFOLIO
- TABLE 116. PATTON LLC: KEY STRATERGIES
- TABLE 117. TP-LINK CORPORATION LIMITED: KEY EXECUTIVES
- TABLE 118. TP-LINK CORPORATION LIMITED: COMPANY SNAPSHOT
- TABLE 119. TP-LINK CORPORATION LIMITED: PRODUCT SEGMENTS
- TABLE 120. TP-LINK CORPORATION LIMITED: PRODUCT PORTFOLIO
- TABLE 121. TP-LINK CORPORATION LIMITED: KEY STRATERGIES
LIST OF FIGURES
- FIGURE 01. POE SWITCHES MARKET, 2022-2032
- FIGURE 02. SEGMENTATION OF POE SWITCHES MARKET,2022-2032
- FIGURE 03. TOP IMPACTING FACTORS IN POE SWITCHES MARKET (2022 TO 2032)
- FIGURE 04. TOP INVESTMENT POCKETS IN POE SWITCHES MARKET (2023-2032)
- FIGURE 05. MODERATE BARGAINING POWER OF SUPPLIERS
- FIGURE 06. MODERATE THREAT OF NEW ENTRANTS
- FIGURE 07. LOW TO MODERATE THREAT OF SUBSTITUTES
- FIGURE 08. HIGH INTENSITY OF RIVALRY
- FIGURE 09. MODERATE TO HIGH BARGAINING POWER OF BUYERS
- FIGURE 10. GLOBAL POE SWITCHES MARKET:DRIVERS, RESTRAINTS AND OPPORTUNITIES
- FIGURE 11. POE SWITCHES MARKET, BY TYPE, 2022 AND 2032(%)
- FIGURE 12. COMPARATIVE SHARE ANALYSIS OF POE SWITCHES MARKET FOR MANAGED POE SWITCHES, BY COUNTRY 2022 AND 2032(%)
- FIGURE 13. COMPARATIVE SHARE ANALYSIS OF POE SWITCHES MARKET FOR UNMANAGED POE SWITCHES, BY COUNTRY 2022 AND 2032(%)
- FIGURE 14. POE SWITCHES MARKET, BY PORT COUNT, 2022 AND 2032(%)
- FIGURE 15. COMPARATIVE SHARE ANALYSIS OF POE SWITCHES MARKET FOR 4-8 PORTS, BY COUNTRY 2022 AND 2032(%)
- FIGURE 16. COMPARATIVE SHARE ANALYSIS OF POE SWITCHES MARKET FOR 9-16 PORTS, BY COUNTRY 2022 AND 2032(%)
- FIGURE 17. COMPARATIVE SHARE ANALYSIS OF POE SWITCHES MARKET FOR 17-24 PORTS, BY COUNTRY 2022 AND 2032(%)
- FIGURE 18. COMPARATIVE SHARE ANALYSIS OF POE SWITCHES MARKET FOR 25-48 PORTS, BY COUNTRY 2022 AND 2032(%)
- FIGURE 19. COMPARATIVE SHARE ANALYSIS OF POE SWITCHES MARKET FOR 48 ABOVE, BY COUNTRY 2022 AND 2032(%)
- FIGURE 20. POE SWITCHES MARKET, BY END USE, 2022 AND 2032(%)
- FIGURE 21. COMPARATIVE SHARE ANALYSIS OF POE SWITCHES MARKET FOR RESIDENTIAL, BY COUNTRY 2022 AND 2032(%)
- FIGURE 22. COMPARATIVE SHARE ANALYSIS OF POE SWITCHES MARKET FOR COMMERCIAL, BY COUNTRY 2022 AND 2032(%)
- FIGURE 23. COMPARATIVE SHARE ANALYSIS OF POE SWITCHES MARKET FOR INDUSTRIAL, BY COUNTRY 2022 AND 2032(%)
- FIGURE 24. POE SWITCHES MARKET BY REGION, 2022 AND 2032(%)
- FIGURE 25. U.S. POE SWITCHES MARKET, 2022-2032 ($MILLION)
- FIGURE 26. CANADA POE SWITCHES MARKET, 2022-2032 ($MILLION)
- FIGURE 27. MEXICO POE SWITCHES MARKET, 2022-2032 ($MILLION)
- FIGURE 28. UK POE SWITCHES MARKET, 2022-2032 ($MILLION)
- FIGURE 29. GERMANY POE SWITCHES MARKET, 2022-2032 ($MILLION)
- FIGURE 30. FRANCE POE SWITCHES MARKET, 2022-2032 ($MILLION)
- FIGURE 31. REST OF EUROPE POE SWITCHES MARKET, 2022-2032 ($MILLION)
- FIGURE 32. CHINA POE SWITCHES MARKET, 2022-2032 ($MILLION)
- FIGURE 33. JAPAN POE SWITCHES MARKET, 2022-2032 ($MILLION)
- FIGURE 34. INDIA POE SWITCHES MARKET, 2022-2032 ($MILLION)
- FIGURE 35. SOUTH KOREA POE SWITCHES MARKET, 2022-2032 ($MILLION)
- FIGURE 36. REST OF ASIA-PACIFIC POE SWITCHES MARKET, 2022-2032 ($MILLION)
- FIGURE 37. LATIN AMERICA POE SWITCHES MARKET, 2022-2032 ($MILLION)
- FIGURE 38. MIDDLE EAST POE SWITCHES MARKET, 2022-2032 ($MILLION)
- FIGURE 39. AFRICA POE SWITCHES MARKET, 2022-2032 ($MILLION)
- FIGURE 40. TOP WINNING STRATEGIES, BY YEAR (2020-2023)
- FIGURE 41. TOP WINNING STRATEGIES, BY DEVELOPMENT (2020-2023)
- FIGURE 42. TOP WINNING STRATEGIES, BY COMPANY (2020-2023)
- FIGURE 43. PRODUCT MAPPING OF TOP 10 PLAYERS
- FIGURE 44. COMPETITIVE DASHBOARD
- FIGURE 45. COMPETITIVE HEATMAP: POE SWITCHES MARKET
- FIGURE 46. TOP PLAYER POSITIONING, 2022
- FIGURE 47. ADVANTECH CO., LTD.: NET REVENUE, 2020-2022 ($MILLION)
- FIGURE 48. ADVANTECH CO., LTD.: REVENUE SHARE BY SEGMENT, 2022 (%)
- FIGURE 49. ALLIED TELESIS, INC. : NET REVENUE, 2020-2022 ($MILLION)
- FIGURE 50. ALLIED TELESIS, INC. : REVENUE SHARE BY REGION, 2022 (%)
- FIGURE 51. BROADCOM INC.: NET REVENUE, 2020-2022 ($MILLION)
- FIGURE 52. BROADCOM INC.: RESEARCH & DEVELOPMENT EXPENDITURE, 2020-2022 ($MILLION)
- FIGURE 53. BROADCOM INC.: REVENUE SHARE BY SEGMENT, 2022 (%)
- FIGURE 54. BROADCOM INC.: REVENUE SHARE BY REGION, 2022 (%)
- FIGURE 55. CISCO SYSTEMS, INC.: NET REVENUE, 2021-2023 ($MILLION)
- FIGURE 56. CISCO SYSTEMS, INC.: RESEARCH & DEVELOPMENT EXPENDITURE, 2021-2023 ($MILLION)
- FIGURE 57. CISCO SYSTEMS, INC.: REVENUE SHARE BY SEGMENT, 2023 (%)
- FIGURE 58. D-LINK CORPORATION: NET REVENUE, 2020-2022 ($MILLION)
- FIGURE 59. D-LINK CORPORATION: REVENUE SHARE BY REGION, 2022 (%)
- FIGURE 60. NETGEAR INC.: NET REVENUE, 2020-2022 ($MILLION)
- FIGURE 61. NETGEAR INC.: RESEARCH & DEVELOPMENT EXPENDITURE, 2020-2022 ($MILLION)
- FIGURE 62. NETGEAR INC.: REVENUE SHARE BY SEGMENT, 2022 (%)
- FIGURE 63. NETGEAR INC.: REVENUE SHARE BY SEGMENT, 2022 (%)
 工業乙太網交換器市場:按類型、通訊協定、最終用途產業分類 - 2024-2030 年全球預測
 全球乙太網路切換器市場規模、佔有率和趨勢分析報告(按類型、速度、配置、區域分類的展望和預測,2023-2030 年)
 2024 年乙太網路切換器全球市場報告
 乙太網路切換器和路由器市場:依產品類型、最終用途產業、地區
 PoE(乙太網路供電)交換器市場 – 2024-2029 年預測
 非託管工業乙太網交換器市場:按產品、最終用途產業分類 - 2023-2030 年全球預測
 PCIe交換芯片全球市場:2023年
 可程式乙太網路切換器市場報告:至2030年的趨勢、預測與競爭分析
 全球 PoE 注入器市場
 非託管工業以太網交換機的全球市場