


 |
市場調查報告書
商品編碼
1414796
環境光感測器市場:按輸出類型、按應用:2023-2032 年全球機會分析與產業預測Ambient Light Sensor Market By Output Type (Analog, Digital), By Application (Automotive, Consumer electronics, Healthcare, Industrial, Home automation, Others): Global Opportunity Analysis and Industry Forecast, 2023-2032 |
||||||
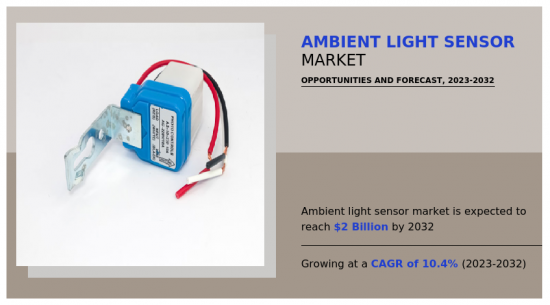
2022年環境光感測器市值為7.6104億美元,預計2023年至2032年複合年成長率為10.4%,到2032年將達20億美元。
環境光感測器通常稱為光電探測器,是一種專門設計用於評估和檢測其附近環境光水平的電子感測器。此感測器收集有關光強度的資訊並以多種方式應用:
1 調整螢幕亮度,控制燈光擺放,提高能源使用效率,方便各種電子設備及系統自動運作。
這些感測器使用的技術包括:
1 使用光電導或光電二極體將光強度的變化轉換為電訊號,以進行有效的決策和系統控制。環境光感測器採用光電導或光電二極體技術等原理工作,當暴露在不同強度的光線下時,其電氣特性會改變。這種變化導致電壓或電流的變化,可以精確測量。透過使電子系統適應不斷變化的照明環境,環境光感測器對於提高使用者舒適度、提高能源效率和促進各種電子系統的自動化至關重要。
由於政府法規,全球對能源效率的日益關注是環境光感測器市場的主要驅動力。環境光感測器根據環境光水平自動調整照明和螢幕亮度,有助於節省能源。例如,在法規可能要求採取節能措施的辦公大樓和公共空間中,可以在照明系統中安裝環境光感測器,以根據自然光的存在或不存在來調節照度並減少電力使用。相似地
1 在智慧型手機和筆記型電腦等消費性電子產品中,這些感測器將螢幕亮度調整到最佳水平,以節省電池電量並符合能源效率標準。受到節能監管努力的影響,這種廣泛採用表明環境光感測器在減少能源消耗方面發揮重要作用,在商業和消費市場中已變得至關重要。
然而,一些環境光感測器的窄工作範圍是市場成長的抑制因素,並阻礙了它們對特定應用的適用性。這些感測器在太暗或太亮的極端光照條件下可能無法有效運作,這限制了它們在光照水平變化較大的環境中的可用性。例如,在戶外應用中,例如
1 在街道照明或農業環境等光照條件快速變化的戶外應用中,工作範圍較窄的感測器可能無法提供準確的讀數或適當的反應。這種限制可能會迫使製造商尋找替代的感測解決方案,或將感測器的使用限制在照明更受控制的環境中,從而影響環境光感測器在市場上的應用廣度。確實如此。
物聯網 (IoT) 設備的使用不斷增加,大大推動了環境光感測器市場的發展。這些物聯網設備通常配備環境光感測器來收集環境資料,包括光照水平,然後將其發送到雲端服務以直接分析和決策。例如,智慧家庭生態系統使用物聯網設備,例如:
1 安防攝影機和氣候感測器等物聯網設備利用環境光感測器來改變其功能,以響應不斷變化的照明條件。這種適應性提高了這些系統的性能並有助於提高能源效率。此外,在智慧農業中,配備環境光感測器的物聯網感測器可以監測陽光照射,以最佳化作物生長,並將這些資料發送到雲端基礎的平台進行分析和決策。將環境光感測器整合到物聯網設備中表明它們在收集和利用各個領域的環境資料方面日益重要,並且是市場擴張的驅動力。
環境光感測器市場按輸出類型、應用和區域細分。根據輸出類型,市場分為類比和數位。依應用分類,環境光感測器市場分為消費性電子、汽車、醫療保健、工業、家庭自動化等。
依地區分類,北美(美國、加拿大、墨西哥)、歐洲(英國、英國、法國、其他歐洲國家地區)、亞太地區(中國、日本、印度、韓國、其他亞太地區)、拉丁美洲(拉丁美洲)美國) 、中東和非洲) 、博通、安森美半導體、Panasonic、瑞薩電子、羅姆、德克薩斯、德州儀器和 Vishay Intertechnology
目錄
第1章簡介
第 2 章執行摘要
第3章市場概況
- 市場定義和範圍
- 主要發現
- 影響因素
- 主要投資機會
- 波特五力分析
- 市場動態
- 促進因素
- 智慧型手機和家用電器的需求增加
- 擴大汽車顯示器的採用
- 抑制因素
- 低電流輸出
- 機會
- 新感測器技術的開發
- 促進因素
第 4 章環境光感測器市場:按輸出類型
- 概述
- 模擬
- 數位的
第5章環境光感測器市場:依應用分類
- 概述
- 車
- 家用電器
- 衛生保健
- 工業的
- 家庭自動化
- 其他
第6章環境光感測器市場:按地區
- 概述
- 北美洲
- 美國
- 加拿大
- 墨西哥
- 歐洲
- 英國
- 德國
- 法國
- 其他
- 亞太地區
- 中國
- 日本
- 印度
- 韓國
- 其他
- 拉丁美洲
- 拉丁美洲
- 中東
- 非洲
第7章 競爭形勢
- 介紹
- 關鍵成功策略
- 10家主要企業產品圖譜
- 競爭對手儀表板
- 競爭熱圖
- 2022年主要企業定位
第8章 公司簡介
- ams-OSRAM AG
- ACUITY BRANDS, INC.
- Broadcom Ltd.
- ON Semiconductor Corporation
- Panasonic Corporation
- Renesas Electronics Corporation
- ROHM Co., Ltd.
- STMicroelectronics NV
- Texas Instruments Incorporated
- Vishay Intertechnology, Inc.
According to a new report published by Allied Market Research, titled, "Ambient Light Sensor Market," The ambient light sensor market was valued at $761.04 million in 2022, and is estimated to reach $2 billion by 2032, growing at a CAGR of 10.4% from 2023 to 2032.
An ambient light sensor, often known as a photodetector, is an electronic sensor specifically engineered to assess and detect the level of environmental light in its immediate area. This sensor collects information about light intensity, which is applied in several ways, such as adjusting the brightness of screens, controlling lighting arrangements, improving energy use efficiency, and facilitating automated operations in various electronic devices and systems.
These sensors use technologies such as photoconductivity or photodiodes to convert light intensity fluctuations into electrical signals for effective decision-making and system control. Functioning based on principles like photoconductivity or photodiode technology, ambient light sensors change their electrical characteristics when exposed to varying levels of light. This change leads to alterations in voltage or current, which can be accurately measured. By enabling electronic systems to adjust to changing lighting environments, ambient light sensors are crucial in enhancing user comfort, boosting energy efficiency, and facilitating the automation of a wide range of electronic systems.
The increasing global emphasis on energy efficiency, driven by government regulations, is a significant driver in the ambient light sensor market. Ambient light sensors contribute to energy conservation by automatically regulating the brightness of lights and screens based on ambient light levels. For instance, in office buildings and public spaces where regulations might mandate energy-saving measures, ambient light sensors are increasingly installed in lighting systems to adjust the illumination according to natural light availability, thereby reducing electricity usage. Similarly, in consumer electronics such as smartphones and laptops, these sensors adjust screen brightness to optimal levels, conserving battery power and adhering to energy efficiency standards. This widespread adoption, influenced by regulatory efforts towards energy conservation, demonstrates how ambient light sensors are becoming essential in both commercial and consumer markets for their role in reducing energy consumption.
However, the limited operating range of some ambient light sensors acts as a restraint in the market growth, hindering their suitability for certain applications. These sensors might not perform effectively under extreme light conditions, either too dim or too bright, which limits their usability in environments where light levels vary significantly. For instance, in outdoor applications such as street lighting or in agricultural settings where light conditions change drastically, sensors with a narrow operating range may fail to provide accurate readings or respond appropriately. This limitation can lead manufacturers to seek alternative sensing solutions or restrict the use of these sensors to environments with more controlled lighting, thus impacting the breadth of applications for ambient light sensors in the market.
The growing use of Internet of Things (IoT) devices is significantly boosting the market for ambient light sensors. These IoT devices frequently feature ambient light sensors to gather environmental data, including light levels, which is subsequently transmitted to cloud services for analysis and directing decisions. For example, within smart home ecosystems, IoT devices such as security cameras and climate sensors utilize ambient light sensors to modify their functions in response to varying lighting conditions. This adaptation improves their performance and contributes to greater energy efficiency in these systems. In addition, in smart agriculture, IoT sensors equipped with ambient light detectors monitor sunlight exposure to optimize crop growth, sending this data to cloud-based platforms for analysis and aiding in decision-making. This integration of ambient light sensors into IoT devices demonstrates their growing importance in collecting and utilizing environmental data across diverse sectors, thus driving market expansion.
The ambient light sensor market is segmented on the basis of output type, application, and region. By output type, the market is bifurcated into analog and digital. By application, the ambient light sensor market is fragmented into consumer electronics, automotive, healthcare, industrial, home automation, and others.
By region, the market is analyzed across North America (the U.S., Canada, and Mexico), Europe (the UK, Germany, France, and rest of Europe), Asia-Pacific (China, Japan, India, South Korea, and rest of Asia-Pacific) and LAMEA (Latin America, Middle East, and Africa). The Major companies profiled in the report include: ams-OSRAM AG, Acuity Brands, Inc., Broadcom Ltd., ON Semiconductor Corporation, Panasonic Corporation, Renesas Electronics Corporation, ROHM Co., Ltd., STMicroelectronics N.V., Texas Instruments Incorporated, Vishay Intertechnology, Inc.
Key Benefits For Stakeholders
- This report provides a quantitative analysis of the market segments, current trends, estimations, and dynamics of the ambient light sensor market analysis from 2022 to 2032 to identify the prevailing ambient light sensor market opportunities.
- The market research is offered along with information related to key drivers, restraints, and opportunities.
- Porter's five forces analysis highlights the potency of buyers and suppliers to enable stakeholders make profit-oriented business decisions and strengthen their supplier-buyer network.
- In-depth analysis of the ambient light sensor market segmentation assists to determine the prevailing market opportunities.
- Major countries in each region are mapped according to their revenue contribution to the global market.
- Market player positioning facilitates benchmarking and provides a clear understanding of the present position of the market players.
- The report includes the analysis of the regional as well as global ambient light sensor market trends, key players, market segments, application areas, and market growth strategies.
Additional benefits you will get with this purchase are:
- Quarterly Update and* (only available with a corporate license, on listed price)
- 5 additional Company Profile of client Choice pre- or Post-purchase, as a free update.
- Free Upcoming Version on the Purchase of Five and Enterprise User License.
- 16 analyst hours of support* (post-purchase, if you find additional data requirements upon review of the report, you may receive support amounting to 16 analyst hours to solve questions, and post-sale queries)
- 15% Free Customization* (in case the scope or segment of the report does not match your requirements, 15% is equivalent to 3 working days of free work, applicable once)
- Free data Pack on the Five and Enterprise User License. (Excel version of the report)
- Free Updated report if the report is 6-12 months old or older.
- 24-hour priority response*
- Free Industry updates and white papers.
Possible Customization with this report (with additional cost and timeline, please talk to the sales executive to know more)
- Product Benchmarking / Product specification and applications
- Product Life Cycles
- Supply Chain Analysis & Vendor Margins
- Upcoming/New Entrant by Regions
- Market share analysis of players by products/segments
- New Product Development/ Product Matrix of Key Players
- Additional company profiles with specific to client's interest
- Additional country or region analysis- market size and forecast
- Expanded list for Company Profiles
- Historic market data
- Key player details (including location, contact details, supplier/vendor network etc. in excel format)
- Market share analysis of players at global/region/country level
Key Market Segments
By Output Type
- Analog
- Digital
By Application
- Automotive
- Consumer electronics
- Healthcare
- Industrial
- Home automation
- Others
By Region
- North America
- U.S.
- Canada
- Mexico
- Europe
- UK
- Germany
- France
- Rest of Europe
- Asia-Pacific
- China
- Japan
- India
- South Korea
- Rest of Asia-Pacific
- LAMEA
- Latin America
- Middle East
- Africa
Key Market Players:
- ams-OSRAM AG
- ON Semiconductor Corporation
- Panasonic Corporation
- ROHM Co., Ltd.
- STMicroelectronics N.V.
- Vishay Intertechnology, Inc.
- Broadcom Ltd.
- Renesas Electronics Corporation
- Texas Instruments Incorporated
- ACUITY BRANDS, INC.
TABLE OF CONTENTS
CHAPTER 1: INTRODUCTION
- 1.1. Report description
- 1.2. Key market segments
- 1.3. Key benefits to the stakeholders
- 1.4. Research methodology
- 1.4.1. Primary research
- 1.4.2. Secondary research
- 1.4.3. Analyst tools and models
CHAPTER 2: EXECUTIVE SUMMARY
- 2.1. CXO Perspective
CHAPTER 3: MARKET OVERVIEW
- 3.1. Market definition and scope
- 3.2. Key findings
- 3.2.1. Top impacting factors
- 3.2.2. Top investment pockets
- 3.3. Porter's five forces analysis
- 3.3.1. Moderate bargaining power of suppliers
- 3.3.2. Moderate threat of new entrants
- 3.3.3. Low to moderate threat of substitutes
- 3.3.4. High intensity of rivalry
- 3.3.5. Moderate to high bargaining power of buyers
- 3.4. Market dynamics
- 3.4.1. Drivers
- 3.4.1.1. Increase in demand for smartphones and consumer electronics
- 3.4.1.2. Growing adoption in automotive displays
- 3.4.2. Restraints
- 3.4.2.1. Low current output
- 3.4.3. Opportunities
- 3.4.3.1. Development of new sensor technologies
- 3.4.1. Drivers
CHAPTER 4: AMBIENT LIGHT SENSOR MARKET, BY OUTPUT TYPE
- 4.1. Overview
- 4.1.1. Market size and forecast
- 4.2. Analog
- 4.2.1. Key market trends, growth factors and opportunities
- 4.2.2. Market size and forecast, by region
- 4.2.3. Market share analysis by country
- 4.3. Digital
- 4.3.1. Key market trends, growth factors and opportunities
- 4.3.2. Market size and forecast, by region
- 4.3.3. Market share analysis by country
CHAPTER 5: AMBIENT LIGHT SENSOR MARKET, BY APPLICATION
- 5.1. Overview
- 5.1.1. Market size and forecast
- 5.2. Automotive
- 5.2.1. Key market trends, growth factors and opportunities
- 5.2.2. Market size and forecast, by region
- 5.2.3. Market share analysis by country
- 5.3. Consumer electronics
- 5.3.1. Key market trends, growth factors and opportunities
- 5.3.2. Market size and forecast, by region
- 5.3.3. Market share analysis by country
- 5.4. Healthcare
- 5.4.1. Key market trends, growth factors and opportunities
- 5.4.2. Market size and forecast, by region
- 5.4.3. Market share analysis by country
- 5.5. Industrial
- 5.5.1. Key market trends, growth factors and opportunities
- 5.5.2. Market size and forecast, by region
- 5.5.3. Market share analysis by country
- 5.6. Home automation
- 5.6.1. Key market trends, growth factors and opportunities
- 5.6.2. Market size and forecast, by region
- 5.6.3. Market share analysis by country
- 5.7. Others
- 5.7.1. Key market trends, growth factors and opportunities
- 5.7.2. Market size and forecast, by region
- 5.7.3. Market share analysis by country
CHAPTER 6: AMBIENT LIGHT SENSOR MARKET, BY REGION
- 6.1. Overview
- 6.1.1. Market size and forecast By Region
- 6.2. North America
- 6.2.1. Key market trends, growth factors and opportunities
- 6.2.2. Market size and forecast, by Output Type
- 6.2.3. Market size and forecast, by Application
- 6.2.4. Market size and forecast, by country
- 6.2.4.1. U.S.
- 6.2.4.1.1. Market size and forecast, by Output Type
- 6.2.4.1.2. Market size and forecast, by Application
- 6.2.4.2. Canada
- 6.2.4.2.1. Market size and forecast, by Output Type
- 6.2.4.2.2. Market size and forecast, by Application
- 6.2.4.3. Mexico
- 6.2.4.3.1. Market size and forecast, by Output Type
- 6.2.4.3.2. Market size and forecast, by Application
- 6.3. Europe
- 6.3.1. Key market trends, growth factors and opportunities
- 6.3.2. Market size and forecast, by Output Type
- 6.3.3. Market size and forecast, by Application
- 6.3.4. Market size and forecast, by country
- 6.3.4.1. UK
- 6.3.4.1.1. Market size and forecast, by Output Type
- 6.3.4.1.2. Market size and forecast, by Application
- 6.3.4.2. Germany
- 6.3.4.2.1. Market size and forecast, by Output Type
- 6.3.4.2.2. Market size and forecast, by Application
- 6.3.4.3. France
- 6.3.4.3.1. Market size and forecast, by Output Type
- 6.3.4.3.2. Market size and forecast, by Application
- 6.3.4.4. Rest of Europe
- 6.3.4.4.1. Market size and forecast, by Output Type
- 6.3.4.4.2. Market size and forecast, by Application
- 6.4. Asia-Pacific
- 6.4.1. Key market trends, growth factors and opportunities
- 6.4.2. Market size and forecast, by Output Type
- 6.4.3. Market size and forecast, by Application
- 6.4.4. Market size and forecast, by country
- 6.4.4.1. China
- 6.4.4.1.1. Market size and forecast, by Output Type
- 6.4.4.1.2. Market size and forecast, by Application
- 6.4.4.2. Japan
- 6.4.4.2.1. Market size and forecast, by Output Type
- 6.4.4.2.2. Market size and forecast, by Application
- 6.4.4.3. India
- 6.4.4.3.1. Market size and forecast, by Output Type
- 6.4.4.3.2. Market size and forecast, by Application
- 6.4.4.4. South Korea
- 6.4.4.4.1. Market size and forecast, by Output Type
- 6.4.4.4.2. Market size and forecast, by Application
- 6.4.4.5. Rest of Asia-Pacific
- 6.4.4.5.1. Market size and forecast, by Output Type
- 6.4.4.5.2. Market size and forecast, by Application
- 6.5. LAMEA
- 6.5.1. Key market trends, growth factors and opportunities
- 6.5.2. Market size and forecast, by Output Type
- 6.5.3. Market size and forecast, by Application
- 6.5.4. Market size and forecast, by country
- 6.5.4.1. Latin America
- 6.5.4.1.1. Market size and forecast, by Output Type
- 6.5.4.1.2. Market size and forecast, by Application
- 6.5.4.2. Middle East
- 6.5.4.2.1. Market size and forecast, by Output Type
- 6.5.4.2.2. Market size and forecast, by Application
- 6.5.4.3. Africa
- 6.5.4.3.1. Market size and forecast, by Output Type
- 6.5.4.3.2. Market size and forecast, by Application
CHAPTER 7: COMPETITIVE LANDSCAPE
- 7.1. Introduction
- 7.2. Top winning strategies
- 7.3. Product mapping of top 10 player
- 7.4. Competitive dashboard
- 7.5. Competitive heatmap
- 7.6. Top player positioning, 2022
CHAPTER 8: COMPANY PROFILES
- 8.1. ams-OSRAM AG
- 8.1.1. Company overview
- 8.1.2. Key executives
- 8.1.3. Company snapshot
- 8.1.4. Operating business segments
- 8.1.5. Product portfolio
- 8.1.6. Business performance
- 8.2. ACUITY BRANDS, INC.
- 8.2.1. Company overview
- 8.2.2. Key executives
- 8.2.3. Company snapshot
- 8.2.4. Operating business segments
- 8.2.5. Product portfolio
- 8.2.6. Business performance
- 8.3. Broadcom Ltd.
- 8.3.1. Company overview
- 8.3.2. Key executives
- 8.3.3. Company snapshot
- 8.3.4. Operating business segments
- 8.3.5. Product portfolio
- 8.3.6. Business performance
- 8.4. ON Semiconductor Corporation
- 8.4.1. Company overview
- 8.4.2. Key executives
- 8.4.3. Company snapshot
- 8.4.4. Operating business segments
- 8.4.5. Product portfolio
- 8.4.6. Business performance
- 8.5. Panasonic Corporation
- 8.5.1. Company overview
- 8.5.2. Key executives
- 8.5.3. Company snapshot
- 8.5.4. Operating business segments
- 8.5.5. Product portfolio
- 8.5.6. Business performance
- 8.5.7. Key strategic moves and developments
- 8.6. Renesas Electronics Corporation
- 8.6.1. Company overview
- 8.6.2. Key executives
- 8.6.3. Company snapshot
- 8.6.4. Operating business segments
- 8.6.5. Product portfolio
- 8.6.6. Business performance
- 8.7. ROHM Co., Ltd.
- 8.7.1. Company overview
- 8.7.2. Key executives
- 8.7.3. Company snapshot
- 8.7.4. Operating business segments
- 8.7.5. Product portfolio
- 8.7.6. Business performance
- 8.8. STMicroelectronics N.V.
- 8.8.1. Company overview
- 8.8.2. Key executives
- 8.8.3. Company snapshot
- 8.8.4. Operating business segments
- 8.8.5. Product portfolio
- 8.8.6. Business performance
- 8.9. Texas Instruments Incorporated
- 8.9.1. Company overview
- 8.9.2. Key executives
- 8.9.3. Company snapshot
- 8.9.4. Operating business segments
- 8.9.5. Product portfolio
- 8.9.6. Business performance
- 8.10. Vishay Intertechnology, Inc.
- 8.10.1. Company overview
- 8.10.2. Key executives
- 8.10.3. Company snapshot
- 8.10.4. Operating business segments
- 8.10.5. Product portfolio
- 8.10.6. Business performance
- 8.10.7. Key strategic moves and developments
LIST OF TABLES
- TABLE 01. GLOBAL AMBIENT LIGHT SENSOR MARKET, BY OUTPUT TYPE, 2022-2032 ($MILLION)
- TABLE 02. AMBIENT LIGHT SENSOR MARKET FOR ANALOG, BY REGION, 2022-2032 ($MILLION)
- TABLE 03. AMBIENT LIGHT SENSOR MARKET FOR DIGITAL, BY REGION, 2022-2032 ($MILLION)
- TABLE 04. GLOBAL AMBIENT LIGHT SENSOR MARKET, BY APPLICATION, 2022-2032 ($MILLION)
- TABLE 05. AMBIENT LIGHT SENSOR MARKET FOR AUTOMOTIVE, BY REGION, 2022-2032 ($MILLION)
- TABLE 06. AMBIENT LIGHT SENSOR MARKET FOR CONSUMER ELECTRONICS, BY REGION, 2022-2032 ($MILLION)
- TABLE 07. AMBIENT LIGHT SENSOR MARKET FOR HEALTHCARE, BY REGION, 2022-2032 ($MILLION)
- TABLE 08. AMBIENT LIGHT SENSOR MARKET FOR INDUSTRIAL, BY REGION, 2022-2032 ($MILLION)
- TABLE 09. AMBIENT LIGHT SENSOR MARKET FOR HOME AUTOMATION, BY REGION, 2022-2032 ($MILLION)
- TABLE 10. AMBIENT LIGHT SENSOR MARKET FOR OTHERS, BY REGION, 2022-2032 ($MILLION)
- TABLE 11. AMBIENT LIGHT SENSOR MARKET, BY REGION, 2022-2032 ($MILLION)
- TABLE 12. NORTH AMERICA AMBIENT LIGHT SENSOR MARKET, BY OUTPUT TYPE, 2022-2032 ($MILLION)
- TABLE 13. NORTH AMERICA AMBIENT LIGHT SENSOR MARKET, BY APPLICATION, 2022-2032 ($MILLION)
- TABLE 14. NORTH AMERICA AMBIENT LIGHT SENSOR MARKET, BY COUNTRY, 2022-2032 ($MILLION)
- TABLE 15. U.S. AMBIENT LIGHT SENSOR MARKET, BY OUTPUT TYPE, 2022-2032 ($MILLION)
- TABLE 16. U.S. AMBIENT LIGHT SENSOR MARKET, BY APPLICATION, 2022-2032 ($MILLION)
- TABLE 17. CANADA AMBIENT LIGHT SENSOR MARKET, BY OUTPUT TYPE, 2022-2032 ($MILLION)
- TABLE 18. CANADA AMBIENT LIGHT SENSOR MARKET, BY APPLICATION, 2022-2032 ($MILLION)
- TABLE 19. MEXICO AMBIENT LIGHT SENSOR MARKET, BY OUTPUT TYPE, 2022-2032 ($MILLION)
- TABLE 20. MEXICO AMBIENT LIGHT SENSOR MARKET, BY APPLICATION, 2022-2032 ($MILLION)
- TABLE 21. EUROPE AMBIENT LIGHT SENSOR MARKET, BY OUTPUT TYPE, 2022-2032 ($MILLION)
- TABLE 22. EUROPE AMBIENT LIGHT SENSOR MARKET, BY APPLICATION, 2022-2032 ($MILLION)
- TABLE 23. EUROPE AMBIENT LIGHT SENSOR MARKET, BY COUNTRY, 2022-2032 ($MILLION)
- TABLE 24. UK AMBIENT LIGHT SENSOR MARKET, BY OUTPUT TYPE, 2022-2032 ($MILLION)
- TABLE 25. UK AMBIENT LIGHT SENSOR MARKET, BY APPLICATION, 2022-2032 ($MILLION)
- TABLE 26. GERMANY AMBIENT LIGHT SENSOR MARKET, BY OUTPUT TYPE, 2022-2032 ($MILLION)
- TABLE 27. GERMANY AMBIENT LIGHT SENSOR MARKET, BY APPLICATION, 2022-2032 ($MILLION)
- TABLE 28. FRANCE AMBIENT LIGHT SENSOR MARKET, BY OUTPUT TYPE, 2022-2032 ($MILLION)
- TABLE 29. FRANCE AMBIENT LIGHT SENSOR MARKET, BY APPLICATION, 2022-2032 ($MILLION)
- TABLE 30. REST OF EUROPE AMBIENT LIGHT SENSOR MARKET, BY OUTPUT TYPE, 2022-2032 ($MILLION)
- TABLE 31. REST OF EUROPE AMBIENT LIGHT SENSOR MARKET, BY APPLICATION, 2022-2032 ($MILLION)
- TABLE 32. ASIA-PACIFIC AMBIENT LIGHT SENSOR MARKET, BY OUTPUT TYPE, 2022-2032 ($MILLION)
- TABLE 33. ASIA-PACIFIC AMBIENT LIGHT SENSOR MARKET, BY APPLICATION, 2022-2032 ($MILLION)
- TABLE 34. ASIA-PACIFIC AMBIENT LIGHT SENSOR MARKET, BY COUNTRY, 2022-2032 ($MILLION)
- TABLE 35. CHINA AMBIENT LIGHT SENSOR MARKET, BY OUTPUT TYPE, 2022-2032 ($MILLION)
- TABLE 36. CHINA AMBIENT LIGHT SENSOR MARKET, BY APPLICATION, 2022-2032 ($MILLION)
- TABLE 37. JAPAN AMBIENT LIGHT SENSOR MARKET, BY OUTPUT TYPE, 2022-2032 ($MILLION)
- TABLE 38. JAPAN AMBIENT LIGHT SENSOR MARKET, BY APPLICATION, 2022-2032 ($MILLION)
- TABLE 39. INDIA AMBIENT LIGHT SENSOR MARKET, BY OUTPUT TYPE, 2022-2032 ($MILLION)
- TABLE 40. INDIA AMBIENT LIGHT SENSOR MARKET, BY APPLICATION, 2022-2032 ($MILLION)
- TABLE 41. SOUTH KOREA AMBIENT LIGHT SENSOR MARKET, BY OUTPUT TYPE, 2022-2032 ($MILLION)
- TABLE 42. SOUTH KOREA AMBIENT LIGHT SENSOR MARKET, BY APPLICATION, 2022-2032 ($MILLION)
- TABLE 43. REST OF ASIA-PACIFIC AMBIENT LIGHT SENSOR MARKET, BY OUTPUT TYPE, 2022-2032 ($MILLION)
- TABLE 44. REST OF ASIA-PACIFIC AMBIENT LIGHT SENSOR MARKET, BY APPLICATION, 2022-2032 ($MILLION)
- TABLE 45. LAMEA AMBIENT LIGHT SENSOR MARKET, BY OUTPUT TYPE, 2022-2032 ($MILLION)
- TABLE 46. LAMEA AMBIENT LIGHT SENSOR MARKET, BY APPLICATION, 2022-2032 ($MILLION)
- TABLE 47. LAMEA AMBIENT LIGHT SENSOR MARKET, BY COUNTRY, 2022-2032 ($MILLION)
- TABLE 48. LATIN AMERICA AMBIENT LIGHT SENSOR MARKET, BY OUTPUT TYPE, 2022-2032 ($MILLION)
- TABLE 49. LATIN AMERICA AMBIENT LIGHT SENSOR MARKET, BY APPLICATION, 2022-2032 ($MILLION)
- TABLE 50. MIDDLE EAST AMBIENT LIGHT SENSOR MARKET, BY OUTPUT TYPE, 2022-2032 ($MILLION)
- TABLE 51. MIDDLE EAST AMBIENT LIGHT SENSOR MARKET, BY APPLICATION, 2022-2032 ($MILLION)
- TABLE 52. AFRICA AMBIENT LIGHT SENSOR MARKET, BY OUTPUT TYPE, 2022-2032 ($MILLION)
- TABLE 53. AFRICA AMBIENT LIGHT SENSOR MARKET, BY APPLICATION, 2022-2032 ($MILLION)
- TABLE 54. AMS-OSRAM AG: KEY EXECUTIVES
- TABLE 55. AMS-OSRAM AG: COMPANY SNAPSHOT
- TABLE 56. AMS-OSRAM AG: PRODUCT SEGMENTS
- TABLE 57. AMS-OSRAM AG: PRODUCT PORTFOLIO
- TABLE 58. ACUITY BRANDS, INC.: KEY EXECUTIVES
- TABLE 59. ACUITY BRANDS, INC.: COMPANY SNAPSHOT
- TABLE 60. ACUITY BRANDS, INC.: PRODUCT SEGMENTS
- TABLE 61. ACUITY BRANDS, INC.: PRODUCT PORTFOLIO
- TABLE 62. BROADCOM LTD.: KEY EXECUTIVES
- TABLE 63. BROADCOM LTD.: COMPANY SNAPSHOT
- TABLE 64. BROADCOM LTD.: PRODUCT SEGMENTS
- TABLE 65. BROADCOM LTD.: SERVICE SEGMENTS
- TABLE 66. BROADCOM LTD.: PRODUCT PORTFOLIO
- TABLE 67. ON SEMICONDUCTOR CORPORATION: KEY EXECUTIVES
- TABLE 68. ON SEMICONDUCTOR CORPORATION: COMPANY SNAPSHOT
- TABLE 69. ON SEMICONDUCTOR CORPORATION: PRODUCT SEGMENTS
- TABLE 70. ON SEMICONDUCTOR CORPORATION: PRODUCT PORTFOLIO
- TABLE 71. PANASONIC CORPORATION: KEY EXECUTIVES
- TABLE 72. PANASONIC CORPORATION: COMPANY SNAPSHOT
- TABLE 73. PANASONIC CORPORATION: PRODUCT SEGMENTS
- TABLE 74. PANASONIC CORPORATION: PRODUCT PORTFOLIO
- TABLE 75. PANASONIC CORPORATION: KEY STRATERGIES
- TABLE 76. RENESAS ELECTRONICS CORPORATION: KEY EXECUTIVES
- TABLE 77. RENESAS ELECTRONICS CORPORATION: COMPANY SNAPSHOT
- TABLE 78. RENESAS ELECTRONICS CORPORATION: PRODUCT SEGMENTS
- TABLE 79. RENESAS ELECTRONICS CORPORATION: PRODUCT PORTFOLIO
- TABLE 80. ROHM CO., LTD.: KEY EXECUTIVES
- TABLE 81. ROHM CO., LTD.: COMPANY SNAPSHOT
- TABLE 82. ROHM CO., LTD.: PRODUCT SEGMENTS
- TABLE 83. ROHM CO., LTD.: PRODUCT PORTFOLIO
- TABLE 84. STMICROELECTRONICS N.V.: KEY EXECUTIVES
- TABLE 85. STMICROELECTRONICS N.V.: COMPANY SNAPSHOT
- TABLE 86. STMICROELECTRONICS N.V.: SERVICE SEGMENTS
- TABLE 87. STMICROELECTRONICS N.V.: PRODUCT PORTFOLIO
- TABLE 88. TEXAS INSTRUMENTS INCORPORATED: KEY EXECUTIVES
- TABLE 89. TEXAS INSTRUMENTS INCORPORATED: COMPANY SNAPSHOT
- TABLE 90. TEXAS INSTRUMENTS INCORPORATED: PRODUCT SEGMENTS
- TABLE 91. TEXAS INSTRUMENTS INCORPORATED: PRODUCT PORTFOLIO
- TABLE 92. VISHAY INTERTECHNOLOGY, INC.: KEY EXECUTIVES
- TABLE 93. VISHAY INTERTECHNOLOGY, INC.: COMPANY SNAPSHOT
- TABLE 94. VISHAY INTERTECHNOLOGY, INC.: SERVICE SEGMENTS
- TABLE 95. VISHAY INTERTECHNOLOGY, INC.: PRODUCT PORTFOLIO
- TABLE 96. VISHAY INTERTECHNOLOGY, INC.: KEY STRATERGIES
LIST OF FIGURES
- FIGURE 01. AMBIENT LIGHT SENSOR MARKET, 2022-2032
- FIGURE 02. SEGMENTATION OF AMBIENT LIGHT SENSOR MARKET,2022-2032
- FIGURE 03. TOP IMPACTING FACTORS IN AMBIENT LIGHT SENSOR MARKET (2022 TO 2032)
- FIGURE 04. TOP INVESTMENT POCKETS IN AMBIENT LIGHT SENSOR MARKET (2023-2032)
- FIGURE 05. MODERATE BARGAINING POWER OF SUPPLIERS
- FIGURE 06. MODERATE THREAT OF NEW ENTRANTS
- FIGURE 07. LOW TO MODERATE THREAT OF SUBSTITUTES
- FIGURE 08. HIGH INTENSITY OF RIVALRY
- FIGURE 09. MODERATE TO HIGH BARGAINING POWER OF BUYERS
- FIGURE 10. GLOBAL AMBIENT LIGHT SENSOR MARKET:DRIVERS, RESTRAINTS AND OPPORTUNITIES
- FIGURE 11. AMBIENT LIGHT SENSOR MARKET, BY OUTPUT TYPE, 2022 AND 2032(%)
- FIGURE 12. COMPARATIVE SHARE ANALYSIS OF AMBIENT LIGHT SENSOR MARKET FOR ANALOG, BY COUNTRY 2022 AND 2032(%)
- FIGURE 13. COMPARATIVE SHARE ANALYSIS OF AMBIENT LIGHT SENSOR MARKET FOR DIGITAL, BY COUNTRY 2022 AND 2032(%)
- FIGURE 14. AMBIENT LIGHT SENSOR MARKET, BY APPLICATION, 2022 AND 2032(%)
- FIGURE 15. COMPARATIVE SHARE ANALYSIS OF AMBIENT LIGHT SENSOR MARKET FOR AUTOMOTIVE, BY COUNTRY 2022 AND 2032(%)
- FIGURE 16. COMPARATIVE SHARE ANALYSIS OF AMBIENT LIGHT SENSOR MARKET FOR CONSUMER ELECTRONICS, BY COUNTRY 2022 AND 2032(%)
- FIGURE 17. COMPARATIVE SHARE ANALYSIS OF AMBIENT LIGHT SENSOR MARKET FOR HEALTHCARE, BY COUNTRY 2022 AND 2032(%)
- FIGURE 18. COMPARATIVE SHARE ANALYSIS OF AMBIENT LIGHT SENSOR MARKET FOR INDUSTRIAL, BY COUNTRY 2022 AND 2032(%)
- FIGURE 19. COMPARATIVE SHARE ANALYSIS OF AMBIENT LIGHT SENSOR MARKET FOR HOME AUTOMATION, BY COUNTRY 2022 AND 2032(%)
- FIGURE 20. COMPARATIVE SHARE ANALYSIS OF AMBIENT LIGHT SENSOR MARKET FOR OTHERS, BY COUNTRY 2022 AND 2032(%)
- FIGURE 21. AMBIENT LIGHT SENSOR MARKET BY REGION, 2022 AND 2032(%)
- FIGURE 22. U.S. AMBIENT LIGHT SENSOR MARKET, 2022-2032 ($MILLION)
- FIGURE 23. CANADA AMBIENT LIGHT SENSOR MARKET, 2022-2032 ($MILLION)
- FIGURE 24. MEXICO AMBIENT LIGHT SENSOR MARKET, 2022-2032 ($MILLION)
- FIGURE 25. UK AMBIENT LIGHT SENSOR MARKET, 2022-2032 ($MILLION)
- FIGURE 26. GERMANY AMBIENT LIGHT SENSOR MARKET, 2022-2032 ($MILLION)
- FIGURE 27. FRANCE AMBIENT LIGHT SENSOR MARKET, 2022-2032 ($MILLION)
- FIGURE 28. REST OF EUROPE AMBIENT LIGHT SENSOR MARKET, 2022-2032 ($MILLION)
- FIGURE 29. CHINA AMBIENT LIGHT SENSOR MARKET, 2022-2032 ($MILLION)
- FIGURE 30. JAPAN AMBIENT LIGHT SENSOR MARKET, 2022-2032 ($MILLION)
- FIGURE 31. INDIA AMBIENT LIGHT SENSOR MARKET, 2022-2032 ($MILLION)
- FIGURE 32. SOUTH KOREA AMBIENT LIGHT SENSOR MARKET, 2022-2032 ($MILLION)
- FIGURE 33. REST OF ASIA-PACIFIC AMBIENT LIGHT SENSOR MARKET, 2022-2032 ($MILLION)
- FIGURE 34. LATIN AMERICA AMBIENT LIGHT SENSOR MARKET, 2022-2032 ($MILLION)
- FIGURE 35. MIDDLE EAST AMBIENT LIGHT SENSOR MARKET, 2022-2032 ($MILLION)
- FIGURE 36. AFRICA AMBIENT LIGHT SENSOR MARKET, 2022-2032 ($MILLION)
- FIGURE 37. TOP WINNING STRATEGIES, BY YEAR (2020-2022)
- FIGURE 38. TOP WINNING STRATEGIES, BY DEVELOPMENT (2020-2022)
- FIGURE 39. TOP WINNING STRATEGIES, BY COMPANY (2020-2022)
- FIGURE 40. PRODUCT MAPPING OF TOP 10 PLAYERS
- FIGURE 41. COMPETITIVE DASHBOARD
- FIGURE 42. COMPETITIVE HEATMAP: AMBIENT LIGHT SENSOR MARKET
- FIGURE 43. TOP PLAYER POSITIONING, 2022
- FIGURE 44. AMS-OSRAM AG: NET REVENUE, 2020-2022 ($MILLION)
- FIGURE 45. AMS-OSRAM AG: RESEARCH & DEVELOPMENT EXPENDITURE, 2020-2022 ($MILLION)
- FIGURE 46. AMS-OSRAM AG: REVENUE SHARE BY SEGMENT, 2022 (%)
- FIGURE 47. AMS-OSRAM AG: REVENUE SHARE BY REGION, 2022 (%)
- FIGURE 48. ACUITY BRANDS, INC.: NET SALES, 2020-2022 ($MILLION)
- FIGURE 49. ACUITY BRANDS, INC.: REVENUE SHARE BY SEGMENT, 2022 (%)
- FIGURE 50. BROADCOM LTD.: NET REVENUE, 2020-2022 ($MILLION)
- FIGURE 51. BROADCOM LTD.: RESEARCH & DEVELOPMENT EXPENDITURE, 2020-2022 ($MILLION)
- FIGURE 52. BROADCOM LTD.: REVENUE SHARE BY SEGMENT, 2022 (%)
- FIGURE 53. BROADCOM LTD.: REVENUE SHARE BY REGION, 2022 (%)
- FIGURE 54. ON SEMICONDUCTOR CORPORATION: NET REVENUE, 2020-2022 ($MILLION)
- FIGURE 55. ON SEMICONDUCTOR CORPORATION: REVENUE SHARE BY SEGMENT, 2022 (%)
- FIGURE 56. ON SEMICONDUCTOR CORPORATION: REVENUE SHARE BY REGION, 2022 (%)
- FIGURE 57. PANASONIC CORPORATION: NET REVENUE, 2020-2022 ($MILLION)
- FIGURE 58. PANASONIC CORPORATION: RESEARCH & DEVELOPMENT EXPENDITURE, 2020-2022 ($MILLION)
- FIGURE 59. PANASONIC CORPORATION: REVENUE SHARE BY SEGMENT, 2022 (%)
- FIGURE 60. PANASONIC CORPORATION: REVENUE SHARE BY REGION, 2022 (%)
- FIGURE 61. RENESAS ELECTRONICS CORPORATION: NET REVENUE, 2020-2022 ($MILLION)
- FIGURE 62. RENESAS ELECTRONICS CORPORATION: RESEARCH & DEVELOPMENT EXPENDITURE, 2020-2022 ($MILLION)
- FIGURE 63. RENESAS ELECTRONICS CORPORATION: REVENUE SHARE BY REGION, 2022 (%)
- FIGURE 64. RENESAS ELECTRONICS CORPORATION: REVENUE SHARE BY SEGMENT, 2022 (%)
- FIGURE 65. ROHM CO., LTD.: NET SALES, 2020-2022 ($MILLION)
- FIGURE 66. ROHM CO., LTD.: RESEARCH & DEVELOPMENT EXPENDITURE, 2020-2022 ($MILLION)
- FIGURE 67. ROHM CO., LTD.: REVENUE SHARE BY SEGMENT, 2022 (%)
- FIGURE 68. ROHM CO., LTD.: REVENUE SHARE BY REGION, 2022 (%)
- FIGURE 69. STMICROELECTRONICS N.V.: NET REVENUE, 2020-2022 ($MILLION)
- FIGURE 70. STMICROELECTRONICS N.V.: RESEARCH & DEVELOPMENT EXPENDITURE, 2020-2022 ($MILLION)
- FIGURE 71. STMICROELECTRONICS N.V.: REVENUE SHARE BY SEGMENT, 2022 (%)
- FIGURE 72. STMICROELECTRONICS N.V.: REVENUE SHARE BY REGION, 2022 (%)
- FIGURE 73. TEXAS INSTRUMENTS INCORPORATED: NET REVENUE, 2020-2022 ($MILLION)
- FIGURE 74. TEXAS INSTRUMENTS INCORPORATED: RESEARCH & DEVELOPMENT EXPENDITURE, 2020-2022 ($MILLION)
- FIGURE 75. TEXAS INSTRUMENTS INCORPORATED: REVENUE SHARE BY SEGMENT, 2021 (%)
- FIGURE 76. TEXAS INSTRUMENTS INCORPORATED: REVENUE SHARE BY REGION, 2021 (%)
- FIGURE 77. VISHAY INTERTECHNOLOGY, INC.: NET REVENUE, 2020-2022 ($MILLION)
- FIGURE 78. VISHAY INTERTECHNOLOGY, INC.: RESEARCH & DEVELOPMENT EXPENDITURE, 2020-2022 ($MILLION)
- FIGURE 79. VISHAY INTERTECHNOLOGY, INC.: REVENUE SHARE BY SEGMENT, 2022 (%)
- FIGURE 80. VISHAY INTERTECHNOLOGY, INC.: REVENUE SHARE BY REGION, 2021 (%)
 2024-2032 年按功能(環境光感應、接近檢測、RGB 顏色感應、手勢識別、紫外線/紅外光檢測)、輸出、整合、最終用途行業和地區分類的光感測器市場報告
 全球光學感測器市場 - 2024年至2029年預測
 日光感測器市場:按類型、安裝位置、最終應用分類 - 2024-2030 年全球預測
 光學感測器市場規模、佔有率、趨勢分析報告:按功能、產量、應用、地區、細分市場預測,2023-2030
 光感測器市場 - 2018-2028 年全球產業規模、佔有率、趨勢、機會和預測細分類型、產量、最終用戶產業、按地區、競爭。
 光學感測器市場:按整合、功能、輸出和用途- 俄羅斯-烏克蘭衝突、高通貨膨脹的累積影響 - 2023-2030 年全球預測
 光感測器市場:2023-2028年全球行業趨勢、佔有率、規模、成長、機會和預測
 光學傳感器市場:日常工作流程解決方案採用數位設備顯著推動需求
 光學傳感器的全球市場
 全球光傳感器市場 - COVID-19 的增長、趨勢、影響和預測(2022-2027 年)