


 |
市場調查報告書
商品編碼
1414771
植物奶市場:按牛奶類型、分銷管道和最終用戶分類:2023-2032 年全球機會分析和產業預測Plant-based Milk Market By Milk Type, By Distribution Channel, By End-User : Global Opportunity Analysis and Industry Forecast, 2023-2032 |
||||||
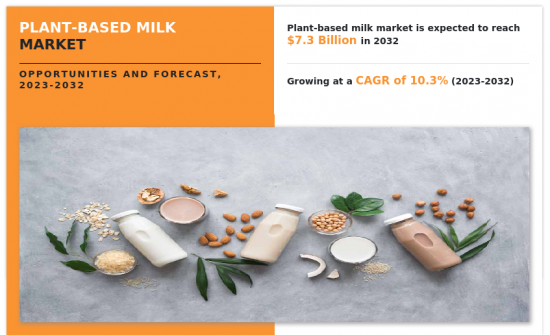
2022年植物奶市場規模預估為28億美元,2023年至2032年複合年成長率為10.3%,2032年將達73億美元。
人們對乳製品行業對環境影響的日益關注導致植物奶越來越受歡迎。乳製品產業經常與森林砍伐聯繫在一起,因為土地被清理以創造牲畜牧場和種植飼料作物。森林砍伐導致生物多樣性喪失,並向大氣中釋放大量二氧化碳。另一方面,植物來源牛奶替代品通常佔地較小,並且不需要大規模砍伐森林。此外,包括乳牛養殖在內的酪農是溫室氣體排放的主要來源。牛尤其會產生甲烷,這是一種強大的溫室氣體,對氣候變遷有重大影響。傳統的酪農需要大量的水來給牲畜補充水分、清洗以及灌溉作物以生產飼料。另一方面,與畜牧業相比,植物來源奶生產通常具有較低的水足跡,並且需要較少的水,因為它主要依賴植物種植。這使得植物奶成為更永續的選擇,特別是在面臨缺水的地區。
儘管多年來植物奶替代品的味道和質地有所改善,但一些消費者仍然發現它們不如乳製品那麼有吸引力。植物奶由多種成分製成,包括:
1 它由多種原料製成,包括大豆、杏仁、燕麥、米、椰子等,每種原料都有獨特的風味。尋找滿足各種偏好的口味是一項挑戰。此外,牛奶具有奶油般光滑的質地,很難用植物來源複製。對於某些植物奶來說,獲得相似的質地是一個特殊的挑戰。例如,杏仁奶可能比牛奶更稀、更少奶油味。質地差異會影響整體感官體驗,並且可能無法滿足消費者的期望。植物來源奶替代品的口感或攝取產品時在口中感受到的感覺或質地可能有所不同。一些消費者可能會發現某些植物奶具有顆粒狀或白堊質地,這可能是不受歡迎的。此外,植物奶可能具有與乳製品不同的獨特餘味,這可能會讓一些消費者望而卻步。
豆奶、杏仁奶和燕麥奶等流行的植物奶隨處可見,但仍有空間推出新的、令人興奮的口味。公司可以嘗試香辛料、水果和天然甜味劑等成分,創造出吸引消費者偏好的獨特口味。例如,推出抹茶、薑黃、異國風水果等口味,可以吸引尋求新奇味覺體驗的消費者。此外,植物性乳製品通常具有不同的質地和口感。公司可以透過開發不同厚度、奶油度和發泡品質的產品來進行創新。這使我們能夠滿足根據咖啡、麥片和烹飪需求喜歡不同質地的消費者的需求。例如,為專門食品咖啡飲料生產易於發泡的植物奶可能會增加咖啡店產業的需求。公司可以專注於以額外的營養素強化植物性乳製品,以滿足特定的營養需求。
COVID-19 大流行對植物奶市場產生了重大影響。由於以下因素,植物奶市場正在穩步成長:
1 健康意識、環境問題和用餐限制。在疫情期間,隨著人們更加關注自己的健康和福祉,對植物性食品(包括植物奶)的興趣增加。消費者需求的增加導致許多植物奶品牌的銷售量激增。此外,與其他產業一樣,植物奶產業也因疫情面臨供應鏈挑戰。運輸限制、封鎖措施和原料供應影響了植物性乳製品的生產和分銷。這些因素導致了暫時的產品短缺和供貨延遲。隨著關門和社交距離措施的實施,消費者的購買模式也發生了顯著變化。許多人開始網路購物並依賴電子商務平台購買食品雜貨。這一轉變有利於擁有強大線上分銷網路的現有植物奶品牌。然而,嚴重依賴實體店和外食通路的小型本土品牌面臨更大的挑戰。
目錄
第1章簡介
第 2 章執行摘要
第3章市場概況
- 市場定義和範圍
- 主要發現
- 影響因素
- 主要投資機會
- 波特五力分析
- 市場動態
- 促進因素
- 抑制因素
- 機會
- 市場佔有率分析
- 價值鏈分析
- 監管指引
- 關鍵監管分析
- 專利形勢
第4章植物奶市場:依牛奶類型
- 概述
- 杏仁
- 大豆
- 米
- 燕麥
- 椰子
- 其他
第5章植物奶市場:依通路分類
- 概述
- 線上的
- 超級市場
- 便利商店
第6章植物奶市場:依最終用戶分類
- 概述
- 零售/家庭使用
- 外食業
- 食品和飲料業
第7章植物奶市場:依地區
- 概述
- 北美洲
- 美國
- 加拿大
- 墨西哥
- 歐洲
- 德國
- 英國
- 法國
- 西班牙
- 義大利
- 其他
- 亞太地區
- 中國
- 日本
- 印度
- 韓國
- 澳洲
- 其他
- 拉丁美洲/中東/非洲
- 巴西
- UAE
- 沙烏地阿拉伯
- 南非
- 其他
第8章 競爭形勢
- 介紹
- 關鍵成功策略
- 10家主要企業產品圖譜
- 競爭對手儀表板
- 競爭熱圖
- 2022年主要企業定位
第9章 公司簡介
- Pacific Foods of Oregon, Inc.
- The Hain Celestial Group Inc.
- Edward & Sons
- Earth's Own Food Company Inc.
- Goya Foods, Inc.
- Mc Cormick & Co.
- SunOpta Inc.
- Chef's Choice Food Manufacturer Company Limited
- The Hershey Company
- Vitasoy International Holdings Limited
According to a new report published by Allied Market Research, titled, "Plant-based Milk Market," The plant-based milk market was valued at $2.8 billion in 2022, and is estimated to reach $7.3 billion by 2032, growing at a CAGR of 10.3% from 2023 to 2032.
Increasing concerns about the environmental impact of the dairy industry is leading to rising popularity of plant-based milk. The dairy industry is often associated with deforestation, as land is cleared to create pasture for livestock and to grow animal feed crops. Deforestation contributes to the loss of biodiversity and releases significant amounts of carbon dioxide into the atmosphere. On the contrary, plant-based milk alternatives typically have a smaller land footprint and do not require large-scale deforestation. Moreover, livestock farming, including dairy production, is a major contributor to greenhouse gas emissions. Cows, in particular, produce methane, a potent greenhouse gas that significantly contributes to climate change. Conventional dairy farming requires substantial amounts of water for livestock hydration, cleaning, and crop irrigation for feed production. On the contrary, plant-based milk production generally has a lower water footprint since it primarily relies on plant cultivation, which typically requires less water compared to animal agriculture. This makes plant-based milk a more sustainable choice, especially in regions facing water scarcity.
While plant-based milk alternatives have improved in taste and texture over the years, some consumers still find them less appealing compared to dairy milk. Plant-based milks are made from different sources such as soy, almond, oat, rice, and coconut, each with its own unique taste. Finding a flavor that can satisfy a broad range of preferences can be challenging. Moreover, dairy milk has a creamy and smooth texture that is difficult to replicate with plant-based ingredients. Achieving a similar texture is particularly challenging for certain plant-based milk varieties. For example, almond milk may be thinner and less creamy compared to dairy milk. Texture differences can affect the overall sensory experience and may not meet the expectations of some consumers. The mouthfeel, or the sensation and texture experienced in the mouth while consuming a product, can be different in plant-based milk alternatives. Some consumers may perceive a grainy or chalky mouthfeel in certain plant-based milks, which can be less desirable. In addition, plant-based milks may have distinct aftertastes that differ from dairy milk, which can be a turn-off for some consumers.
While popular plant-based milk options like soy, almond, and oat milk are widely available, there is room for introducing new and exciting flavors. Companies can experiment with ingredients like spices, fruits, and natural sweeteners to create unique flavor profiles that appeal to different consumer preferences. For example, introducing flavors like matcha, turmeric, or exotic fruits can attract consumers looking for novel taste experiences. Moreover, plant-based milk products often differ in terms of their texture and mouthfeel. Companies can innovate by developing products with varying thickness, creaminess, and frothing capabilities. This can help cater to consumers who prefer different textures for their coffee, cereal, or cooking needs. For instance, creating a froth-friendly plant-based milk for specialty coffee beverages can target the growing demand in the coffee shop industry. Companies can focus on fortifying plant-based milk products with additional nutrients to meet specific dietary needs.
The COVID-19 pandemic had a significant impact on the market for plant based milk market. The plant based milk market has been experiencing steady growth, driven by factors such as health consciousness, environmental concerns, and dietary restrictions. During the pandemic, as people focused more on their health and well-being, there was a rising interest in plant-based alternatives, including plant-based milk. This increased consumer demand resulted in a surge in sales for many plant-based milk brands. Moreover, like other sectors, the plant based milk industry faced challenges in its supply chains due to the pandemic. Restrictions on transportation, lockdown measures, and disruptions in the availability of raw materials impacted the production and distribution of plant-based milk products. These factors led to temporary shortages or delays in product availability. With lockdowns and social distancing measures in place, consumers' purchasing patterns shifted significantly. Many people began shopping online, relying on e-commerce platforms for their groceries. This shift favored established plant-based milk brands with strong online distribution networks. However, smaller or local brands that relied heavily on physical stores or foodservice channels faced more significant challenges.
The key players profiled in this report include: Pacific Foods of Oregon, Inc., The Hain Celestial Group Inc., Edward & Sons, Earth's Own Food Company Inc., Goya Foods, Mc Cormick & Co., Sunopta Inc., Chef's Choice Food Manufacturer Company Limited, The Hershey Company, Vitasoy International Holdings Limited, Turtle Mountain LLC, and Natura Foods. The market players are continuously striving to achieve a dominant position in this competitive market using strategies such as collaborations and acquisitions.
Key Benefits For Stakeholders
- This report provides a quantitative analysis of the market segments, current trends, estimations, and dynamics of the plant-based milk market analysis from 2022 to 2032 to identify the prevailing plant-based milk market opportunities.
- The market research is offered along with information related to key drivers, restraints, and opportunities.
- Porter's five forces analysis highlights the potency of buyers and suppliers to enable stakeholders make profit-oriented business decisions and strengthen their supplier-buyer network.
- In-depth analysis of the plant-based milk market segmentation assists to determine the prevailing market opportunities.
- Major countries in each region are mapped according to their revenue contribution to the global market.
- Market player positioning facilitates benchmarking and provides a clear understanding of the present position of the market players.
- The report includes the analysis of the regional as well as global plant-based milk market trends, key players, market segments, application areas, and market growth strategies.
Additional benefits you will get with this purchase are:
- Quarterly Update and* (only available with a corporate license, on listed price)
- 5 additional Company Profile of client Choice pre- or Post-purchase, as a free update.
- Free Upcoming Version on the Purchase of Five and Enterprise User License.
- 16 analyst hours of support* (post-purchase, if you find additional data requirements upon review of the report, you may receive support amounting to 16 analyst hours to solve questions, and post-sale queries)
- 15% Free Customization* (in case the scope or segment of the report does not match your requirements, 15% is equivalent to 3 working days of free work, applicable once)
- Free data Pack on the Five and Enterprise User License. (Excel version of the report)
- Free Updated report if the report is 6-12 months old or older.
- 24-hour priority response*
- Free Industry updates and white papers.
Possible Customization with this report (with additional cost and timeline, please talk to the sales executive to know more)
- Investment Opportunities
- Technology Trend Analysis
- Go To Market Strategy
- Regulatory Guidelines
- Strategic Recommedations
- Additional company profiles with specific to client's interest
- Additional country or region analysis- market size and forecast
- Criss-cross segment analysis- market size and forecast
- Expanded list for Company Profiles
- Historic market data
- Key player details (including location, contact details, supplier/vendor network etc. in excel format)
- Market share analysis of players at global/region/country level
- SWOT Analysis
Key Market Segments
By Milk Type
- Almond
- Soy
- Rice
- Oat
- Coconut
- Others
By Distribution Channel
- Online
- Supermarket
- Convenience Stores
By End-User
- Retail/Household
- Foodservices Industry
- Food and Beverage Industry
By Region
- North America
- U.S.
- Canada
- Mexico
- Europe
- Germany
- UK
- France
- Spain
- Italy
- Rest of Europe
- Asia-Pacific
- China
- Japan
- India
- South Korea
- Australia
- Rest of Asia-Pacific
- LAMEA
- Brazil
- UAE
- Saudi Arabia
- South Africa
- Rest of LAMEA
Key Market Players:
- Pacific Foods of Oregon, Inc.
- The Hain Celestial Group Inc.
- Edward & Sons
- Earth's Own Food Company Inc.
- Goya Foods, Inc.
- Mc Cormick & Co.
- SunOpta Inc.
- Chef's Choice Food Manufacturer Company Limited
- The Hershey Company
- Vitasoy International Holdings Limited
TABLE OF CONTENTS
CHAPTER 1: INTRODUCTION
- 1.1. Report description
- 1.2. Key market segments
- 1.3. Key benefits to the stakeholders
- 1.4. Research methodology
- 1.4.1. Primary research
- 1.4.2. Secondary research
- 1.4.3. Analyst tools and models
CHAPTER 2: EXECUTIVE SUMMARY
- 2.1. CXO Perspective
CHAPTER 3: MARKET OVERVIEW
- 3.1. Market definition and scope
- 3.2. Key findings
- 3.2.1. Top impacting factors
- 3.2.2. Top investment pockets
- 3.3. Porter's five forces analysis
- 3.4. Market dynamics
- 3.4.1. Drivers
- 3.4.2. Restraints
- 3.4.3. Opportunities
- 3.5. Market Share Analysis
- 3.6. Value Chain Analysis
- 3.7. Regulatory Guidelines
- 3.8. Key Regulation Analysis
- 3.9. Patent Landscape
CHAPTER 4: PLANT-BASED MILK MARKET, BY MILK TYPE
- 4.1. Overview
- 4.1.1. Market size and forecast
- 4.2. Almond
- 4.2.1. Key market trends, growth factors and opportunities
- 4.2.2. Market size and forecast, by region
- 4.2.3. Market share analysis by country
- 4.3. Soy
- 4.3.1. Key market trends, growth factors and opportunities
- 4.3.2. Market size and forecast, by region
- 4.3.3. Market share analysis by country
- 4.4. Rice
- 4.4.1. Key market trends, growth factors and opportunities
- 4.4.2. Market size and forecast, by region
- 4.4.3. Market share analysis by country
- 4.5. Oat
- 4.5.1. Key market trends, growth factors and opportunities
- 4.5.2. Market size and forecast, by region
- 4.5.3. Market share analysis by country
- 4.6. Coconut
- 4.6.1. Key market trends, growth factors and opportunities
- 4.6.2. Market size and forecast, by region
- 4.6.3. Market share analysis by country
- 4.7. Others
- 4.7.1. Key market trends, growth factors and opportunities
- 4.7.2. Market size and forecast, by region
- 4.7.3. Market share analysis by country
CHAPTER 5: PLANT-BASED MILK MARKET, BY DISTRIBUTION CHANNEL
- 5.1. Overview
- 5.1.1. Market size and forecast
- 5.2. Online
- 5.2.1. Key market trends, growth factors and opportunities
- 5.2.2. Market size and forecast, by region
- 5.2.3. Market share analysis by country
- 5.3. Supermarket
- 5.3.1. Key market trends, growth factors and opportunities
- 5.3.2. Market size and forecast, by region
- 5.3.3. Market share analysis by country
- 5.4. Convenience Stores
- 5.4.1. Key market trends, growth factors and opportunities
- 5.4.2. Market size and forecast, by region
- 5.4.3. Market share analysis by country
CHAPTER 6: PLANT-BASED MILK MARKET, BY END-USER
- 6.1. Overview
- 6.1.1. Market size and forecast
- 6.2. Retail/Household
- 6.2.1. Key market trends, growth factors and opportunities
- 6.2.2. Market size and forecast, by region
- 6.2.3. Market share analysis by country
- 6.3. Foodservices Industry
- 6.3.1. Key market trends, growth factors and opportunities
- 6.3.2. Market size and forecast, by region
- 6.3.3. Market share analysis by country
- 6.4. Food and Beverage Industry
- 6.4.1. Key market trends, growth factors and opportunities
- 6.4.2. Market size and forecast, by region
- 6.4.3. Market share analysis by country
CHAPTER 7: PLANT-BASED MILK MARKET, BY REGION
- 7.1. Overview
- 7.1.1. Market size and forecast By Region
- 7.2. North America
- 7.2.1. Key market trends, growth factors and opportunities
- 7.2.2. Market size and forecast, by Milk Type
- 7.2.3. Market size and forecast, by Distribution Channel
- 7.2.4. Market size and forecast, by End-User
- 7.2.5. Market size and forecast, by country
- 7.2.5.1. U.S.
- 7.2.5.1.1. Market size and forecast, by Milk Type
- 7.2.5.1.2. Market size and forecast, by Distribution Channel
- 7.2.5.1.3. Market size and forecast, by End-User
- 7.2.5.2. Canada
- 7.2.5.2.1. Market size and forecast, by Milk Type
- 7.2.5.2.2. Market size and forecast, by Distribution Channel
- 7.2.5.2.3. Market size and forecast, by End-User
- 7.2.5.3. Mexico
- 7.2.5.3.1. Market size and forecast, by Milk Type
- 7.2.5.3.2. Market size and forecast, by Distribution Channel
- 7.2.5.3.3. Market size and forecast, by End-User
- 7.3. Europe
- 7.3.1. Key market trends, growth factors and opportunities
- 7.3.2. Market size and forecast, by Milk Type
- 7.3.3. Market size and forecast, by Distribution Channel
- 7.3.4. Market size and forecast, by End-User
- 7.3.5. Market size and forecast, by country
- 7.3.5.1. Germany
- 7.3.5.1.1. Market size and forecast, by Milk Type
- 7.3.5.1.2. Market size and forecast, by Distribution Channel
- 7.3.5.1.3. Market size and forecast, by End-User
- 7.3.5.2. UK
- 7.3.5.2.1. Market size and forecast, by Milk Type
- 7.3.5.2.2. Market size and forecast, by Distribution Channel
- 7.3.5.2.3. Market size and forecast, by End-User
- 7.3.5.3. France
- 7.3.5.3.1. Market size and forecast, by Milk Type
- 7.3.5.3.2. Market size and forecast, by Distribution Channel
- 7.3.5.3.3. Market size and forecast, by End-User
- 7.3.5.4. Spain
- 7.3.5.4.1. Market size and forecast, by Milk Type
- 7.3.5.4.2. Market size and forecast, by Distribution Channel
- 7.3.5.4.3. Market size and forecast, by End-User
- 7.3.5.5. Italy
- 7.3.5.5.1. Market size and forecast, by Milk Type
- 7.3.5.5.2. Market size and forecast, by Distribution Channel
- 7.3.5.5.3. Market size and forecast, by End-User
- 7.3.5.6. Rest of Europe
- 7.3.5.6.1. Market size and forecast, by Milk Type
- 7.3.5.6.2. Market size and forecast, by Distribution Channel
- 7.3.5.6.3. Market size and forecast, by End-User
- 7.4. Asia-Pacific
- 7.4.1. Key market trends, growth factors and opportunities
- 7.4.2. Market size and forecast, by Milk Type
- 7.4.3. Market size and forecast, by Distribution Channel
- 7.4.4. Market size and forecast, by End-User
- 7.4.5. Market size and forecast, by country
- 7.4.5.1. China
- 7.4.5.1.1. Market size and forecast, by Milk Type
- 7.4.5.1.2. Market size and forecast, by Distribution Channel
- 7.4.5.1.3. Market size and forecast, by End-User
- 7.4.5.2. Japan
- 7.4.5.2.1. Market size and forecast, by Milk Type
- 7.4.5.2.2. Market size and forecast, by Distribution Channel
- 7.4.5.2.3. Market size and forecast, by End-User
- 7.4.5.3. India
- 7.4.5.3.1. Market size and forecast, by Milk Type
- 7.4.5.3.2. Market size and forecast, by Distribution Channel
- 7.4.5.3.3. Market size and forecast, by End-User
- 7.4.5.4. South Korea
- 7.4.5.4.1. Market size and forecast, by Milk Type
- 7.4.5.4.2. Market size and forecast, by Distribution Channel
- 7.4.5.4.3. Market size and forecast, by End-User
- 7.4.5.5. Australia
- 7.4.5.5.1. Market size and forecast, by Milk Type
- 7.4.5.5.2. Market size and forecast, by Distribution Channel
- 7.4.5.5.3. Market size and forecast, by End-User
- 7.4.5.6. Rest of Asia-Pacific
- 7.4.5.6.1. Market size and forecast, by Milk Type
- 7.4.5.6.2. Market size and forecast, by Distribution Channel
- 7.4.5.6.3. Market size and forecast, by End-User
- 7.5. LAMEA
- 7.5.1. Key market trends, growth factors and opportunities
- 7.5.2. Market size and forecast, by Milk Type
- 7.5.3. Market size and forecast, by Distribution Channel
- 7.5.4. Market size and forecast, by End-User
- 7.5.5. Market size and forecast, by country
- 7.5.5.1. Brazil
- 7.5.5.1.1. Market size and forecast, by Milk Type
- 7.5.5.1.2. Market size and forecast, by Distribution Channel
- 7.5.5.1.3. Market size and forecast, by End-User
- 7.5.5.2. UAE
- 7.5.5.2.1. Market size and forecast, by Milk Type
- 7.5.5.2.2. Market size and forecast, by Distribution Channel
- 7.5.5.2.3. Market size and forecast, by End-User
- 7.5.5.3. Saudi Arabia
- 7.5.5.3.1. Market size and forecast, by Milk Type
- 7.5.5.3.2. Market size and forecast, by Distribution Channel
- 7.5.5.3.3. Market size and forecast, by End-User
- 7.5.5.4. South Africa
- 7.5.5.4.1. Market size and forecast, by Milk Type
- 7.5.5.4.2. Market size and forecast, by Distribution Channel
- 7.5.5.4.3. Market size and forecast, by End-User
- 7.5.5.5. Rest of LAMEA
- 7.5.5.5.1. Market size and forecast, by Milk Type
- 7.5.5.5.2. Market size and forecast, by Distribution Channel
- 7.5.5.5.3. Market size and forecast, by End-User
CHAPTER 8: COMPETITIVE LANDSCAPE
- 8.1. Introduction
- 8.2. Top winning strategies
- 8.3. Product mapping of top 10 player
- 8.4. Competitive dashboard
- 8.5. Competitive heatmap
- 8.6. Top player positioning, 2022
CHAPTER 9: COMPANY PROFILES
- 9.1. Pacific Foods of Oregon, Inc.
- 9.1.1. Company overview
- 9.1.2. Key executives
- 9.1.3. Company snapshot
- 9.2. The Hain Celestial Group Inc.
- 9.2.1. Company overview
- 9.2.2. Key executives
- 9.2.3. Company snapshot
- 9.3. Edward & Sons
- 9.3.1. Company overview
- 9.3.2. Key executives
- 9.3.3. Company snapshot
- 9.4. Earth's Own Food Company Inc.
- 9.4.1. Company overview
- 9.4.2. Key executives
- 9.4.3. Company snapshot
- 9.5. Goya Foods, Inc.
- 9.5.1. Company overview
- 9.5.2. Key executives
- 9.5.3. Company snapshot
- 9.6. Mc Cormick & Co.
- 9.6.1. Company overview
- 9.6.2. Key executives
- 9.6.3. Company snapshot
- 9.7. SunOpta Inc.
- 9.7.1. Company overview
- 9.7.2. Key executives
- 9.7.3. Company snapshot
- 9.8. Chef's Choice Food Manufacturer Company Limited
- 9.8.1. Company overview
- 9.8.2. Key executives
- 9.8.3. Company snapshot
- 9.9. The Hershey Company
- 9.9.1. Company overview
- 9.9.2. Key executives
- 9.9.3. Company snapshot
- 9.10. Vitasoy International Holdings Limited
- 9.10.1. Company overview
- 9.10.2. Key executives
- 9.10.3. Company snapshot
LIST OF TABLES
- TABLE 01. GLOBAL PLANT-BASED MILK MARKET, BY MILK TYPE, 2022-2032 ($MILLION)
- TABLE 02. PLANT-BASED MILK MARKET FOR ALMOND, BY REGION, 2022-2032 ($MILLION)
- TABLE 03. PLANT-BASED MILK MARKET FOR SOY, BY REGION, 2022-2032 ($MILLION)
- TABLE 04. PLANT-BASED MILK MARKET FOR RICE, BY REGION, 2022-2032 ($MILLION)
- TABLE 05. PLANT-BASED MILK MARKET FOR OAT, BY REGION, 2022-2032 ($MILLION)
- TABLE 06. PLANT-BASED MILK MARKET FOR COCONUT, BY REGION, 2022-2032 ($MILLION)
- TABLE 07. PLANT-BASED MILK MARKET FOR OTHERS, BY REGION, 2022-2032 ($MILLION)
- TABLE 08. GLOBAL PLANT-BASED MILK MARKET, BY DISTRIBUTION CHANNEL, 2022-2032 ($MILLION)
- TABLE 09. PLANT-BASED MILK MARKET FOR ONLINE, BY REGION, 2022-2032 ($MILLION)
- TABLE 10. PLANT-BASED MILK MARKET FOR SUPERMARKET, BY REGION, 2022-2032 ($MILLION)
- TABLE 11. PLANT-BASED MILK MARKET FOR CONVENIENCE STORES, BY REGION, 2022-2032 ($MILLION)
- TABLE 12. GLOBAL PLANT-BASED MILK MARKET, BY END-USER, 2022-2032 ($MILLION)
- TABLE 13. PLANT-BASED MILK MARKET FOR RETAIL/HOUSEHOLD, BY REGION, 2022-2032 ($MILLION)
- TABLE 14. PLANT-BASED MILK MARKET FOR FOODSERVICES INDUSTRY, BY REGION, 2022-2032 ($MILLION)
- TABLE 15. PLANT-BASED MILK MARKET FOR FOOD AND BEVERAGE INDUSTRY, BY REGION, 2022-2032 ($MILLION)
- TABLE 16. PLANT-BASED MILK MARKET, BY REGION, 2022-2032 ($MILLION)
- TABLE 17. NORTH AMERICA PLANT-BASED MILK MARKET, BY MILK TYPE, 2022-2032 ($MILLION)
- TABLE 18. NORTH AMERICA PLANT-BASED MILK MARKET, BY DISTRIBUTION CHANNEL, 2022-2032 ($MILLION)
- TABLE 19. NORTH AMERICA PLANT-BASED MILK MARKET, BY END-USER, 2022-2032 ($MILLION)
- TABLE 20. NORTH AMERICA PLANT-BASED MILK MARKET, BY COUNTRY, 2022-2032 ($MILLION)
- TABLE 21. U.S. PLANT-BASED MILK MARKET, BY MILK TYPE, 2022-2032 ($MILLION)
- TABLE 22. U.S. PLANT-BASED MILK MARKET, BY DISTRIBUTION CHANNEL, 2022-2032 ($MILLION)
- TABLE 23. U.S. PLANT-BASED MILK MARKET, BY END-USER, 2022-2032 ($MILLION)
- TABLE 24. CANADA PLANT-BASED MILK MARKET, BY MILK TYPE, 2022-2032 ($MILLION)
- TABLE 25. CANADA PLANT-BASED MILK MARKET, BY DISTRIBUTION CHANNEL, 2022-2032 ($MILLION)
- TABLE 26. CANADA PLANT-BASED MILK MARKET, BY END-USER, 2022-2032 ($MILLION)
- TABLE 27. MEXICO PLANT-BASED MILK MARKET, BY MILK TYPE, 2022-2032 ($MILLION)
- TABLE 28. MEXICO PLANT-BASED MILK MARKET, BY DISTRIBUTION CHANNEL, 2022-2032 ($MILLION)
- TABLE 29. MEXICO PLANT-BASED MILK MARKET, BY END-USER, 2022-2032 ($MILLION)
- TABLE 30. EUROPE PLANT-BASED MILK MARKET, BY MILK TYPE, 2022-2032 ($MILLION)
- TABLE 31. EUROPE PLANT-BASED MILK MARKET, BY DISTRIBUTION CHANNEL, 2022-2032 ($MILLION)
- TABLE 32. EUROPE PLANT-BASED MILK MARKET, BY END-USER, 2022-2032 ($MILLION)
- TABLE 33. EUROPE PLANT-BASED MILK MARKET, BY COUNTRY, 2022-2032 ($MILLION)
- TABLE 34. GERMANY PLANT-BASED MILK MARKET, BY MILK TYPE, 2022-2032 ($MILLION)
- TABLE 35. GERMANY PLANT-BASED MILK MARKET, BY DISTRIBUTION CHANNEL, 2022-2032 ($MILLION)
- TABLE 36. GERMANY PLANT-BASED MILK MARKET, BY END-USER, 2022-2032 ($MILLION)
- TABLE 37. UK PLANT-BASED MILK MARKET, BY MILK TYPE, 2022-2032 ($MILLION)
- TABLE 38. UK PLANT-BASED MILK MARKET, BY DISTRIBUTION CHANNEL, 2022-2032 ($MILLION)
- TABLE 39. UK PLANT-BASED MILK MARKET, BY END-USER, 2022-2032 ($MILLION)
- TABLE 40. FRANCE PLANT-BASED MILK MARKET, BY MILK TYPE, 2022-2032 ($MILLION)
- TABLE 41. FRANCE PLANT-BASED MILK MARKET, BY DISTRIBUTION CHANNEL, 2022-2032 ($MILLION)
- TABLE 42. FRANCE PLANT-BASED MILK MARKET, BY END-USER, 2022-2032 ($MILLION)
- TABLE 43. SPAIN PLANT-BASED MILK MARKET, BY MILK TYPE, 2022-2032 ($MILLION)
- TABLE 44. SPAIN PLANT-BASED MILK MARKET, BY DISTRIBUTION CHANNEL, 2022-2032 ($MILLION)
- TABLE 45. SPAIN PLANT-BASED MILK MARKET, BY END-USER, 2022-2032 ($MILLION)
- TABLE 46. ITALY PLANT-BASED MILK MARKET, BY MILK TYPE, 2022-2032 ($MILLION)
- TABLE 47. ITALY PLANT-BASED MILK MARKET, BY DISTRIBUTION CHANNEL, 2022-2032 ($MILLION)
- TABLE 48. ITALY PLANT-BASED MILK MARKET, BY END-USER, 2022-2032 ($MILLION)
- TABLE 49. REST OF EUROPE PLANT-BASED MILK MARKET, BY MILK TYPE, 2022-2032 ($MILLION)
- TABLE 50. REST OF EUROPE PLANT-BASED MILK MARKET, BY DISTRIBUTION CHANNEL, 2022-2032 ($MILLION)
- TABLE 51. REST OF EUROPE PLANT-BASED MILK MARKET, BY END-USER, 2022-2032 ($MILLION)
- TABLE 52. ASIA-PACIFIC PLANT-BASED MILK MARKET, BY MILK TYPE, 2022-2032 ($MILLION)
- TABLE 53. ASIA-PACIFIC PLANT-BASED MILK MARKET, BY DISTRIBUTION CHANNEL, 2022-2032 ($MILLION)
- TABLE 54. ASIA-PACIFIC PLANT-BASED MILK MARKET, BY END-USER, 2022-2032 ($MILLION)
- TABLE 55. ASIA-PACIFIC PLANT-BASED MILK MARKET, BY COUNTRY, 2022-2032 ($MILLION)
- TABLE 56. CHINA PLANT-BASED MILK MARKET, BY MILK TYPE, 2022-2032 ($MILLION)
- TABLE 57. CHINA PLANT-BASED MILK MARKET, BY DISTRIBUTION CHANNEL, 2022-2032 ($MILLION)
- TABLE 58. CHINA PLANT-BASED MILK MARKET, BY END-USER, 2022-2032 ($MILLION)
- TABLE 59. JAPAN PLANT-BASED MILK MARKET, BY MILK TYPE, 2022-2032 ($MILLION)
- TABLE 60. JAPAN PLANT-BASED MILK MARKET, BY DISTRIBUTION CHANNEL, 2022-2032 ($MILLION)
- TABLE 61. JAPAN PLANT-BASED MILK MARKET, BY END-USER, 2022-2032 ($MILLION)
- TABLE 62. INDIA PLANT-BASED MILK MARKET, BY MILK TYPE, 2022-2032 ($MILLION)
- TABLE 63. INDIA PLANT-BASED MILK MARKET, BY DISTRIBUTION CHANNEL, 2022-2032 ($MILLION)
- TABLE 64. INDIA PLANT-BASED MILK MARKET, BY END-USER, 2022-2032 ($MILLION)
- TABLE 65. SOUTH KOREA PLANT-BASED MILK MARKET, BY MILK TYPE, 2022-2032 ($MILLION)
- TABLE 66. SOUTH KOREA PLANT-BASED MILK MARKET, BY DISTRIBUTION CHANNEL, 2022-2032 ($MILLION)
- TABLE 67. SOUTH KOREA PLANT-BASED MILK MARKET, BY END-USER, 2022-2032 ($MILLION)
- TABLE 68. AUSTRALIA PLANT-BASED MILK MARKET, BY MILK TYPE, 2022-2032 ($MILLION)
- TABLE 69. AUSTRALIA PLANT-BASED MILK MARKET, BY DISTRIBUTION CHANNEL, 2022-2032 ($MILLION)
- TABLE 70. AUSTRALIA PLANT-BASED MILK MARKET, BY END-USER, 2022-2032 ($MILLION)
- TABLE 71. REST OF ASIA-PACIFIC PLANT-BASED MILK MARKET, BY MILK TYPE, 2022-2032 ($MILLION)
- TABLE 72. REST OF ASIA-PACIFIC PLANT-BASED MILK MARKET, BY DISTRIBUTION CHANNEL, 2022-2032 ($MILLION)
- TABLE 73. REST OF ASIA-PACIFIC PLANT-BASED MILK MARKET, BY END-USER, 2022-2032 ($MILLION)
- TABLE 74. LAMEA PLANT-BASED MILK MARKET, BY MILK TYPE, 2022-2032 ($MILLION)
- TABLE 75. LAMEA PLANT-BASED MILK MARKET, BY DISTRIBUTION CHANNEL, 2022-2032 ($MILLION)
- TABLE 76. LAMEA PLANT-BASED MILK MARKET, BY END-USER, 2022-2032 ($MILLION)
- TABLE 77. LAMEA PLANT-BASED MILK MARKET, BY COUNTRY, 2022-2032 ($MILLION)
- TABLE 78. BRAZIL PLANT-BASED MILK MARKET, BY MILK TYPE, 2022-2032 ($MILLION)
- TABLE 79. BRAZIL PLANT-BASED MILK MARKET, BY DISTRIBUTION CHANNEL, 2022-2032 ($MILLION)
- TABLE 80. BRAZIL PLANT-BASED MILK MARKET, BY END-USER, 2022-2032 ($MILLION)
- TABLE 81. UAE PLANT-BASED MILK MARKET, BY MILK TYPE, 2022-2032 ($MILLION)
- TABLE 82. UAE PLANT-BASED MILK MARKET, BY DISTRIBUTION CHANNEL, 2022-2032 ($MILLION)
- TABLE 83. UAE PLANT-BASED MILK MARKET, BY END-USER, 2022-2032 ($MILLION)
- TABLE 84. SAUDI ARABIA PLANT-BASED MILK MARKET, BY MILK TYPE, 2022-2032 ($MILLION)
- TABLE 85. SAUDI ARABIA PLANT-BASED MILK MARKET, BY DISTRIBUTION CHANNEL, 2022-2032 ($MILLION)
- TABLE 86. SAUDI ARABIA PLANT-BASED MILK MARKET, BY END-USER, 2022-2032 ($MILLION)
- TABLE 87. SOUTH AFRICA PLANT-BASED MILK MARKET, BY MILK TYPE, 2022-2032 ($MILLION)
- TABLE 88. SOUTH AFRICA PLANT-BASED MILK MARKET, BY DISTRIBUTION CHANNEL, 2022-2032 ($MILLION)
- TABLE 89. SOUTH AFRICA PLANT-BASED MILK MARKET, BY END-USER, 2022-2032 ($MILLION)
- TABLE 90. REST OF LAMEA PLANT-BASED MILK MARKET, BY MILK TYPE, 2022-2032 ($MILLION)
- TABLE 91. REST OF LAMEA PLANT-BASED MILK MARKET, BY DISTRIBUTION CHANNEL, 2022-2032 ($MILLION)
- TABLE 92. REST OF LAMEA PLANT-BASED MILK MARKET, BY END-USER, 2022-2032 ($MILLION)
- TABLE 93. PACIFIC FOODS OF OREGON, INC.: KEY EXECUTIVES
- TABLE 94. PACIFIC FOODS OF OREGON, INC.: COMPANY SNAPSHOT
- TABLE 95. THE HAIN CELESTIAL GROUP INC.: KEY EXECUTIVES
- TABLE 96. THE HAIN CELESTIAL GROUP INC.: COMPANY SNAPSHOT
- TABLE 97. EDWARD & SONS: KEY EXECUTIVES
- TABLE 98. EDWARD & SONS: COMPANY SNAPSHOT
- TABLE 99. EARTH'S OWN FOOD COMPANY INC.: KEY EXECUTIVES
- TABLE 100. EARTH'S OWN FOOD COMPANY INC.: COMPANY SNAPSHOT
- TABLE 101. GOYA FOODS, INC.: KEY EXECUTIVES
- TABLE 102. GOYA FOODS, INC.: COMPANY SNAPSHOT
- TABLE 103. MC CORMICK & CO.: KEY EXECUTIVES
- TABLE 104. MC CORMICK & CO.: COMPANY SNAPSHOT
- TABLE 105. SUNOPTA INC.: KEY EXECUTIVES
- TABLE 106. SUNOPTA INC.: COMPANY SNAPSHOT
- TABLE 107. CHEF'S CHOICE FOOD MANUFACTURER COMPANY LIMITED: KEY EXECUTIVES
- TABLE 108. CHEF'S CHOICE FOOD MANUFACTURER COMPANY LIMITED: COMPANY SNAPSHOT
- TABLE 109. THE HERSHEY COMPANY: KEY EXECUTIVES
- TABLE 110. THE HERSHEY COMPANY: COMPANY SNAPSHOT
- TABLE 111. VITASOY INTERNATIONAL HOLDINGS LIMITED: KEY EXECUTIVES
- TABLE 112. VITASOY INTERNATIONAL HOLDINGS LIMITED: COMPANY SNAPSHOT
LIST OF FIGURES
- FIGURE 01. PLANT-BASED MILK MARKET, 2022-2032
- FIGURE 02. SEGMENTATION OF PLANT-BASED MILK MARKET,2022-2032
- FIGURE 03. TOP IMPACTING FACTORS IN PLANT-BASED MILK MARKET
- FIGURE 04. TOP INVESTMENT POCKETS IN PLANT-BASED MILK MARKET (2023-2032)
- FIGURE 05. BARGAINING POWER OF SUPPLIERS
- FIGURE 06. BARGAINING POWER OF BUYERS
- FIGURE 07. THREAT OF SUBSTITUTION
- FIGURE 08. THREAT OF SUBSTITUTION
- FIGURE 09. COMPETITIVE RIVALRY
- FIGURE 10. GLOBAL PLANT-BASED MILK MARKET:DRIVERS, RESTRAINTS AND OPPORTUNITIES
- FIGURE 11. REGULATORY GUIDELINES: PLANT-BASED MILK MARKET
- FIGURE 12. IMPACT OF KEY REGULATION: PLANT-BASED MILK MARKET
- FIGURE 13. PATENT ANALYSIS BY COMPANY
- FIGURE 14. PATENT ANALYSIS BY COUNTRY
- FIGURE 15. PLANT-BASED MILK MARKET, BY MILK TYPE, 2022 AND 2032(%)
- FIGURE 16. COMPARATIVE SHARE ANALYSIS OF PLANT-BASED MILK MARKET FOR ALMOND, BY COUNTRY 2022 AND 2032(%)
- FIGURE 17. COMPARATIVE SHARE ANALYSIS OF PLANT-BASED MILK MARKET FOR SOY, BY COUNTRY 2022 AND 2032(%)
- FIGURE 18. COMPARATIVE SHARE ANALYSIS OF PLANT-BASED MILK MARKET FOR RICE, BY COUNTRY 2022 AND 2032(%)
- FIGURE 19. COMPARATIVE SHARE ANALYSIS OF PLANT-BASED MILK MARKET FOR OAT, BY COUNTRY 2022 AND 2032(%)
- FIGURE 20. COMPARATIVE SHARE ANALYSIS OF PLANT-BASED MILK MARKET FOR COCONUT, BY COUNTRY 2022 AND 2032(%)
- FIGURE 21. COMPARATIVE SHARE ANALYSIS OF PLANT-BASED MILK MARKET FOR OTHERS, BY COUNTRY 2022 AND 2032(%)
- FIGURE 22. PLANT-BASED MILK MARKET, BY DISTRIBUTION CHANNEL, 2022 AND 2032(%)
- FIGURE 23. COMPARATIVE SHARE ANALYSIS OF PLANT-BASED MILK MARKET FOR ONLINE, BY COUNTRY 2022 AND 2032(%)
- FIGURE 24. COMPARATIVE SHARE ANALYSIS OF PLANT-BASED MILK MARKET FOR SUPERMARKET, BY COUNTRY 2022 AND 2032(%)
- FIGURE 25. COMPARATIVE SHARE ANALYSIS OF PLANT-BASED MILK MARKET FOR CONVENIENCE STORES, BY COUNTRY 2022 AND 2032(%)
- FIGURE 26. PLANT-BASED MILK MARKET, BY END-USER, 2022 AND 2032(%)
- FIGURE 27. COMPARATIVE SHARE ANALYSIS OF PLANT-BASED MILK MARKET FOR RETAIL/HOUSEHOLD, BY COUNTRY 2022 AND 2032(%)
- FIGURE 28. COMPARATIVE SHARE ANALYSIS OF PLANT-BASED MILK MARKET FOR FOODSERVICES INDUSTRY, BY COUNTRY 2022 AND 2032(%)
- FIGURE 29. COMPARATIVE SHARE ANALYSIS OF PLANT-BASED MILK MARKET FOR FOOD AND BEVERAGE INDUSTRY, BY COUNTRY 2022 AND 2032(%)
- FIGURE 30. PLANT-BASED MILK MARKET BY REGION, 2022 AND 2032(%)
- FIGURE 31. U.S. PLANT-BASED MILK MARKET, 2022-2032 ($MILLION)
- FIGURE 32. CANADA PLANT-BASED MILK MARKET, 2022-2032 ($MILLION)
- FIGURE 33. MEXICO PLANT-BASED MILK MARKET, 2022-2032 ($MILLION)
- FIGURE 34. GERMANY PLANT-BASED MILK MARKET, 2022-2032 ($MILLION)
- FIGURE 35. UK PLANT-BASED MILK MARKET, 2022-2032 ($MILLION)
- FIGURE 36. FRANCE PLANT-BASED MILK MARKET, 2022-2032 ($MILLION)
- FIGURE 37. SPAIN PLANT-BASED MILK MARKET, 2022-2032 ($MILLION)
- FIGURE 38. ITALY PLANT-BASED MILK MARKET, 2022-2032 ($MILLION)
- FIGURE 39. REST OF EUROPE PLANT-BASED MILK MARKET, 2022-2032 ($MILLION)
- FIGURE 40. CHINA PLANT-BASED MILK MARKET, 2022-2032 ($MILLION)
- FIGURE 41. JAPAN PLANT-BASED MILK MARKET, 2022-2032 ($MILLION)
- FIGURE 42. INDIA PLANT-BASED MILK MARKET, 2022-2032 ($MILLION)
- FIGURE 43. SOUTH KOREA PLANT-BASED MILK MARKET, 2022-2032 ($MILLION)
- FIGURE 44. AUSTRALIA PLANT-BASED MILK MARKET, 2022-2032 ($MILLION)
- FIGURE 45. REST OF ASIA-PACIFIC PLANT-BASED MILK MARKET, 2022-2032 ($MILLION)
- FIGURE 46. BRAZIL PLANT-BASED MILK MARKET, 2022-2032 ($MILLION)
- FIGURE 47. UAE PLANT-BASED MILK MARKET, 2022-2032 ($MILLION)
- FIGURE 48. SAUDI ARABIA PLANT-BASED MILK MARKET, 2022-2032 ($MILLION)
- FIGURE 49. SOUTH AFRICA PLANT-BASED MILK MARKET, 2022-2032 ($MILLION)
- FIGURE 50. REST OF LAMEA PLANT-BASED MILK MARKET, 2022-2032 ($MILLION)
- FIGURE 51. PRODUCT MAPPING OF TOP 10 PLAYERS
- FIGURE 52. COMPETITIVE DASHBOARD
- FIGURE 53. COMPETITIVE HEATMAP: PLANT-BASED MILK MARKET
- FIGURE 54. TOP PLAYER POSITIONING, 2022
 植物奶市場 - 全球產業規模、佔有率、趨勢、機會和預測,按類型、類別、包裝、配銷通路、地區、競爭細分,2018-2028 年
 植物奶市場:按類型、按配方、按分銷渠道劃分 - 到 2030 年的全球預測
 全球植物奶市場 - 2023-2030 年
 植物奶的全球市場 (2023~2030年):各原料類型 (大豆、杏仁)、包裝類型 (瓶、硬紙盒包裝)、流通管道 (超級市場&大賣場、便利商店) 的規模、佔有率、成長分析、預測
 植物性奶的全球市場:產業趨勢與預測(~2030年)
 植物性牛奶的全球市場:無乳糖奶消費量的增長增加了消費者對植物奶的興趣