


 |
市場調查報告書
商品編碼
1414754
冷凍海鮮市場:按類型、型態和分銷管道分類:2023-2032 年全球機會分析和產業預測Frozen Seafood Market By Type, By Form, By Distribution Channel : Global Opportunity Analysis and Industry Forecast, 2023-2032 |
||||||
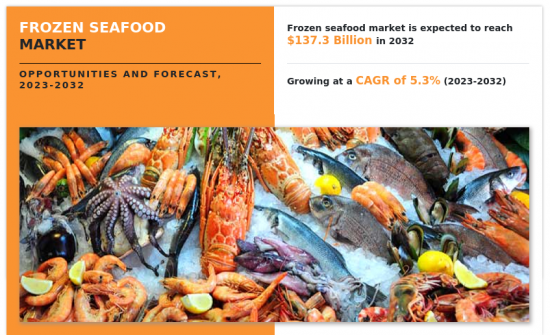
2022年冷凍海鮮市場價值為825億美元,預計2023年至2032年複合年成長率為5.3%,到2032年達到1373億美元。
冷凍海鮮是指經過顯著降低溫度並保持在低溫(通常低於-18度C)的保鮮過程中的水產品,以延長其保存期限。該工藝有效抑制微生物和酶活性,並保持各種魚貝類產品的產品品質。因此,為了維持這些好處,必須在連續的低溫運輸中保護和維持這些水產品的冷凍狀態。解凍是處理冷凍水產品的一個非常重要的步驟,因為它極大地影響產品的品質。此外,低溫快速解凍對於防止冷凍海鮮進出口過程中的品質劣化至關重要。總的來說,冷凍和適當的解凍方法對於冷凍海鮮的長期儲存至關重要,從而確保為消費者提供高品質的產品。
根據類型、型態、分銷管道和區域對冷凍海鮮市場進行分析。依種類分為冷凍魚類、冷凍甲殼類、冷凍軟體動物等。其中,冷凍魚領域預計將在 2022 年佔據市場主要佔有率,並在預測期內保持主導地位。注重健康的消費者需要貨架穩定且不含防腐劑的魚類產品,這符合更清潔、更天然食品的趨勢。美味冷凍的出現是為了滿足消費者想要在家享受餐廳品質海鮮的需求,該領域存在著巨大的市場潛力。便利因素也發揮著重要作用,消費者越來越優先考慮適合他們忙碌生活方式的產品。冷凍技術的進步極大地促進了冷凍魚的口味和品質的維持,這進一步增加了其市場需求。此外,水產品消費的增加和有吸引力的低價也是推動該領域市場成長的因素。憑藉適當的包裝技術、高效的運輸方法和建議的解凍工藝,冷凍魚仍然是一種方便且優質的海鮮選擇。隨著市場的發展並不斷適應消費者的偏好和需求,它將為冷凍魚產業的老牌和新興企業提供充滿活力的機會。總體而言,冷凍魚的需求預計將繼續成長,為各行業帶來多重好處和機會。
依型態,市場分為生冷凍魚貝類、已烹調魚貝類、已烹調魚貝類。新鮮冷凍海鮮領域是 2022 年的主要佔有率貢獻者。由於新鮮冷凍海鮮處於未加工的自然狀態並且易於透過各種零售管道獲得,因此對新鮮冷凍海鮮的可得性正在增加。生魚貝類比其他已烹調的魚貝類味道更新鮮,質地細膩。結果是透過海鮮的天然風味和質地增強了整體飲食體驗。生海鮮保留了天然營養成分,包括Omega-3脂肪酸、維生素和礦物質。這可能有助於提供更有營養的用餐選擇,並幫助注重健康的消費者根據自己的用餐偏好進行烹飪。生魚貝類通常經過最低限度的加工,使其成為尋求天然、無添加劑食品的消費者的便利選擇。此外,生冷凍魚貝類可用於各種菜餚,包括壽司、生魚片、酸橘汁醃魚和韃靼。您可以製作多樣化且創造性的菜餚。因此,新鮮和冷凍魚貝類預計將在整個期間保持其主導地位。
依分銷管道分類,市場分為超級市場/大賣場、百貨公司、B2B 和線上銷售管道。其中,由於冷凍海鮮產品易於獲取以及其他優勢,超級市場/大賣場細分市場將在 2022 年佔據主要市場佔有率,例如:
1 我們透過廣泛的選擇、有競爭力的價格、大量購買選擇、生鮮食品、促銷和充足的停車位,讓購物更有效率和經濟。超級市場可以被認為是專注於自助服務模式的大型購物中心。另一方面,大賣場是結合了超級市場、雜貨店、零售店、專賣店等多種零售業態特徵的大型自助倉庫和便利商店。大賣場通常被視為滿足顧客日常需求的一站式商店。冷凍魚貝類在大賣場和超級市場分銷管道的幫助下有很好的成長機會。原因是該產品很容易取得。消費者可以在這些類型的商店購買市場利基產品。因此,在廣泛的地點建立大賣場/超級市場為全球冷凍魚貝類市場的成長提供了有利可圖的機會。製造商透過這些大賣場提供特別折扣,鼓勵大賣場和超級市場超市主要銷售其產品。由於這些策略,製造商正在努力提高產品知名度,吸引消費者並促進冷凍海鮮市場的成長。
按地區分類,歐洲將在 2022 年主導冷凍海鮮市場,預計在預測期內這一趨勢將持續下去。歐洲消費者的快節奏生活方式導致了對冷凍海鮮的偏好,因為其準備工作最少且易於使用。對方便、易於準備的用餐的需求激增,推動了冷凍海鮮的便捷選擇。消費者的健康意識越來越強,也越來越意識到水產品的營養價值。此外,消費者越來越關注水產品產業的永續性和負責任的採購,這增加了對遵守環保做法的經過認證的冷凍海鮮產品的需求。冷凍和包裝技術的進步提高了冷凍海鮮的品質、質地和口味,使其對消費者極具吸引力。冷凍海鮮的保存期限比新鮮海鮮更長,可以減少食品廢棄物,並允許餐廳和其他食品批量購買。此外,線上銷售管道的興起以及實體店和數位市場冷凍海鮮的普及極大地擴大了消費者獲得冷凍海鮮的機會。因此,歐洲冷凍海鮮市場預計將穩定成長。
然而,疫情的爆發擾亂了全球供應鏈,影響了原料向製造單位的及時交付,並擾亂了冷凍海鮮產品的生產和分銷。此外,疫情也導致消費行為發生變化,許多人在家中自己準備食品。因此,在 COVID-19 大流行期間,對某些加工食品和冷凍食品(包括水產品)的需求大幅下降。消費行為的這些變化對冷凍海鮮市場產生了正面和負面的影響。冷凍海鮮產業分析的主要公司有 Sirena Group A/S、Sykes Seafood、Nueva Pescanova, SL、Beaver Street Fisheries, Inc.、High Liner Foods Incorporated、Leroy Seafood Group ASA、Maruha Nichiro Co., Ltd.、Thai Union Group Public Company Limited、Pacific Seafood Group 和Mazzetta Company, LLC。
目錄
第1章簡介
第 2 章執行摘要
第3章市場概況
- 市場定義和範圍
- 主要發現
- 影響因素
- 主要投資機會
- 波特五力分析
- 市場動態
- 促進因素
- 生活方式和消費者偏好的變化
- 女性勞動力快速增加
- 提高人們對各種海鮮的健康益處的認知
- 抑制因素
- 缺乏冷藏和運輸設施
- 人們越來越偏好新鮮海鮮
- 機會
- 對永續水產品的需求不斷增加
- 包裝和冷凍技術的進步
- 促進因素
第4章冷凍海鮮市場:依類型
- 概述
- 冷凍魚
- 冷凍甲殼類動物
- 冷凍軟體動物
- 其他
第5章冷凍海鮮市場:依型態
- 概述
- 生冷凍海鮮
- 已烹調的海鮮
- 即食海鮮
第6章冷凍海鮮市場:依通路分類
- 概述
- 超級市場-大賣場
- 百貨公司
- B2B
- 網路銷售管道
第7章冷凍海鮮市場:依地區
- 概述
- 北美洲
- 美國
- 加拿大
- 墨西哥
- 歐洲
- 德國
- 義大利
- 英國
- 法國
- 西班牙
- 其他
- 亞太地區
- 中國
- 印度
- 日本
- 澳洲
- 韓國
- 其他
- 拉丁美洲/中東/非洲
- 巴西
- 南非
- 阿根廷
- 其他
第8章 競爭形勢
- 介紹
- 關鍵成功策略
- 10家主要企業產品圖譜
- 競爭對手儀表板
- 競爭熱圖
- 2022年主要企業定位
第9章 公司簡介
- Sirena Group A/S
- Sykes Seafood
- Nueva Pescanova, SL
- Beaver Street Fisheries, Inc.
- High Liner Foods Incorporated
- Leroy Seafood Group ASA
- Maruha Nichiro Corporation
- Thai Union Group Public Company Limited.
- Pacific Seafood Group
- Mazzetta Company, LLC.
According to a new report published by Allied Market Research, titled, "Frozen Seafood Market," The frozen seafood market was valued at $82.5 billion in 2022, and is estimated to reach $137.3 billion by 2032, growing at a CAGR of 5.3% from 2023 to 2032.
Frozen seafood refers to seafood products that have been subjected to a preservation process in which their temperature is lowered significantly, typically to -18°C or below, and maintained at these low temperatures to extend their shelf life. This process effectively minimizes microbial and enzymatic activities, preserving product quality of various seafood. Thus, to maintain these benefits, the frozen state of these seafood must be protected and maintained within a continuous cold chain. Thawing is a crucial step in handling frozen seafood, as it significantly impacts product quality. In addition, swift thawing at lower temperatures is essential to prevent quality deterioration during import and export of frozen seafood products. Overall, freezing and proper thawing methods are vital in the preservation of frozen seafood for extended periods, which thus ensures delivery of high-quality products to consumers.
The frozen seafood market is analyzed on the basis of type, form, distribution channel, and region. By type, it is divided into frozen fish, frozen crustaceans, frozen mollusks, and others. Among these, the frozen fish segment occupied the major share of the market in 2022 and is anticipated to maintain its dominance during the forecast period. Health-conscious consumers are increasingly seeking shelf-stable and preservative-free fish products, aligning with the trend towards cleaner and more natural food options. The emergence of gourmet frozen fish caters to those who desire restaurant-quality seafood in the comfort of their homes, which presents huge market potential for this segment. The convenience factor also plays a significant role, with consumers increasingly prioritizing products that fit their busy lifestyles. Advances in freezing technology have contributed significantly in preserving the taste and quality of frozen fish, which has further enhanced its demand in the market. Moreover, the growing consumption of seafood and the attraction of lower prices are additional factors driving the market growth of this segment. Proper packaging techniques, efficient transportation methods, and recommended defrosting processes ensure that frozen fish maintains its dominance as a convenient and high-quality seafood option. As the market evolves, it will continue to adapt to consumer preferences and demands, which thus presents a dynamic landscape of opportunities for both established and emerging players in the frozen fish industry. Overall, the demand for frozen fish is expected to continue growing, offering multiple benefits and opportunities across various sectors.
Depending on form, the market is categorized into raw frozen seafood, pre-cooked seafood, and ready-to-eat seafood. The raw frozen seafood segment was the major share contributor in 2022. The demand for raw frozen seafood has increased owing to its availability in natural state without any processing and ease of availability through various retail channels. Raw seafood has a fresh taste and more delicate texture compared to other cooked seafood alternatives. As a result, it increases the overall dining experience through the natural flavors and textures of the seafood. Raw seafood retains its natural nutrients, including omega-3 fatty acids, vitamins, and minerals, as they are not lost through the cooking process. This may contribute to a more nutritious diet option and help health-conscious consumer to prepare it as per their dietary preferences. In its raw form, seafood typically undergoes minimal processing, which may be a convenient choice to those seeking natural and unadulterated food options. In addition, raw frozen seafood may be used in various culinary preparations, including sushi, sashimi, ceviche, and tartare. It allows for diverse and creative dishes to be prepared. Thus, the raw frozen seafood is expected to maintain its dominance throughout the period
As per distribution channel, the market is fragmented into supermarkets/hypermarkets, departmental stores, B2B, and online sales channel. Among these, the supermarkets/hypermarkets segment occupied the major share of the market in 2022 owing to the easy availability of frozen seafood products along with other benefits such as a wide selection of products, competitive prices, bulk shopping options, fresh produce, promotions, and ample parking facilities, making shopping more efficient and cost-effective. A supermarket can be regarded as a large shopping center focused on a self-service model. Whereas, a hypermarket is a large self-service warehouse and convenience store that combines the characteristics of various retail types, including supermarkets, grocery stores, retail outlets, and specialty shops. Hypermarkets are often seen as one-stop shops that cater to the daily requirements of customers. The frozen seafood has a good opportunity to grow with the help of hypermarkets & supermarkets distribution channel. The reason for this is easy availability of the products. Consumers have access to niche products on the market in these types of stores. Thus, the establishment of hypermarkets/supermarkets at a widespread location gives way to lucrative opportunities for the growth of the global market for frozen seafood. Manufacturers offer special discounts through these hypermarkets and encourage hypermarkets and supermarket chains to mainly sell their own products. For these strategies, manufacturers are making efforts to increase the visibility of the products, which attracts consumers and contributes to the growth of the frozen seafood market.
Region wise, Europe dominated the frozen seafood market in 2022 and is anticipated to continue the same trend during the forecast period. The fast-paced lifestyles of European consumers have led them to favor frozen seafood for its ease of use, which thus demands minimal preparation. The surge in demand for convenient and easily prepared meals has propelled frozen seafood as a convenient choice. Consumers are increasingly health-conscious, which has led to increased awareness of the nutritional benefits of seafood. In addition, the increased emphasis on sustainability and responsible sourcing of seafood industry among the consumers has driven the need for certified frozen seafood products that adhere to environmentally friendly practices. Advancements in freezing and packaging technologies has enhanced the quality, texture, and taste of frozen seafood, making it exceptionally attractive to consumers. Frozen seafood, with its extended shelf life compared to fresh alternatives, reduces food waste, and enables bulk purchasing for restaurants and other food outlets. Furthermore, the rise of online sales channels and the widespread availability of frozen seafood in physical stores and digital marketplaces have greatly expanded consumer access to these products. As a result, the frozen seafood market in Europe is expected to experience steady growth.
However, the outbreak of the pandemic has disrupted the global supply chains, affecting the timely delivery of raw materials and ingredients to manufacturing units, thus hampering the production & distribution of frozen seafood products. In addition, the pandemic has led to changes in consumer behavior, with many people staying at home and preparing food items themselves. This has significantly reduced the demand for certain processed and frozen food including seafood during the COVID-19 pandemic. These changes in consumer behavior have had both positive and negative impacts on the frozen seafood market. The major players analyzed for the frozen seafood industry include Sirena Group A/S, Sykes Seafood, Nueva Pescanova, S.L., Beaver Street Fisheries, Inc., High Liner Foods Incorporated, Leroy Seafood Group ASA, Maruha Nichiro Corporation, Thai Union Group Public Company Limited, Pacific Seafood Group, and Mazzetta Company, LLC.
Key Benefits For Stakeholders
- This report provides a quantitative analysis of the market segments, current trends, estimations, and dynamics of the frozen seafood market analysis from 2022 to 2032 to identify the prevailing frozen seafood market opportunities.
- The market research is offered along with information related to key drivers, restraints, and opportunities.
- Porter's five forces analysis highlights the potency of buyers and suppliers to enable stakeholders make profit-oriented business decisions and strengthen their supplier-buyer network.
- In-depth analysis of the frozen seafood market segmentation assists to determine the prevailing market opportunities.
- Major countries in each region are mapped according to their revenue contribution to the global market.
- Market player positioning facilitates benchmarking and provides a clear understanding of the present position of the market players.
- The report includes the analysis of the regional as well as global frozen seafood market trends, key players, market segments, application areas, and market growth strategies.
Additional benefits you will get with this purchase are:
- Quarterly Update and* (only available with a corporate license, on listed price)
- 5 additional Company Profile of client Choice pre- or Post-purchase, as a free update.
- Free Upcoming Version on the Purchase of Five and Enterprise User License.
- 16 analyst hours of support* (post-purchase, if you find additional data requirements upon review of the report, you may receive support amounting to 16 analyst hours to solve questions, and post-sale queries)
- 15% Free Customization* (in case the scope or segment of the report does not match your requirements, 15% is equivalent to 3 working days of free work, applicable once)
- Free data Pack on the Five and Enterprise User License. (Excel version of the report)
- Free Updated report if the report is 6-12 months old or older.
- 24-hour priority response*
- Free Industry updates and white papers.
Possible Customization with this report (with additional cost and timeline, please talk to the sales executive to know more)
- Consumer Buying Behavior Analysis
- Investment Opportunities
- Supply Chain Analysis & Vendor Margins
- Technology Trend Analysis
- Average Consumer Expenditure
- Market share analysis of players by products/segments
- Regulatory Guidelines
- Additional company profiles with specific to client's interest
- Additional country or region analysis- market size and forecast
- Average Selling Price Analysis / Price Point Analysis
- Expanded list for Company Profiles
- Historic market data
- Key player details (including location, contact details, supplier/vendor network etc. in excel format)
- Product Consumption Analysis
- SWOT Analysis
- Volume Market Size and Forecast
Key Market Segments
By Form
- Raw Frozen Seafood
- Pre-Cooked Seafood
- Ready-To-Eat Seafood
By Distribution Channel
- Supermarkets-Hypermarkets
- Departmental Stores
- B2B
- Online Sales Channel
By Type
- Frozen Fish
- Frozen Crustaceans
- Frozen Mollusks
- Others
By Region
- North America
- U.S.
- Canada
- Mexico
- Europe
- Germany
- Italy
- UK
- France
- Spain
- Rest of Europe
- Asia-Pacific
- China
- India
- Japan
- Australia
- South Korea
- Rest of Asia-Pacific
- LAMEA
- Brazil
- South Africa
- Argentina
- Rest of LAMEA
Key Market Players:
- High Liner Foods Incorporated
- Maruha Nichiro Corporation
- Thai Union Group Public Company Limited.
- Sykes Seafood
- Beaver Street Fisheries, Inc.
- Sirena Group A/S
- Nueva Pescanova, S.L.
- Leroy Seafood Group ASA
- Mazzetta Company, LLC.
- Pacific Seafood Group
TABLE OF CONTENTS
CHAPTER 1: INTRODUCTION
- 1.1. Report description
- 1.2. Key market segments
- 1.3. Key benefits to the stakeholders
- 1.4. Research methodology
- 1.4.1. Primary research
- 1.4.2. Secondary research
- 1.4.3. Analyst tools and models
CHAPTER 2: EXECUTIVE SUMMARY
- 2.1. CXO Perspective
CHAPTER 3: MARKET OVERVIEW
- 3.1. Market definition and scope
- 3.2. Key findings
- 3.2.1. Top impacting factors
- 3.2.2. Top investment pockets
- 3.3. Porter's five forces analysis
- 3.3.1. Moderate bargaining power of suppliers
- 3.3.2. Moderate threat of new entrants
- 3.3.3. Moderate threat of substitutes
- 3.3.4. High intensity of rivalry
- 3.3.5. Moderate bargaining power of buyers
- 3.4. Market dynamics
- 3.4.1. Drivers
- 3.4.1.1. Change in lifestyle & consumer preference
- 3.4.1.2. Surge in female working population
- 3.4.1.3. Increase in awareness regarding the health benefits associated with various seafood
- 3.4.2. Restraints
- 3.4.2.1. Inadequate cold storage and transportation facilities
- 3.4.2.2. Growing preference for fresh seafood products
- 3.4.3. Opportunities
- 3.4.3.1. Increase in demand for sustainable seafood
- 3.4.3.2. Advances in packaging and freezing technology
- 3.4.1. Drivers
CHAPTER 4: FROZEN SEAFOOD MARKET, BY TYPE
- 4.1. Overview
- 4.1.1. Market size and forecast
- 4.2. Frozen Fish
- 4.2.1. Key market trends, growth factors and opportunities
- 4.2.2. Market size and forecast, by region
- 4.2.3. Market share analysis by country
- 4.3. Frozen Crustaceans
- 4.3.1. Key market trends, growth factors and opportunities
- 4.3.2. Market size and forecast, by region
- 4.3.3. Market share analysis by country
- 4.4. Frozen Mollusks
- 4.4.1. Key market trends, growth factors and opportunities
- 4.4.2. Market size and forecast, by region
- 4.4.3. Market share analysis by country
- 4.5. Others
- 4.5.1. Key market trends, growth factors and opportunities
- 4.5.2. Market size and forecast, by region
- 4.5.3. Market share analysis by country
CHAPTER 5: FROZEN SEAFOOD MARKET, BY FORM
- 5.1. Overview
- 5.1.1. Market size and forecast
- 5.2. Raw Frozen Seafood
- 5.2.1. Key market trends, growth factors and opportunities
- 5.2.2. Market size and forecast, by region
- 5.2.3. Market share analysis by country
- 5.3. Pre-Cooked Seafood
- 5.3.1. Key market trends, growth factors and opportunities
- 5.3.2. Market size and forecast, by region
- 5.3.3. Market share analysis by country
- 5.4. Ready-To-Eat Seafood
- 5.4.1. Key market trends, growth factors and opportunities
- 5.4.2. Market size and forecast, by region
- 5.4.3. Market share analysis by country
CHAPTER 6: FROZEN SEAFOOD MARKET, BY DISTRIBUTION CHANNEL
- 6.1. Overview
- 6.1.1. Market size and forecast
- 6.2. Supermarkets-Hypermarkets
- 6.2.1. Key market trends, growth factors and opportunities
- 6.2.2. Market size and forecast, by region
- 6.2.3. Market share analysis by country
- 6.3. Departmental Stores
- 6.3.1. Key market trends, growth factors and opportunities
- 6.3.2. Market size and forecast, by region
- 6.3.3. Market share analysis by country
- 6.4. B2B
- 6.4.1. Key market trends, growth factors and opportunities
- 6.4.2. Market size and forecast, by region
- 6.4.3. Market share analysis by country
- 6.5. Online Sales Channel
- 6.5.1. Key market trends, growth factors and opportunities
- 6.5.2. Market size and forecast, by region
- 6.5.3. Market share analysis by country
CHAPTER 7: FROZEN SEAFOOD MARKET, BY REGION
- 7.1. Overview
- 7.1.1. Market size and forecast By Region
- 7.2. North America
- 7.2.1. Key market trends, growth factors and opportunities
- 7.2.2. Market size and forecast, by Type
- 7.2.3. Market size and forecast, by Form
- 7.2.4. Market size and forecast, by Distribution Channel
- 7.2.5. Market size and forecast, by country
- 7.2.5.1. U.S.
- 7.2.5.1.1. Market size and forecast, by Type
- 7.2.5.1.2. Market size and forecast, by Form
- 7.2.5.1.3. Market size and forecast, by Distribution Channel
- 7.2.5.2. Canada
- 7.2.5.2.1. Market size and forecast, by Type
- 7.2.5.2.2. Market size and forecast, by Form
- 7.2.5.2.3. Market size and forecast, by Distribution Channel
- 7.2.5.3. Mexico
- 7.2.5.3.1. Market size and forecast, by Type
- 7.2.5.3.2. Market size and forecast, by Form
- 7.2.5.3.3. Market size and forecast, by Distribution Channel
- 7.3. Europe
- 7.3.1. Key market trends, growth factors and opportunities
- 7.3.2. Market size and forecast, by Type
- 7.3.3. Market size and forecast, by Form
- 7.3.4. Market size and forecast, by Distribution Channel
- 7.3.5. Market size and forecast, by country
- 7.3.5.1. Germany
- 7.3.5.1.1. Market size and forecast, by Type
- 7.3.5.1.2. Market size and forecast, by Form
- 7.3.5.1.3. Market size and forecast, by Distribution Channel
- 7.3.5.2. Italy
- 7.3.5.2.1. Market size and forecast, by Type
- 7.3.5.2.2. Market size and forecast, by Form
- 7.3.5.2.3. Market size and forecast, by Distribution Channel
- 7.3.5.3. UK
- 7.3.5.3.1. Market size and forecast, by Type
- 7.3.5.3.2. Market size and forecast, by Form
- 7.3.5.3.3. Market size and forecast, by Distribution Channel
- 7.3.5.4. France
- 7.3.5.4.1. Market size and forecast, by Type
- 7.3.5.4.2. Market size and forecast, by Form
- 7.3.5.4.3. Market size and forecast, by Distribution Channel
- 7.3.5.5. Spain
- 7.3.5.5.1. Market size and forecast, by Type
- 7.3.5.5.2. Market size and forecast, by Form
- 7.3.5.5.3. Market size and forecast, by Distribution Channel
- 7.3.5.6. Rest of Europe
- 7.3.5.6.1. Market size and forecast, by Type
- 7.3.5.6.2. Market size and forecast, by Form
- 7.3.5.6.3. Market size and forecast, by Distribution Channel
- 7.4. Asia-Pacific
- 7.4.1. Key market trends, growth factors and opportunities
- 7.4.2. Market size and forecast, by Type
- 7.4.3. Market size and forecast, by Form
- 7.4.4. Market size and forecast, by Distribution Channel
- 7.4.5. Market size and forecast, by country
- 7.4.5.1. China
- 7.4.5.1.1. Market size and forecast, by Type
- 7.4.5.1.2. Market size and forecast, by Form
- 7.4.5.1.3. Market size and forecast, by Distribution Channel
- 7.4.5.2. India
- 7.4.5.2.1. Market size and forecast, by Type
- 7.4.5.2.2. Market size and forecast, by Form
- 7.4.5.2.3. Market size and forecast, by Distribution Channel
- 7.4.5.3. Japan
- 7.4.5.3.1. Market size and forecast, by Type
- 7.4.5.3.2. Market size and forecast, by Form
- 7.4.5.3.3. Market size and forecast, by Distribution Channel
- 7.4.5.4. Australia
- 7.4.5.4.1. Market size and forecast, by Type
- 7.4.5.4.2. Market size and forecast, by Form
- 7.4.5.4.3. Market size and forecast, by Distribution Channel
- 7.4.5.5. South Korea
- 7.4.5.5.1. Market size and forecast, by Type
- 7.4.5.5.2. Market size and forecast, by Form
- 7.4.5.5.3. Market size and forecast, by Distribution Channel
- 7.4.5.6. Rest of Asia-Pacific
- 7.4.5.6.1. Market size and forecast, by Type
- 7.4.5.6.2. Market size and forecast, by Form
- 7.4.5.6.3. Market size and forecast, by Distribution Channel
- 7.5. LAMEA
- 7.5.1. Key market trends, growth factors and opportunities
- 7.5.2. Market size and forecast, by Type
- 7.5.3. Market size and forecast, by Form
- 7.5.4. Market size and forecast, by Distribution Channel
- 7.5.5. Market size and forecast, by country
- 7.5.5.1. Brazil
- 7.5.5.1.1. Market size and forecast, by Type
- 7.5.5.1.2. Market size and forecast, by Form
- 7.5.5.1.3. Market size and forecast, by Distribution Channel
- 7.5.5.2. South Africa
- 7.5.5.2.1. Market size and forecast, by Type
- 7.5.5.2.2. Market size and forecast, by Form
- 7.5.5.2.3. Market size and forecast, by Distribution Channel
- 7.5.5.3. Argentina
- 7.5.5.3.1. Market size and forecast, by Type
- 7.5.5.3.2. Market size and forecast, by Form
- 7.5.5.3.3. Market size and forecast, by Distribution Channel
- 7.5.5.4. Rest of LAMEA
- 7.5.5.4.1. Market size and forecast, by Type
- 7.5.5.4.2. Market size and forecast, by Form
- 7.5.5.4.3. Market size and forecast, by Distribution Channel
CHAPTER 8: COMPETITIVE LANDSCAPE
- 8.1. Introduction
- 8.2. Top winning strategies
- 8.3. Product mapping of top 10 player
- 8.4. Competitive dashboard
- 8.5. Competitive heatmap
- 8.6. Top player positioning, 2022
CHAPTER 9: COMPANY PROFILES
- 9.1. Sirena Group A/S
- 9.1.1. Company overview
- 9.1.2. Key executives
- 9.1.3. Company snapshot
- 9.1.4. Operating business segments
- 9.1.5. Product portfolio
- 9.2. Sykes Seafood
- 9.2.1. Company overview
- 9.2.2. Key executives
- 9.2.3. Company snapshot
- 9.2.4. Operating business segments
- 9.2.5. Product portfolio
- 9.2.6. Key strategic moves and developments
- 9.3. Nueva Pescanova, S.L.
- 9.3.1. Company overview
- 9.3.2. Key executives
- 9.3.3. Company snapshot
- 9.3.4. Operating business segments
- 9.3.5. Product portfolio
- 9.4. Beaver Street Fisheries, Inc.
- 9.4.1. Company overview
- 9.4.2. Key executives
- 9.4.3. Company snapshot
- 9.4.4. Operating business segments
- 9.4.5. Product portfolio
- 9.4.6. Key strategic moves and developments
- 9.5. High Liner Foods Incorporated
- 9.5.1. Company overview
- 9.5.2. Key executives
- 9.5.3. Company snapshot
- 9.5.4. Operating business segments
- 9.5.5. Product portfolio
- 9.5.6. Business performance
- 9.6. Leroy Seafood Group ASA
- 9.6.1. Company overview
- 9.6.2. Key executives
- 9.6.3. Company snapshot
- 9.6.4. Operating business segments
- 9.6.5. Product portfolio
- 9.6.6. Business performance
- 9.6.7. Key strategic moves and developments
- 9.7. Maruha Nichiro Corporation
- 9.7.1. Company overview
- 9.7.2. Key executives
- 9.7.3. Company snapshot
- 9.7.4. Operating business segments
- 9.7.5. Product portfolio
- 9.7.6. Business performance
- 9.8. Thai Union Group Public Company Limited.
- 9.8.1. Company overview
- 9.8.2. Key executives
- 9.8.3. Company snapshot
- 9.8.4. Operating business segments
- 9.8.5. Product portfolio
- 9.8.6. Business performance
- 9.8.7. Key strategic moves and developments
- 9.9. Pacific Seafood Group
- 9.9.1. Company overview
- 9.9.2. Key executives
- 9.9.3. Company snapshot
- 9.9.4. Operating business segments
- 9.9.5. Product portfolio
- 9.10. Mazzetta Company, LLC.
- 9.10.1. Company overview
- 9.10.2. Key executives
- 9.10.3. Company snapshot
- 9.10.4. Operating business segments
- 9.10.5. Product portfolio
LIST OF TABLES
- TABLE 01. GLOBAL FROZEN SEAFOOD MARKET, BY TYPE, 2022-2032 ($MILLION)
- TABLE 02. FROZEN SEAFOOD MARKET FOR FROZEN FISH, BY REGION, 2022-2032 ($MILLION)
- TABLE 03. FROZEN SEAFOOD MARKET FOR FROZEN CRUSTACEANS, BY REGION, 2022-2032 ($MILLION)
- TABLE 04. FROZEN SEAFOOD MARKET FOR FROZEN MOLLUSKS, BY REGION, 2022-2032 ($MILLION)
- TABLE 05. FROZEN SEAFOOD MARKET FOR OTHERS, BY REGION, 2022-2032 ($MILLION)
- TABLE 06. GLOBAL FROZEN SEAFOOD MARKET, BY FORM, 2022-2032 ($MILLION)
- TABLE 07. FROZEN SEAFOOD MARKET FOR RAW FROZEN SEAFOOD, BY REGION, 2022-2032 ($MILLION)
- TABLE 08. FROZEN SEAFOOD MARKET FOR PRE-COOKED SEAFOOD, BY REGION, 2022-2032 ($MILLION)
- TABLE 09. FROZEN SEAFOOD MARKET FOR READY-TO-EAT SEAFOOD, BY REGION, 2022-2032 ($MILLION)
- TABLE 10. GLOBAL FROZEN SEAFOOD MARKET, BY DISTRIBUTION CHANNEL, 2022-2032 ($MILLION)
- TABLE 11. FROZEN SEAFOOD MARKET FOR SUPERMARKETS-HYPERMARKETS, BY REGION, 2022-2032 ($MILLION)
- TABLE 12. FROZEN SEAFOOD MARKET FOR DEPARTMENTAL STORES, BY REGION, 2022-2032 ($MILLION)
- TABLE 13. FROZEN SEAFOOD MARKET FOR B2B, BY REGION, 2022-2032 ($MILLION)
- TABLE 14. FROZEN SEAFOOD MARKET FOR ONLINE SALES CHANNEL, BY REGION, 2022-2032 ($MILLION)
- TABLE 15. FROZEN SEAFOOD MARKET, BY REGION, 2022-2032 ($MILLION)
- TABLE 16. NORTH AMERICA FROZEN SEAFOOD MARKET, BY TYPE, 2022-2032 ($MILLION)
- TABLE 17. NORTH AMERICA FROZEN SEAFOOD MARKET, BY FORM, 2022-2032 ($MILLION)
- TABLE 18. NORTH AMERICA FROZEN SEAFOOD MARKET, BY DISTRIBUTION CHANNEL, 2022-2032 ($MILLION)
- TABLE 19. NORTH AMERICA FROZEN SEAFOOD MARKET, BY COUNTRY, 2022-2032 ($MILLION)
- TABLE 20. U.S. FROZEN SEAFOOD MARKET, BY TYPE, 2022-2032 ($MILLION)
- TABLE 21. U.S. FROZEN SEAFOOD MARKET, BY FORM, 2022-2032 ($MILLION)
- TABLE 22. U.S. FROZEN SEAFOOD MARKET, BY DISTRIBUTION CHANNEL, 2022-2032 ($MILLION)
- TABLE 23. CANADA FROZEN SEAFOOD MARKET, BY TYPE, 2022-2032 ($MILLION)
- TABLE 24. CANADA FROZEN SEAFOOD MARKET, BY FORM, 2022-2032 ($MILLION)
- TABLE 25. CANADA FROZEN SEAFOOD MARKET, BY DISTRIBUTION CHANNEL, 2022-2032 ($MILLION)
- TABLE 26. MEXICO FROZEN SEAFOOD MARKET, BY TYPE, 2022-2032 ($MILLION)
- TABLE 27. MEXICO FROZEN SEAFOOD MARKET, BY FORM, 2022-2032 ($MILLION)
- TABLE 28. MEXICO FROZEN SEAFOOD MARKET, BY DISTRIBUTION CHANNEL, 2022-2032 ($MILLION)
- TABLE 29. EUROPE FROZEN SEAFOOD MARKET, BY TYPE, 2022-2032 ($MILLION)
- TABLE 30. EUROPE FROZEN SEAFOOD MARKET, BY FORM, 2022-2032 ($MILLION)
- TABLE 31. EUROPE FROZEN SEAFOOD MARKET, BY DISTRIBUTION CHANNEL, 2022-2032 ($MILLION)
- TABLE 32. EUROPE FROZEN SEAFOOD MARKET, BY COUNTRY, 2022-2032 ($MILLION)
- TABLE 33. GERMANY FROZEN SEAFOOD MARKET, BY TYPE, 2022-2032 ($MILLION)
- TABLE 34. GERMANY FROZEN SEAFOOD MARKET, BY FORM, 2022-2032 ($MILLION)
- TABLE 35. GERMANY FROZEN SEAFOOD MARKET, BY DISTRIBUTION CHANNEL, 2022-2032 ($MILLION)
- TABLE 36. ITALY FROZEN SEAFOOD MARKET, BY TYPE, 2022-2032 ($MILLION)
- TABLE 37. ITALY FROZEN SEAFOOD MARKET, BY FORM, 2022-2032 ($MILLION)
- TABLE 38. ITALY FROZEN SEAFOOD MARKET, BY DISTRIBUTION CHANNEL, 2022-2032 ($MILLION)
- TABLE 39. UK FROZEN SEAFOOD MARKET, BY TYPE, 2022-2032 ($MILLION)
- TABLE 40. UK FROZEN SEAFOOD MARKET, BY FORM, 2022-2032 ($MILLION)
- TABLE 41. UK FROZEN SEAFOOD MARKET, BY DISTRIBUTION CHANNEL, 2022-2032 ($MILLION)
- TABLE 42. FRANCE FROZEN SEAFOOD MARKET, BY TYPE, 2022-2032 ($MILLION)
- TABLE 43. FRANCE FROZEN SEAFOOD MARKET, BY FORM, 2022-2032 ($MILLION)
- TABLE 44. FRANCE FROZEN SEAFOOD MARKET, BY DISTRIBUTION CHANNEL, 2022-2032 ($MILLION)
- TABLE 45. SPAIN FROZEN SEAFOOD MARKET, BY TYPE, 2022-2032 ($MILLION)
- TABLE 46. SPAIN FROZEN SEAFOOD MARKET, BY FORM, 2022-2032 ($MILLION)
- TABLE 47. SPAIN FROZEN SEAFOOD MARKET, BY DISTRIBUTION CHANNEL, 2022-2032 ($MILLION)
- TABLE 48. REST OF EUROPE FROZEN SEAFOOD MARKET, BY TYPE, 2022-2032 ($MILLION)
- TABLE 49. REST OF EUROPE FROZEN SEAFOOD MARKET, BY FORM, 2022-2032 ($MILLION)
- TABLE 50. REST OF EUROPE FROZEN SEAFOOD MARKET, BY DISTRIBUTION CHANNEL, 2022-2032 ($MILLION)
- TABLE 51. ASIA-PACIFIC FROZEN SEAFOOD MARKET, BY TYPE, 2022-2032 ($MILLION)
- TABLE 52. ASIA-PACIFIC FROZEN SEAFOOD MARKET, BY FORM, 2022-2032 ($MILLION)
- TABLE 53. ASIA-PACIFIC FROZEN SEAFOOD MARKET, BY DISTRIBUTION CHANNEL, 2022-2032 ($MILLION)
- TABLE 54. ASIA-PACIFIC FROZEN SEAFOOD MARKET, BY COUNTRY, 2022-2032 ($MILLION)
- TABLE 55. CHINA FROZEN SEAFOOD MARKET, BY TYPE, 2022-2032 ($MILLION)
- TABLE 56. CHINA FROZEN SEAFOOD MARKET, BY FORM, 2022-2032 ($MILLION)
- TABLE 57. CHINA FROZEN SEAFOOD MARKET, BY DISTRIBUTION CHANNEL, 2022-2032 ($MILLION)
- TABLE 58. INDIA FROZEN SEAFOOD MARKET, BY TYPE, 2022-2032 ($MILLION)
- TABLE 59. INDIA FROZEN SEAFOOD MARKET, BY FORM, 2022-2032 ($MILLION)
- TABLE 60. INDIA FROZEN SEAFOOD MARKET, BY DISTRIBUTION CHANNEL, 2022-2032 ($MILLION)
- TABLE 61. JAPAN FROZEN SEAFOOD MARKET, BY TYPE, 2022-2032 ($MILLION)
- TABLE 62. JAPAN FROZEN SEAFOOD MARKET, BY FORM, 2022-2032 ($MILLION)
- TABLE 63. JAPAN FROZEN SEAFOOD MARKET, BY DISTRIBUTION CHANNEL, 2022-2032 ($MILLION)
- TABLE 64. AUSTRALIA FROZEN SEAFOOD MARKET, BY TYPE, 2022-2032 ($MILLION)
- TABLE 65. AUSTRALIA FROZEN SEAFOOD MARKET, BY FORM, 2022-2032 ($MILLION)
- TABLE 66. AUSTRALIA FROZEN SEAFOOD MARKET, BY DISTRIBUTION CHANNEL, 2022-2032 ($MILLION)
- TABLE 67. SOUTH KOREA FROZEN SEAFOOD MARKET, BY TYPE, 2022-2032 ($MILLION)
- TABLE 68. SOUTH KOREA FROZEN SEAFOOD MARKET, BY FORM, 2022-2032 ($MILLION)
- TABLE 69. SOUTH KOREA FROZEN SEAFOOD MARKET, BY DISTRIBUTION CHANNEL, 2022-2032 ($MILLION)
- TABLE 70. REST OF ASIA-PACIFIC FROZEN SEAFOOD MARKET, BY TYPE, 2022-2032 ($MILLION)
- TABLE 71. REST OF ASIA-PACIFIC FROZEN SEAFOOD MARKET, BY FORM, 2022-2032 ($MILLION)
- TABLE 72. REST OF ASIA-PACIFIC FROZEN SEAFOOD MARKET, BY DISTRIBUTION CHANNEL, 2022-2032 ($MILLION)
- TABLE 73. LAMEA FROZEN SEAFOOD MARKET, BY TYPE, 2022-2032 ($MILLION)
- TABLE 74. LAMEA FROZEN SEAFOOD MARKET, BY FORM, 2022-2032 ($MILLION)
- TABLE 75. LAMEA FROZEN SEAFOOD MARKET, BY DISTRIBUTION CHANNEL, 2022-2032 ($MILLION)
- TABLE 76. LAMEA FROZEN SEAFOOD MARKET, BY COUNTRY, 2022-2032 ($MILLION)
- TABLE 77. BRAZIL FROZEN SEAFOOD MARKET, BY TYPE, 2022-2032 ($MILLION)
- TABLE 78. BRAZIL FROZEN SEAFOOD MARKET, BY FORM, 2022-2032 ($MILLION)
- TABLE 79. BRAZIL FROZEN SEAFOOD MARKET, BY DISTRIBUTION CHANNEL, 2022-2032 ($MILLION)
- TABLE 80. SOUTH AFRICA FROZEN SEAFOOD MARKET, BY TYPE, 2022-2032 ($MILLION)
- TABLE 81. SOUTH AFRICA FROZEN SEAFOOD MARKET, BY FORM, 2022-2032 ($MILLION)
- TABLE 82. SOUTH AFRICA FROZEN SEAFOOD MARKET, BY DISTRIBUTION CHANNEL, 2022-2032 ($MILLION)
- TABLE 83. ARGENTINA FROZEN SEAFOOD MARKET, BY TYPE, 2022-2032 ($MILLION)
- TABLE 84. ARGENTINA FROZEN SEAFOOD MARKET, BY FORM, 2022-2032 ($MILLION)
- TABLE 85. ARGENTINA FROZEN SEAFOOD MARKET, BY DISTRIBUTION CHANNEL, 2022-2032 ($MILLION)
- TABLE 86. REST OF LAMEA FROZEN SEAFOOD MARKET, BY TYPE, 2022-2032 ($MILLION)
- TABLE 87. REST OF LAMEA FROZEN SEAFOOD MARKET, BY FORM, 2022-2032 ($MILLION)
- TABLE 88. REST OF LAMEA FROZEN SEAFOOD MARKET, BY DISTRIBUTION CHANNEL, 2022-2032 ($MILLION)
- TABLE 89. SIRENA GROUP A/S: KEY EXECUTIVES
- TABLE 90. SIRENA GROUP A/S: COMPANY SNAPSHOT
- TABLE 91. SIRENA GROUP A/S: PRODUCT SEGMENTS
- TABLE 92. SIRENA GROUP A/S: PRODUCT PORTFOLIO
- TABLE 93. SYKES SEAFOOD: KEY EXECUTIVES
- TABLE 94. SYKES SEAFOOD: COMPANY SNAPSHOT
- TABLE 95. SYKES SEAFOOD: PRODUCT SEGMENTS
- TABLE 96. SYKES SEAFOOD: PRODUCT PORTFOLIO
- TABLE 97. SYKES SEAFOOD: KEY STRATERGIES
- TABLE 98. NUEVA PESCANOVA, S.L.: KEY EXECUTIVES
- TABLE 99. NUEVA PESCANOVA, S.L.: COMPANY SNAPSHOT
- TABLE 100. NUEVA PESCANOVA, S.L.: PRODUCT SEGMENTS
- TABLE 101. NUEVA PESCANOVA, S.L.: PRODUCT PORTFOLIO
- TABLE 102. BEAVER STREET FISHERIES, INC.: KEY EXECUTIVES
- TABLE 103. BEAVER STREET FISHERIES, INC.: COMPANY SNAPSHOT
- TABLE 104. BEAVER STREET FISHERIES, INC.: PRODUCT SEGMENTS
- TABLE 105. BEAVER STREET FISHERIES, INC.: PRODUCT PORTFOLIO
- TABLE 106. BEAVER STREET FISHERIES, INC.: KEY STRATERGIES
- TABLE 107. HIGH LINER FOODS INCORPORATED: KEY EXECUTIVES
- TABLE 108. HIGH LINER FOODS INCORPORATED: COMPANY SNAPSHOT
- TABLE 109. HIGH LINER FOODS INCORPORATED: PRODUCT SEGMENTS
- TABLE 110. HIGH LINER FOODS INCORPORATED: PRODUCT PORTFOLIO
- TABLE 111. LEROY SEAFOOD GROUP ASA: KEY EXECUTIVES
- TABLE 112. LEROY SEAFOOD GROUP ASA: COMPANY SNAPSHOT
- TABLE 113. LEROY SEAFOOD GROUP ASA: PRODUCT SEGMENTS
- TABLE 114. LEROY SEAFOOD GROUP ASA: PRODUCT PORTFOLIO
- TABLE 115. LEROY SEAFOOD GROUP ASA: KEY STRATERGIES
- TABLE 116. MARUHA NICHIRO CORPORATION: KEY EXECUTIVES
- TABLE 117. MARUHA NICHIRO CORPORATION: COMPANY SNAPSHOT
- TABLE 118. MARUHA NICHIRO CORPORATION: PRODUCT SEGMENTS
- TABLE 119. MARUHA NICHIRO CORPORATION: PRODUCT PORTFOLIO
- TABLE 120. THAI UNION GROUP PUBLIC COMPANY LIMITED.: KEY EXECUTIVES
- TABLE 121. THAI UNION GROUP PUBLIC COMPANY LIMITED.: COMPANY SNAPSHOT
- TABLE 122. THAI UNION GROUP PUBLIC COMPANY LIMITED.: PRODUCT SEGMENTS
- TABLE 123. THAI UNION GROUP PUBLIC COMPANY LIMITED.: PRODUCT PORTFOLIO
- TABLE 124. THAI UNION GROUP PUBLIC COMPANY LIMITED.: KEY STRATERGIES
- TABLE 125. PACIFIC SEAFOOD GROUP: KEY EXECUTIVES
- TABLE 126. PACIFIC SEAFOOD GROUP: COMPANY SNAPSHOT
- TABLE 127. PACIFIC SEAFOOD GROUP: PRODUCT SEGMENTS
- TABLE 128. PACIFIC SEAFOOD GROUP: PRODUCT PORTFOLIO
- TABLE 129. MAZZETTA COMPANY, LLC.: KEY EXECUTIVES
- TABLE 130. MAZZETTA COMPANY, LLC.: COMPANY SNAPSHOT
- TABLE 131. MAZZETTA COMPANY, LLC.: PRODUCT SEGMENTS
- TABLE 132. MAZZETTA COMPANY, LLC.: PRODUCT PORTFOLIO
LIST OF FIGURES
- FIGURE 01. FROZEN SEAFOOD MARKET, 2022-2032
- FIGURE 02. SEGMENTATION OF FROZEN SEAFOOD MARKET,2022-2032
- FIGURE 03. TOP IMPACTING FACTORS IN FROZEN SEAFOOD MARKET (2022 TO 2032)
- FIGURE 04. TOP INVESTMENT POCKETS IN FROZEN SEAFOOD MARKET (2023-2032)
- FIGURE 05. MODERATE BARGAINING POWER OF SUPPLIERS
- FIGURE 06. MODERATE THREAT OF NEW ENTRANTS
- FIGURE 07. MODERATE THREAT OF SUBSTITUTES
- FIGURE 08. HIGH INTENSITY OF RIVALRY
- FIGURE 09. MODERATE BARGAINING POWER OF BUYERS
- FIGURE 10. GLOBAL FROZEN SEAFOOD MARKET:DRIVERS, RESTRAINTS AND OPPORTUNITIES
- FIGURE 11. FROZEN SEAFOOD MARKET, BY TYPE, 2022 AND 2032(%)
- FIGURE 12. COMPARATIVE SHARE ANALYSIS OF FROZEN SEAFOOD MARKET FOR FROZEN FISH, BY COUNTRY 2022 AND 2032(%)
- FIGURE 13. COMPARATIVE SHARE ANALYSIS OF FROZEN SEAFOOD MARKET FOR FROZEN CRUSTACEANS, BY COUNTRY 2022 AND 2032(%)
- FIGURE 14. COMPARATIVE SHARE ANALYSIS OF FROZEN SEAFOOD MARKET FOR FROZEN MOLLUSKS, BY COUNTRY 2022 AND 2032(%)
- FIGURE 15. COMPARATIVE SHARE ANALYSIS OF FROZEN SEAFOOD MARKET FOR OTHERS, BY COUNTRY 2022 AND 2032(%)
- FIGURE 16. FROZEN SEAFOOD MARKET, BY FORM, 2022 AND 2032(%)
- FIGURE 17. COMPARATIVE SHARE ANALYSIS OF FROZEN SEAFOOD MARKET FOR RAW FROZEN SEAFOOD, BY COUNTRY 2022 AND 2032(%)
- FIGURE 18. COMPARATIVE SHARE ANALYSIS OF FROZEN SEAFOOD MARKET FOR PRE-COOKED SEAFOOD, BY COUNTRY 2022 AND 2032(%)
- FIGURE 19. COMPARATIVE SHARE ANALYSIS OF FROZEN SEAFOOD MARKET FOR READY-TO-EAT SEAFOOD, BY COUNTRY 2022 AND 2032(%)
- FIGURE 20. FROZEN SEAFOOD MARKET, BY DISTRIBUTION CHANNEL, 2022 AND 2032(%)
- FIGURE 21. COMPARATIVE SHARE ANALYSIS OF FROZEN SEAFOOD MARKET FOR SUPERMARKETS-HYPERMARKETS, BY COUNTRY 2022 AND 2032(%)
- FIGURE 22. COMPARATIVE SHARE ANALYSIS OF FROZEN SEAFOOD MARKET FOR DEPARTMENTAL STORES, BY COUNTRY 2022 AND 2032(%)
- FIGURE 23. COMPARATIVE SHARE ANALYSIS OF FROZEN SEAFOOD MARKET FOR B2B, BY COUNTRY 2022 AND 2032(%)
- FIGURE 24. COMPARATIVE SHARE ANALYSIS OF FROZEN SEAFOOD MARKET FOR ONLINE SALES CHANNEL, BY COUNTRY 2022 AND 2032(%)
- FIGURE 25. FROZEN SEAFOOD MARKET BY REGION, 2022 AND 2032(%)
- FIGURE 26. U.S. FROZEN SEAFOOD MARKET, 2022-2032 ($MILLION)
- FIGURE 27. CANADA FROZEN SEAFOOD MARKET, 2022-2032 ($MILLION)
- FIGURE 28. MEXICO FROZEN SEAFOOD MARKET, 2022-2032 ($MILLION)
- FIGURE 29. GERMANY FROZEN SEAFOOD MARKET, 2022-2032 ($MILLION)
- FIGURE 30. ITALY FROZEN SEAFOOD MARKET, 2022-2032 ($MILLION)
- FIGURE 31. UK FROZEN SEAFOOD MARKET, 2022-2032 ($MILLION)
- FIGURE 32. FRANCE FROZEN SEAFOOD MARKET, 2022-2032 ($MILLION)
- FIGURE 33. SPAIN FROZEN SEAFOOD MARKET, 2022-2032 ($MILLION)
- FIGURE 34. REST OF EUROPE FROZEN SEAFOOD MARKET, 2022-2032 ($MILLION)
- FIGURE 35. CHINA FROZEN SEAFOOD MARKET, 2022-2032 ($MILLION)
- FIGURE 36. INDIA FROZEN SEAFOOD MARKET, 2022-2032 ($MILLION)
- FIGURE 37. JAPAN FROZEN SEAFOOD MARKET, 2022-2032 ($MILLION)
- FIGURE 38. AUSTRALIA FROZEN SEAFOOD MARKET, 2022-2032 ($MILLION)
- FIGURE 39. SOUTH KOREA FROZEN SEAFOOD MARKET, 2022-2032 ($MILLION)
- FIGURE 40. REST OF ASIA-PACIFIC FROZEN SEAFOOD MARKET, 2022-2032 ($MILLION)
- FIGURE 41. BRAZIL FROZEN SEAFOOD MARKET, 2022-2032 ($MILLION)
- FIGURE 42. SOUTH AFRICA FROZEN SEAFOOD MARKET, 2022-2032 ($MILLION)
- FIGURE 43. ARGENTINA FROZEN SEAFOOD MARKET, 2022-2032 ($MILLION)
- FIGURE 44. REST OF LAMEA FROZEN SEAFOOD MARKET, 2022-2032 ($MILLION)
- FIGURE 45. TOP WINNING STRATEGIES, BY YEAR (2022-2023)
- FIGURE 46. TOP WINNING STRATEGIES, BY DEVELOPMENT (2022-2023)
- FIGURE 47. TOP WINNING STRATEGIES, BY COMPANY (2022-2023)
- FIGURE 48. PRODUCT MAPPING OF TOP 10 PLAYERS
- FIGURE 49. COMPETITIVE DASHBOARD
- FIGURE 50. COMPETITIVE HEATMAP: FROZEN SEAFOOD MARKET
- FIGURE 51. TOP PLAYER POSITIONING, 2022
- FIGURE 52. HIGH LINER FOODS INCORPORATED: NET SALES, 2020-2022 ($MILLION)
- FIGURE 53. LEROY SEAFOOD GROUP ASA: NET REVENUE, 2020-2022 ($MILLION)
- FIGURE 54. LEROY SEAFOOD GROUP ASA: REVENUE SHARE BY SEGMENT, 2022 (%)
- FIGURE 55. LEROY SEAFOOD GROUP ASA: REVENUE SHARE BY REGION, 2022 (%)
- FIGURE 56. MARUHA NICHIRO CORPORATION: NET SALES, 2020-2022 ($MILLION)
- FIGURE 57. MARUHA NICHIRO CORPORATION: REVENUE SHARE BY SEGMENT, 2022 (%)
- FIGURE 58. THAI UNION GROUP PUBLIC COMPANY LIMITED.: NET SALES, 2020-2022 ($MILLION)
- FIGURE 59. THAI UNION GROUP PUBLIC COMPANY LIMITED.: RESEARCH & DEVELOPMENT EXPENDITURE, 2020-2022 ($MILLION)
- FIGURE 60. THAI UNION GROUP PUBLIC COMPANY LIMITED.: REVENUE SHARE BY SEGMENT, 2022 (%)
- FIGURE 61. THAI UNION GROUP PUBLIC COMPANY LIMITED.: REVENUE SHARE BY REGION, 2022 (%)
