


 |
市場調查報告書
商品編碼
1414750
汽車OEM遠端資訊處理市場:按產品、應用、車輛類型分類:2023-2032 年全球機會分析與產業預測Automotive OEM Telematics Market By Offering, By Application, By Vehicle Type : Global Opportunity Analysis and Industry Forecast, 2023-2032 |
||||||
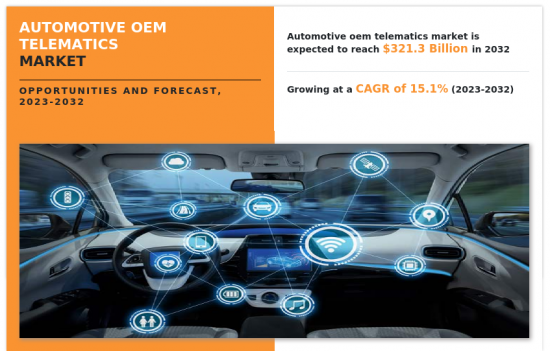
由於即時車隊監控系統整合到車輛中以及連接解決方案的不斷成長趨勢,預計從 2023 年到 2032 年,汽車OEM遠端資訊處理市場將顯著成長 15.1%。
汽車OEM遠端資訊處理市場的成長受到多種因素的推動,例如將即時車隊監控系統整合到車輛中、車輛診斷的輕鬆整合以及連接解決方案的成長。此外,智慧型交通系統、駕駛因素安全性的提升、車輛安全性的提升都是市場拓展的巨大機會。
這種類型的車隊管理使用人工智慧、物聯網和巨量資料來收集關鍵資料。此外,Techwave Consulting 使用可安裝在車輛上的感測器來追蹤高價商品。這些感測器連接到雲端並即時傳輸資料。除了追蹤車輛和駕駛員之外,智慧車隊管理領域還需要完成其他重要活動。這些活動包括資產管理、雙向通訊、駕駛員安全管理、時間管理和交付任務的重新安排。以下介紹新產品以及智慧車隊管理的優勢。
1 汽車目標商標產品製造商 (OEM) 使用的智慧型車隊管理服務可協助供應商提高效率和生產力,包括更快的回應時間、更廣泛的覆蓋範圍和更低的成本,因此需求不斷增加。
智慧型手機徹底改變了連接的概念。人們期望汽車能夠做與電腦和智慧型手機相同的事情。因此,為車輛添加連網解決方案已成為汽車製造商的首要任務。大多數連接解決方案都內建在現代車輛中,並且需要網路服務才能發揮作用。連接解決方案可以透過嵌入式、整合和繫留解決方案安裝在車輛中。汽車產業正處於數位革命之中。在不久的將來,汽車有望徹底轉變為通訊對象。由於客戶需要在移動時保持聯繫,因此預計這將推動汽車 OBD 市場的成長。
目錄
第1章簡介
第 2 章執行摘要
第3章市場概況
- 市場定義和範圍
- 主要發現
- 影響因素
- 主要投資機會
- 波特五力分析
- 市場動態
- 促進因素
- 將即時車隊監控系統整合到車輛中
- 輕鬆整合車輛診斷
- 連接解決方案的成長趨勢
- 抑制因素
- 安裝成本高
- 缺乏不間斷、無縫的網路連接
- 機會
- 智慧型交通系統
- 促進因素和提高車輛安全性
- 促進因素
第 4 章 汽車OEM遠端資訊處理市場:依產品分類
- 概述
- 硬體
- 軟體和服務
第5章汽車OEM遠端資訊處理市場:依應用分類
- 概述
- 資訊娛樂和導航
- 車隊的管理
- 安全保障
- 診斷
第6章汽車OEM遠端資訊處理市場:依車型分類
- 概述
- 小客車
- 商用車
第7章 汽車OEM遠端資訊處理市場:按地區
- 概述
- 北美洲
- 美國
- 加拿大
- 墨西哥
- 歐洲
- 德國
- 英國
- 法國
- 義大利
- 其他
- 亞太地區
- 中國
- 日本
- 印度
- 韓國
- 其他
- 拉丁美洲
- 拉丁美洲
- 中東
- 非洲
第8章 競爭形勢
- 介紹
- 關鍵成功策略
- 10家主要企業產品圖譜
- 競爭對手儀表板
- 競爭熱圖
- 2022年主要企業定位
第9章 公司簡介
- Continental AG
- Maruti Suzuki India Limited
- Verizon
- BMW AG
- TOYOTA MOTOR CORPORATION
- Renault Group
- Mercedes-Benz Group AG
- Ford Motor Company
- Nissan Motor Co. Ltd.
- General Motors
The automotive OEM telematics market is expected to experience a significant growth rate of 15.1% from 2023-2032 due to integration of real-time fleet monitoring systems in vehicles coupled with rise in trend of connectivity solutions - Allied Market Research
The automotive OEM telematics market growth is driven by several factors, including the integration of real-time fleet monitoring systems into vehicles, the ease of integrating vehicle diagnostics, and the growth of connectivity solutions. In addition, intelligent transport system, better driver, and vehicle safety present significant opportunities for market expansion.
For this type of fleet management, AI, IoT and big data are used to gather the primary data. Additionally, techwave Consulting Inc. is using sensors which can be installed in vehicles to track high-value items. These sensors connect with the cloud and send the data real-time. In addition to vehicle and driver tracking, there are other important activities that need to be done in the field of smart fleet management. These activities include asset management, 2-way communication and driver safety and time management as well as rescheduling a delivery task. The introduction of new products and the benefits of smart fleet management such as
1) rapid response, wide area coverage and cost reduction help vendors to become more efficient and productive, which in turn increases the demand for intelligent fleet management services that are used for automotive original equipment manufacturers (OEMs).
Smartphones have revolutionized the concept of connectivity. People expect their vehicles to do the same things as computers and smartphones. This has made adding connectivity solutions to cars a top priority for car manufacturers. Most connectivity solutions are built into modern cars and need internet service to function. Connectivity solutions can be installed in a car through embedded, integrated or tethered solutions. The auto industry is in the midst of a digital revolution. Cars are expected to completely transform into communication objects in the near future. This is expected to fuel the growth of the automotive OBD market as customers demand to stay connected even while on the go.
The automotive OEM telematics market is segmented into offering, vehicle type, application, and region. On the basis of offering, the market is segmented classified into hardware, software, and services. On the basis of vehicle type, it is categorized into passenger vehicle and commercial vehicle. By application the market is divided into infotainment and & navigation, fleet management, safety and & security, and diagnostics. Region-wise, it is analyzed across North America, Europe, Asia-Pacific, and LAMEA.
Continental AG, Maruti Suzuki, Verizon, BMW AG, Toyota Motor Corporation, Renault Group, Mercedes-Benz Group, Ford Motor Company, Nissan Motor Co., Ltd., General Motors, among others are the major players operating in the market.
Key Benefits For Stakeholders
- This report provides a quantitative analysis of the market segments, current trends, estimations, and dynamics of the automotive oem telematics market analysis from 2022 to 2032 to identify the prevailing automotive oem telematics market opportunities.
- The market research is offered along with information related to key drivers, restraints, and opportunities.
- Porter's five forces analysis highlights the potency of buyers and suppliers to enable stakeholders make profit-oriented business decisions and strengthen their supplier-buyer network.
- In-depth analysis of the automotive oem telematics market segmentation assists to determine the prevailing market opportunities.
- Major countries in each region are mapped according to their revenue contribution to the global market.
- Market player positioning facilitates benchmarking and provides a clear understanding of the present position of the market players.
- The report includes the analysis of the regional as well as global automotive oem telematics market trends, key players, market segments, application areas, and market growth strategies.
Additional benefits you will get with this purchase are:
- Quarterly Update and* (only available with a corporate license, on listed price)
- 5 additional Company Profile of client Choice pre- or Post-purchase, as a free update.
- Free Upcoming Version on the Purchase of Five and Enterprise User License.
- 16 analyst hours of support* (post-purchase, if you find additional data requirements upon review of the report, you may receive support amounting to 16 analyst hours to solve questions, and post-sale queries)
- 15% Free Customization* (in case the scope or segment of the report does not match your requirements, 15% is equivalent to 3 working days of free work, applicable once)
- Free data Pack on the Five and Enterprise User License. (Excel version of the report)
- Free Updated report if the report is 6-12 months old or older.
- 24-hour priority response*
- Free Industry updates and white papers.
Possible Customization with this report (with additional cost and timeline, please talk to the sales executive to know more)
- Technology Trend Analysis
- Brands Share Analysis
- SWOT Analysis
Key Market Segments
By Offering
- Hardware
- Software and Services
By Application
- Infotainment and Navigation
- Fleet Management
- Safety and Security
- Diagnostics
By Vehicle Type
- Passenger Vehicles
- Commercial Vehicles
By Region
- North America
- U.S.
- Canada
- Mexico
- Europe
- Germany
- UK
- France
- Italy
- Rest Of The Europe
- Asia-Pacific
- China
- Japan
- India
- South Korea
- Rest of Asia-Pacific
- LAMEA
- Latin America
- Middle East
- Africa
Key Market Players:
- Maruti Suzuki India Limited
- Verizon
- TOYOTA MOTOR CORPORATION
- Mercedes-Benz Group AG
- Ford Motor Company
- Nissan Motor Co. Ltd.
- Continental AG
- BMW AG
- Renault Group
- General Motors
TABLE OF CONTENTS
CHAPTER 1: INTRODUCTION
- 1.1. Report description
- 1.2. Key market segments
- 1.3. Key benefits to the stakeholders
- 1.4. Research methodology
- 1.4.1. Primary research
- 1.4.2. Secondary research
- 1.4.3. Analyst tools and models
CHAPTER 2: EXECUTIVE SUMMARY
- 2.1. CXO Perspective
CHAPTER 3: MARKET OVERVIEW
- 3.1. Market definition and scope
- 3.2. Key findings
- 3.2.1. Top impacting factors
- 3.2.2. Top investment pockets
- 3.3. Porter's five forces analysis
- 3.3.1. Low bargaining power of suppliers
- 3.3.2. Low threat of new entrants
- 3.3.3. Low threat of substitutes
- 3.3.4. Low intensity of rivalry
- 3.3.5. Low bargaining power of buyers
- 3.4. Market dynamics
- 3.4.1. Drivers
- 3.4.1.1. Integration of real-time fleet monitoring systems in vehicles
- 3.4.1.2. Ease in integration of vehicle diagnosis
- 3.4.1.3. Rise in trend of connectivity solutions
- 3.4.2. Restraints
- 3.4.2.1. High installation cost
- 3.4.2.2. Lack of uninterrupted & seamless internet connectivity
- 3.4.3. Opportunities
- 3.4.3.1. Intelligent transportation system
- 3.4.3.2. Better driver and vehicle safety
- 3.4.1. Drivers
CHAPTER 4: AUTOMOTIVE OEM TELEMATICS MARKET, BY OFFERING
- 4.1. Overview
- 4.1.1. Market size and forecast
- 4.2. Hardware
- 4.2.1. Key market trends, growth factors and opportunities
- 4.2.2. Market size and forecast, by region
- 4.2.3. Market share analysis by country
- 4.3. Software and Services
- 4.3.1. Key market trends, growth factors and opportunities
- 4.3.2. Market size and forecast, by region
- 4.3.3. Market share analysis by country
CHAPTER 5: AUTOMOTIVE OEM TELEMATICS MARKET, BY APPLICATION
- 5.1. Overview
- 5.1.1. Market size and forecast
- 5.2. Infotainment and Navigation
- 5.2.1. Key market trends, growth factors and opportunities
- 5.2.2. Market size and forecast, by region
- 5.2.3. Market share analysis by country
- 5.3. Fleet Management
- 5.3.1. Key market trends, growth factors and opportunities
- 5.3.2. Market size and forecast, by region
- 5.3.3. Market share analysis by country
- 5.4. Safety and Security
- 5.4.1. Key market trends, growth factors and opportunities
- 5.4.2. Market size and forecast, by region
- 5.4.3. Market share analysis by country
- 5.5. Diagnostics
- 5.5.1. Key market trends, growth factors and opportunities
- 5.5.2. Market size and forecast, by region
- 5.5.3. Market share analysis by country
CHAPTER 6: AUTOMOTIVE OEM TELEMATICS MARKET, BY VEHICLE TYPE
- 6.1. Overview
- 6.1.1. Market size and forecast
- 6.2. Passenger Vehicles
- 6.2.1. Key market trends, growth factors and opportunities
- 6.2.2. Market size and forecast, by region
- 6.2.3. Market share analysis by country
- 6.3. Commercial Vehicles
- 6.3.1. Key market trends, growth factors and opportunities
- 6.3.2. Market size and forecast, by region
- 6.3.3. Market share analysis by country
CHAPTER 7: AUTOMOTIVE OEM TELEMATICS MARKET, BY REGION
- 7.1. Overview
- 7.1.1. Market size and forecast By Region
- 7.2. North America
- 7.2.1. Key market trends, growth factors and opportunities
- 7.2.2. Market size and forecast, by Offering
- 7.2.3. Market size and forecast, by Application
- 7.2.4. Market size and forecast, by Vehicle Type
- 7.2.5. Market size and forecast, by country
- 7.2.5.1. U.S.
- 7.2.5.1.1. Market size and forecast, by Offering
- 7.2.5.1.2. Market size and forecast, by Application
- 7.2.5.1.3. Market size and forecast, by Vehicle Type
- 7.2.5.2. Canada
- 7.2.5.2.1. Market size and forecast, by Offering
- 7.2.5.2.2. Market size and forecast, by Application
- 7.2.5.2.3. Market size and forecast, by Vehicle Type
- 7.2.5.3. Mexico
- 7.2.5.3.1. Market size and forecast, by Offering
- 7.2.5.3.2. Market size and forecast, by Application
- 7.2.5.3.3. Market size and forecast, by Vehicle Type
- 7.3. Europe
- 7.3.1. Key market trends, growth factors and opportunities
- 7.3.2. Market size and forecast, by Offering
- 7.3.3. Market size and forecast, by Application
- 7.3.4. Market size and forecast, by Vehicle Type
- 7.3.5. Market size and forecast, by country
- 7.3.5.1. Germany
- 7.3.5.1.1. Market size and forecast, by Offering
- 7.3.5.1.2. Market size and forecast, by Application
- 7.3.5.1.3. Market size and forecast, by Vehicle Type
- 7.3.5.2. UK
- 7.3.5.2.1. Market size and forecast, by Offering
- 7.3.5.2.2. Market size and forecast, by Application
- 7.3.5.2.3. Market size and forecast, by Vehicle Type
- 7.3.5.3. France
- 7.3.5.3.1. Market size and forecast, by Offering
- 7.3.5.3.2. Market size and forecast, by Application
- 7.3.5.3.3. Market size and forecast, by Vehicle Type
- 7.3.5.4. Italy
- 7.3.5.4.1. Market size and forecast, by Offering
- 7.3.5.4.2. Market size and forecast, by Application
- 7.3.5.4.3. Market size and forecast, by Vehicle Type
- 7.3.5.5. Rest Of The Europe
- 7.3.5.5.1. Market size and forecast, by Offering
- 7.3.5.5.2. Market size and forecast, by Application
- 7.3.5.5.3. Market size and forecast, by Vehicle Type
- 7.4. Asia-Pacific
- 7.4.1. Key market trends, growth factors and opportunities
- 7.4.2. Market size and forecast, by Offering
- 7.4.3. Market size and forecast, by Application
- 7.4.4. Market size and forecast, by Vehicle Type
- 7.4.5. Market size and forecast, by country
- 7.4.5.1. China
- 7.4.5.1.1. Market size and forecast, by Offering
- 7.4.5.1.2. Market size and forecast, by Application
- 7.4.5.1.3. Market size and forecast, by Vehicle Type
- 7.4.5.2. Japan
- 7.4.5.2.1. Market size and forecast, by Offering
- 7.4.5.2.2. Market size and forecast, by Application
- 7.4.5.2.3. Market size and forecast, by Vehicle Type
- 7.4.5.3. India
- 7.4.5.3.1. Market size and forecast, by Offering
- 7.4.5.3.2. Market size and forecast, by Application
- 7.4.5.3.3. Market size and forecast, by Vehicle Type
- 7.4.5.4. South Korea
- 7.4.5.4.1. Market size and forecast, by Offering
- 7.4.5.4.2. Market size and forecast, by Application
- 7.4.5.4.3. Market size and forecast, by Vehicle Type
- 7.4.5.5. Rest of Asia-Pacific
- 7.4.5.5.1. Market size and forecast, by Offering
- 7.4.5.5.2. Market size and forecast, by Application
- 7.4.5.5.3. Market size and forecast, by Vehicle Type
- 7.5. LAMEA
- 7.5.1. Key market trends, growth factors and opportunities
- 7.5.2. Market size and forecast, by Offering
- 7.5.3. Market size and forecast, by Application
- 7.5.4. Market size and forecast, by Vehicle Type
- 7.5.5. Market size and forecast, by country
- 7.5.5.1. Latin America
- 7.5.5.1.1. Market size and forecast, by Offering
- 7.5.5.1.2. Market size and forecast, by Application
- 7.5.5.1.3. Market size and forecast, by Vehicle Type
- 7.5.5.2. Middle East
- 7.5.5.2.1. Market size and forecast, by Offering
- 7.5.5.2.2. Market size and forecast, by Application
- 7.5.5.2.3. Market size and forecast, by Vehicle Type
- 7.5.5.3. Africa
- 7.5.5.3.1. Market size and forecast, by Offering
- 7.5.5.3.2. Market size and forecast, by Application
- 7.5.5.3.3. Market size and forecast, by Vehicle Type
CHAPTER 8: COMPETITIVE LANDSCAPE
- 8.1. Introduction
- 8.2. Top winning strategies
- 8.3. Product mapping of top 10 player
- 8.4. Competitive dashboard
- 8.5. Competitive heatmap
- 8.6. Top player positioning, 2022
CHAPTER 9: COMPANY PROFILES
- 9.1. Continental AG
- 9.1.1. Company overview
- 9.1.2. Key executives
- 9.1.3. Company snapshot
- 9.1.4. Operating business segments
- 9.1.5. Product portfolio
- 9.1.6. Business performance
- 9.2. Maruti Suzuki India Limited
- 9.2.1. Company overview
- 9.2.2. Key executives
- 9.2.3. Company snapshot
- 9.2.4. Operating business segments
- 9.2.5. Product portfolio
- 9.2.6. Business performance
- 9.3. Verizon
- 9.3.1. Company overview
- 9.3.2. Key executives
- 9.3.3. Company snapshot
- 9.3.4. Operating business segments
- 9.3.5. Product portfolio
- 9.3.6. Business performance
- 9.4. BMW AG
- 9.4.1. Company overview
- 9.4.2. Key executives
- 9.4.3. Company snapshot
- 9.4.4. Operating business segments
- 9.4.5. Product portfolio
- 9.4.6. Business performance
- 9.5. TOYOTA MOTOR CORPORATION
- 9.5.1. Company overview
- 9.5.2. Key executives
- 9.5.3. Company snapshot
- 9.5.4. Operating business segments
- 9.5.5. Product portfolio
- 9.5.6. Business performance
- 9.5.7. Key strategic moves and developments
- 9.6. Renault Group
- 9.6.1. Company overview
- 9.6.2. Key executives
- 9.6.3. Company snapshot
- 9.6.4. Operating business segments
- 9.6.5. Product portfolio
- 9.6.6. Business performance
- 9.7. Mercedes-Benz Group AG
- 9.7.1. Company overview
- 9.7.2. Key executives
- 9.7.3. Company snapshot
- 9.7.4. Operating business segments
- 9.7.5. Product portfolio
- 9.7.6. Business performance
- 9.8. Ford Motor Company
- 9.8.1. Company overview
- 9.8.2. Key executives
- 9.8.3. Company snapshot
- 9.8.4. Operating business segments
- 9.8.5. Product portfolio
- 9.8.6. Business performance
- 9.9. Nissan Motor Co. Ltd.
- 9.9.1. Company overview
- 9.9.2. Key executives
- 9.9.3. Company snapshot
- 9.9.4. Operating business segments
- 9.9.5. Product portfolio
- 9.9.6. Business performance
- 9.10. General Motors
- 9.10.1. Company overview
- 9.10.2. Key executives
- 9.10.3. Company snapshot
- 9.10.4. Operating business segments
- 9.10.5. Product portfolio
- 9.10.6. Business performance
LIST OF TABLES
- TABLE 01. GLOBAL AUTOMOTIVE OEM TELEMATICS MARKET, BY OFFERING, 2022-2032 ($MILLION)
- TABLE 02. AUTOMOTIVE OEM TELEMATICS MARKET FOR HARDWARE, BY REGION, 2022-2032 ($MILLION)
- TABLE 03. AUTOMOTIVE OEM TELEMATICS MARKET FOR SOFTWARE AND SERVICES, BY REGION, 2022-2032 ($MILLION)
- TABLE 04. GLOBAL AUTOMOTIVE OEM TELEMATICS MARKET, BY APPLICATION, 2022-2032 ($MILLION)
- TABLE 05. AUTOMOTIVE OEM TELEMATICS MARKET FOR INFOTAINMENT AND NAVIGATION, BY REGION, 2022-2032 ($MILLION)
- TABLE 06. AUTOMOTIVE OEM TELEMATICS MARKET FOR FLEET MANAGEMENT, BY REGION, 2022-2032 ($MILLION)
- TABLE 07. AUTOMOTIVE OEM TELEMATICS MARKET FOR SAFETY AND SECURITY, BY REGION, 2022-2032 ($MILLION)
- TABLE 08. AUTOMOTIVE OEM TELEMATICS MARKET FOR DIAGNOSTICS, BY REGION, 2022-2032 ($MILLION)
- TABLE 09. GLOBAL AUTOMOTIVE OEM TELEMATICS MARKET, BY VEHICLE TYPE, 2022-2032 ($MILLION)
- TABLE 10. AUTOMOTIVE OEM TELEMATICS MARKET FOR PASSENGER VEHICLES, BY REGION, 2022-2032 ($MILLION)
- TABLE 11. AUTOMOTIVE OEM TELEMATICS MARKET FOR COMMERCIAL VEHICLES, BY REGION, 2022-2032 ($MILLION)
- TABLE 12. AUTOMOTIVE OEM TELEMATICS MARKET, BY REGION, 2022-2032 ($MILLION)
- TABLE 13. NORTH AMERICA AUTOMOTIVE OEM TELEMATICS MARKET, BY OFFERING, 2022-2032 ($MILLION)
- TABLE 14. NORTH AMERICA AUTOMOTIVE OEM TELEMATICS MARKET, BY APPLICATION, 2022-2032 ($MILLION)
- TABLE 15. NORTH AMERICA AUTOMOTIVE OEM TELEMATICS MARKET, BY VEHICLE TYPE, 2022-2032 ($MILLION)
- TABLE 16. NORTH AMERICA AUTOMOTIVE OEM TELEMATICS MARKET, BY COUNTRY, 2022-2032 ($MILLION)
- TABLE 17. U.S. AUTOMOTIVE OEM TELEMATICS MARKET, BY OFFERING, 2022-2032 ($MILLION)
- TABLE 18. U.S. AUTOMOTIVE OEM TELEMATICS MARKET, BY APPLICATION, 2022-2032 ($MILLION)
- TABLE 19. U.S. AUTOMOTIVE OEM TELEMATICS MARKET, BY VEHICLE TYPE, 2022-2032 ($MILLION)
- TABLE 20. CANADA AUTOMOTIVE OEM TELEMATICS MARKET, BY OFFERING, 2022-2032 ($MILLION)
- TABLE 21. CANADA AUTOMOTIVE OEM TELEMATICS MARKET, BY APPLICATION, 2022-2032 ($MILLION)
- TABLE 22. CANADA AUTOMOTIVE OEM TELEMATICS MARKET, BY VEHICLE TYPE, 2022-2032 ($MILLION)
- TABLE 23. MEXICO AUTOMOTIVE OEM TELEMATICS MARKET, BY OFFERING, 2022-2032 ($MILLION)
- TABLE 24. MEXICO AUTOMOTIVE OEM TELEMATICS MARKET, BY APPLICATION, 2022-2032 ($MILLION)
- TABLE 25. MEXICO AUTOMOTIVE OEM TELEMATICS MARKET, BY VEHICLE TYPE, 2022-2032 ($MILLION)
- TABLE 26. EUROPE AUTOMOTIVE OEM TELEMATICS MARKET, BY OFFERING, 2022-2032 ($MILLION)
- TABLE 27. EUROPE AUTOMOTIVE OEM TELEMATICS MARKET, BY APPLICATION, 2022-2032 ($MILLION)
- TABLE 28. EUROPE AUTOMOTIVE OEM TELEMATICS MARKET, BY VEHICLE TYPE, 2022-2032 ($MILLION)
- TABLE 29. EUROPE AUTOMOTIVE OEM TELEMATICS MARKET, BY COUNTRY, 2022-2032 ($MILLION)
- TABLE 30. GERMANY AUTOMOTIVE OEM TELEMATICS MARKET, BY OFFERING, 2022-2032 ($MILLION)
- TABLE 31. GERMANY AUTOMOTIVE OEM TELEMATICS MARKET, BY APPLICATION, 2022-2032 ($MILLION)
- TABLE 32. GERMANY AUTOMOTIVE OEM TELEMATICS MARKET, BY VEHICLE TYPE, 2022-2032 ($MILLION)
- TABLE 33. UK AUTOMOTIVE OEM TELEMATICS MARKET, BY OFFERING, 2022-2032 ($MILLION)
- TABLE 34. UK AUTOMOTIVE OEM TELEMATICS MARKET, BY APPLICATION, 2022-2032 ($MILLION)
- TABLE 35. UK AUTOMOTIVE OEM TELEMATICS MARKET, BY VEHICLE TYPE, 2022-2032 ($MILLION)
- TABLE 36. FRANCE AUTOMOTIVE OEM TELEMATICS MARKET, BY OFFERING, 2022-2032 ($MILLION)
- TABLE 37. FRANCE AUTOMOTIVE OEM TELEMATICS MARKET, BY APPLICATION, 2022-2032 ($MILLION)
- TABLE 38. FRANCE AUTOMOTIVE OEM TELEMATICS MARKET, BY VEHICLE TYPE, 2022-2032 ($MILLION)
- TABLE 39. ITALY AUTOMOTIVE OEM TELEMATICS MARKET, BY OFFERING, 2022-2032 ($MILLION)
- TABLE 40. ITALY AUTOMOTIVE OEM TELEMATICS MARKET, BY APPLICATION, 2022-2032 ($MILLION)
- TABLE 41. ITALY AUTOMOTIVE OEM TELEMATICS MARKET, BY VEHICLE TYPE, 2022-2032 ($MILLION)
- TABLE 42. REST OF THE EUROPE AUTOMOTIVE OEM TELEMATICS MARKET, BY OFFERING, 2022-2032 ($MILLION)
- TABLE 43. REST OF THE EUROPE AUTOMOTIVE OEM TELEMATICS MARKET, BY APPLICATION, 2022-2032 ($MILLION)
- TABLE 44. REST OF THE EUROPE AUTOMOTIVE OEM TELEMATICS MARKET, BY VEHICLE TYPE, 2022-2032 ($MILLION)
- TABLE 45. ASIA-PACIFIC AUTOMOTIVE OEM TELEMATICS MARKET, BY OFFERING, 2022-2032 ($MILLION)
- TABLE 46. ASIA-PACIFIC AUTOMOTIVE OEM TELEMATICS MARKET, BY APPLICATION, 2022-2032 ($MILLION)
- TABLE 47. ASIA-PACIFIC AUTOMOTIVE OEM TELEMATICS MARKET, BY VEHICLE TYPE, 2022-2032 ($MILLION)
- TABLE 48. ASIA-PACIFIC AUTOMOTIVE OEM TELEMATICS MARKET, BY COUNTRY, 2022-2032 ($MILLION)
- TABLE 49. CHINA AUTOMOTIVE OEM TELEMATICS MARKET, BY OFFERING, 2022-2032 ($MILLION)
- TABLE 50. CHINA AUTOMOTIVE OEM TELEMATICS MARKET, BY APPLICATION, 2022-2032 ($MILLION)
- TABLE 51. CHINA AUTOMOTIVE OEM TELEMATICS MARKET, BY VEHICLE TYPE, 2022-2032 ($MILLION)
- TABLE 52. JAPAN AUTOMOTIVE OEM TELEMATICS MARKET, BY OFFERING, 2022-2032 ($MILLION)
- TABLE 53. JAPAN AUTOMOTIVE OEM TELEMATICS MARKET, BY APPLICATION, 2022-2032 ($MILLION)
- TABLE 54. JAPAN AUTOMOTIVE OEM TELEMATICS MARKET, BY VEHICLE TYPE, 2022-2032 ($MILLION)
- TABLE 55. INDIA AUTOMOTIVE OEM TELEMATICS MARKET, BY OFFERING, 2022-2032 ($MILLION)
- TABLE 56. INDIA AUTOMOTIVE OEM TELEMATICS MARKET, BY APPLICATION, 2022-2032 ($MILLION)
- TABLE 57. INDIA AUTOMOTIVE OEM TELEMATICS MARKET, BY VEHICLE TYPE, 2022-2032 ($MILLION)
- TABLE 58. SOUTH KOREA AUTOMOTIVE OEM TELEMATICS MARKET, BY OFFERING, 2022-2032 ($MILLION)
- TABLE 59. SOUTH KOREA AUTOMOTIVE OEM TELEMATICS MARKET, BY APPLICATION, 2022-2032 ($MILLION)
- TABLE 60. SOUTH KOREA AUTOMOTIVE OEM TELEMATICS MARKET, BY VEHICLE TYPE, 2022-2032 ($MILLION)
- TABLE 61. REST OF ASIA-PACIFIC AUTOMOTIVE OEM TELEMATICS MARKET, BY OFFERING, 2022-2032 ($MILLION)
- TABLE 62. REST OF ASIA-PACIFIC AUTOMOTIVE OEM TELEMATICS MARKET, BY APPLICATION, 2022-2032 ($MILLION)
- TABLE 63. REST OF ASIA-PACIFIC AUTOMOTIVE OEM TELEMATICS MARKET, BY VEHICLE TYPE, 2022-2032 ($MILLION)
- TABLE 64. LAMEA AUTOMOTIVE OEM TELEMATICS MARKET, BY OFFERING, 2022-2032 ($MILLION)
- TABLE 65. LAMEA AUTOMOTIVE OEM TELEMATICS MARKET, BY APPLICATION, 2022-2032 ($MILLION)
- TABLE 66. LAMEA AUTOMOTIVE OEM TELEMATICS MARKET, BY VEHICLE TYPE, 2022-2032 ($MILLION)
- TABLE 67. LAMEA AUTOMOTIVE OEM TELEMATICS MARKET, BY COUNTRY, 2022-2032 ($MILLION)
- TABLE 68. LATIN AMERICA AUTOMOTIVE OEM TELEMATICS MARKET, BY OFFERING, 2022-2032 ($MILLION)
- TABLE 69. LATIN AMERICA AUTOMOTIVE OEM TELEMATICS MARKET, BY APPLICATION, 2022-2032 ($MILLION)
- TABLE 70. LATIN AMERICA AUTOMOTIVE OEM TELEMATICS MARKET, BY VEHICLE TYPE, 2022-2032 ($MILLION)
- TABLE 71. MIDDLE EAST AUTOMOTIVE OEM TELEMATICS MARKET, BY OFFERING, 2022-2032 ($MILLION)
- TABLE 72. MIDDLE EAST AUTOMOTIVE OEM TELEMATICS MARKET, BY APPLICATION, 2022-2032 ($MILLION)
- TABLE 73. MIDDLE EAST AUTOMOTIVE OEM TELEMATICS MARKET, BY VEHICLE TYPE, 2022-2032 ($MILLION)
- TABLE 74. AFRICA AUTOMOTIVE OEM TELEMATICS MARKET, BY OFFERING, 2022-2032 ($MILLION)
- TABLE 75. AFRICA AUTOMOTIVE OEM TELEMATICS MARKET, BY APPLICATION, 2022-2032 ($MILLION)
- TABLE 76. AFRICA AUTOMOTIVE OEM TELEMATICS MARKET, BY VEHICLE TYPE, 2022-2032 ($MILLION)
- TABLE 77. CONTINENTAL AG: KEY EXECUTIVES
- TABLE 78. CONTINENTAL AG: COMPANY SNAPSHOT
- TABLE 79. CONTINENTAL AG: PRODUCT SEGMENTS
- TABLE 80. CONTINENTAL AG: PRODUCT PORTFOLIO
- TABLE 81. MARUTI SUZUKI INDIA LIMITED: KEY EXECUTIVES
- TABLE 82. MARUTI SUZUKI INDIA LIMITED: COMPANY SNAPSHOT
- TABLE 83. MARUTI SUZUKI INDIA LIMITED: PRODUCT SEGMENTS
- TABLE 84. MARUTI SUZUKI INDIA LIMITED: PRODUCT PORTFOLIO
- TABLE 85. VERIZON: KEY EXECUTIVES
- TABLE 86. VERIZON: COMPANY SNAPSHOT
- TABLE 87. VERIZON: SERVICE SEGMENTS
- TABLE 88. VERIZON: PRODUCT PORTFOLIO
- TABLE 89. BMW AG: KEY EXECUTIVES
- TABLE 90. BMW AG: COMPANY SNAPSHOT
- TABLE 91. BMW AG: PRODUCT SEGMENTS
- TABLE 92. BMW AG: PRODUCT PORTFOLIO
- TABLE 93. TOYOTA MOTOR CORPORATION: KEY EXECUTIVES
- TABLE 94. TOYOTA MOTOR CORPORATION: COMPANY SNAPSHOT
- TABLE 95. TOYOTA MOTOR CORPORATION: PRODUCT SEGMENTS
- TABLE 96. TOYOTA MOTOR CORPORATION: PRODUCT PORTFOLIO
- TABLE 97. TOYOTA MOTOR CORPORATION: KEY STRATERGIES
- TABLE 98. RENAULT GROUP: KEY EXECUTIVES
- TABLE 99. RENAULT GROUP: COMPANY SNAPSHOT
- TABLE 100. RENAULT GROUP: PRODUCT SEGMENTS
- TABLE 101. RENAULT GROUP: PRODUCT PORTFOLIO
- TABLE 102. MERCEDES-BENZ GROUP AG: KEY EXECUTIVES
- TABLE 103. MERCEDES-BENZ GROUP AG: COMPANY SNAPSHOT
- TABLE 104. MERCEDES-BENZ GROUP AG: PRODUCT SEGMENTS
- TABLE 105. MERCEDES-BENZ GROUP AG: SERVICE SEGMENTS
- TABLE 106. MERCEDES-BENZ GROUP AG: PRODUCT PORTFOLIO
- TABLE 107. FORD MOTOR COMPANY: KEY EXECUTIVES
- TABLE 108. FORD MOTOR COMPANY: COMPANY SNAPSHOT
- TABLE 109. FORD MOTOR COMPANY: PRODUCT SEGMENTS
- TABLE 110. FORD MOTOR COMPANY: PRODUCT PORTFOLIO
- TABLE 111. NISSAN MOTOR CO. LTD.: KEY EXECUTIVES
- TABLE 112. NISSAN MOTOR CO. LTD.: COMPANY SNAPSHOT
- TABLE 113. NISSAN MOTOR CO. LTD.: PRODUCT SEGMENTS
- TABLE 114. NISSAN MOTOR CO. LTD.: PRODUCT PORTFOLIO
- TABLE 115. GENERAL MOTORS: KEY EXECUTIVES
- TABLE 116. GENERAL MOTORS: COMPANY SNAPSHOT
- TABLE 117. GENERAL MOTORS: PRODUCT SEGMENTS
- TABLE 118. GENERAL MOTORS: PRODUCT PORTFOLIO
LIST OF FIGURES
- FIGURE 01. AUTOMOTIVE OEM TELEMATICS MARKET, 2022-2032
- FIGURE 02. SEGMENTATION OF AUTOMOTIVE OEM TELEMATICS MARKET,2022-2032
- FIGURE 03. TOP IMPACTING FACTORS IN AUTOMOTIVE OEM TELEMATICS MARKET (2022 TO 2032)
- FIGURE 04. TOP INVESTMENT POCKETS IN AUTOMOTIVE OEM TELEMATICS MARKET (2023-2032)
- FIGURE 05. LOW BARGAINING POWER OF SUPPLIERS
- FIGURE 06. LOW THREAT OF NEW ENTRANTS
- FIGURE 07. LOW THREAT OF SUBSTITUTES
- FIGURE 08. LOW INTENSITY OF RIVALRY
- FIGURE 09. LOW BARGAINING POWER OF BUYERS
- FIGURE 10. GLOBAL AUTOMOTIVE OEM TELEMATICS MARKET:DRIVERS, RESTRAINTS AND OPPORTUNITIES
- FIGURE 11. AUTOMOTIVE OEM TELEMATICS MARKET, BY OFFERING, 2022 AND 2032(%)
- FIGURE 12. COMPARATIVE SHARE ANALYSIS OF AUTOMOTIVE OEM TELEMATICS MARKET FOR HARDWARE, BY COUNTRY 2022 AND 2032(%)
- FIGURE 13. COMPARATIVE SHARE ANALYSIS OF AUTOMOTIVE OEM TELEMATICS MARKET FOR SOFTWARE AND SERVICES, BY COUNTRY 2022 AND 2032(%)
- FIGURE 14. AUTOMOTIVE OEM TELEMATICS MARKET, BY APPLICATION, 2022 AND 2032(%)
- FIGURE 15. COMPARATIVE SHARE ANALYSIS OF AUTOMOTIVE OEM TELEMATICS MARKET FOR INFOTAINMENT AND NAVIGATION, BY COUNTRY 2022 AND 2032(%)
- FIGURE 16. COMPARATIVE SHARE ANALYSIS OF AUTOMOTIVE OEM TELEMATICS MARKET FOR FLEET MANAGEMENT, BY COUNTRY 2022 AND 2032(%)
- FIGURE 17. COMPARATIVE SHARE ANALYSIS OF AUTOMOTIVE OEM TELEMATICS MARKET FOR SAFETY AND SECURITY, BY COUNTRY 2022 AND 2032(%)
- FIGURE 18. COMPARATIVE SHARE ANALYSIS OF AUTOMOTIVE OEM TELEMATICS MARKET FOR DIAGNOSTICS, BY COUNTRY 2022 AND 2032(%)
- FIGURE 19. AUTOMOTIVE OEM TELEMATICS MARKET, BY VEHICLE TYPE, 2022 AND 2032(%)
- FIGURE 20. COMPARATIVE SHARE ANALYSIS OF AUTOMOTIVE OEM TELEMATICS MARKET FOR PASSENGER VEHICLES, BY COUNTRY 2022 AND 2032(%)
- FIGURE 21. COMPARATIVE SHARE ANALYSIS OF AUTOMOTIVE OEM TELEMATICS MARKET FOR COMMERCIAL VEHICLES, BY COUNTRY 2022 AND 2032(%)
- FIGURE 22. AUTOMOTIVE OEM TELEMATICS MARKET BY REGION, 2022 AND 2032(%)
- FIGURE 23. U.S. AUTOMOTIVE OEM TELEMATICS MARKET, 2022-2032 ($MILLION)
- FIGURE 24. CANADA AUTOMOTIVE OEM TELEMATICS MARKET, 2022-2032 ($MILLION)
- FIGURE 25. MEXICO AUTOMOTIVE OEM TELEMATICS MARKET, 2022-2032 ($MILLION)
- FIGURE 26. GERMANY AUTOMOTIVE OEM TELEMATICS MARKET, 2022-2032 ($MILLION)
- FIGURE 27. UK AUTOMOTIVE OEM TELEMATICS MARKET, 2022-2032 ($MILLION)
- FIGURE 28. FRANCE AUTOMOTIVE OEM TELEMATICS MARKET, 2022-2032 ($MILLION)
- FIGURE 29. ITALY AUTOMOTIVE OEM TELEMATICS MARKET, 2022-2032 ($MILLION)
- FIGURE 30. REST OF THE EUROPE AUTOMOTIVE OEM TELEMATICS MARKET, 2022-2032 ($MILLION)
- FIGURE 31. CHINA AUTOMOTIVE OEM TELEMATICS MARKET, 2022-2032 ($MILLION)
- FIGURE 32. JAPAN AUTOMOTIVE OEM TELEMATICS MARKET, 2022-2032 ($MILLION)
- FIGURE 33. INDIA AUTOMOTIVE OEM TELEMATICS MARKET, 2022-2032 ($MILLION)
- FIGURE 34. SOUTH KOREA AUTOMOTIVE OEM TELEMATICS MARKET, 2022-2032 ($MILLION)
- FIGURE 35. REST OF ASIA-PACIFIC AUTOMOTIVE OEM TELEMATICS MARKET, 2022-2032 ($MILLION)
- FIGURE 36. LATIN AMERICA AUTOMOTIVE OEM TELEMATICS MARKET, 2022-2032 ($MILLION)
- FIGURE 37. MIDDLE EAST AUTOMOTIVE OEM TELEMATICS MARKET, 2022-2032 ($MILLION)
- FIGURE 38. AFRICA AUTOMOTIVE OEM TELEMATICS MARKET, 2022-2032 ($MILLION)
- FIGURE 39. TOP WINNING STRATEGIES, BY YEAR (2023)
- FIGURE 40. TOP WINNING STRATEGIES, BY DEVELOPMENT (2023)
- FIGURE 41. TOP WINNING STRATEGIES, BY COMPANY (2023)
- FIGURE 42. PRODUCT MAPPING OF TOP 10 PLAYERS
- FIGURE 43. COMPETITIVE DASHBOARD
- FIGURE 44. COMPETITIVE HEATMAP: AUTOMOTIVE OEM TELEMATICS MARKET
- FIGURE 45. TOP PLAYER POSITIONING, 2022
- FIGURE 46. CONTINENTAL AG: NET SALES, 2020-2022 ($MILLION)
- FIGURE 47. CONTINENTAL AG: RESEARCH & DEVELOPMENT EXPENDITURE, 2020-2022 ($MILLION)
- FIGURE 48. CONTINENTAL AG: REVENUE SHARE BY SEGMENT, 2022 (%)
- FIGURE 49. CONTINENTAL AG: REVENUE SHARE BY REGION, 2022 (%)
- FIGURE 50. VERIZON: NET REVENUE, 2020-2022 ($MILLION)
- FIGURE 51. VERIZON: REVENUE SHARE BY SEGMENT, 2022 (%)
- FIGURE 52. BMW AG: NET SALES, 2020-2022 ($MILLION)
- FIGURE 53. BMW AG: RESEARCH & DEVELOPMENT EXPENDITURE, 2020-2022 ($MILLION)
- FIGURE 54. BMW AG: REVENUE SHARE BY SEGMENT, 2022 (%)
- FIGURE 55. BMW AG: REVENUE SHARE BY REGION, 2022 (%)
- FIGURE 56. TOYOTA MOTOR CORPORATION: RESEARCH & DEVELOPMENT EXPENDITURE, 2020-2022 ($MILLION)
- FIGURE 57. TOYOTA MOTOR CORPORATION: NET SALES, 2020-2022 ($MILLION)
- FIGURE 58. TOYOTA MOTOR CORPORATION: REVENUE SHARE BY SEGMENT, 2022 (%)
- FIGURE 59. TOYOTA MOTOR CORPORATION: REVENUE SHARE BY REGION, 2022 (%)
- FIGURE 60. RENAULT GROUP: NET SALES, 2020-2022 ($MILLION)
- FIGURE 61. RENAULT GROUP: REVENUE SHARE BY SEGMENT, 2022 (%)
- FIGURE 62. RENAULT GROUP: REVENUE SHARE BY REGION, 2022 (%)
- FIGURE 63. MERCEDES-BENZ GROUP AG: RESEARCH & DEVELOPMENT EXPENDITURE, 2020-2022
- FIGURE 64. MERCEDES-BENZ GROUP AG: NET SALES, 2020-2022 ($MILLION)
- FIGURE 65. MERCEDES-BENZ GROUP AG: REVENUE SHARE BY SEGMENT, 2022 (%)
- FIGURE 66. MERCEDES-BENZ GROUP AG: REVENUE SHARE BY REGION, 2022 (%)
- FIGURE 67. FORD MOTOR COMPANY: NET SALES, 2020-2022 ($MILLION)
- FIGURE 68. FORD MOTOR COMPANY: RESEARCH & DEVELOPMENT EXPENDITURE, 2020-2022 ($MILLION)
- FIGURE 69. FORD MOTOR COMPANY: REVENUE SHARE BY REGION, 2022 (%)
- FIGURE 70. FORD MOTOR COMPANY: REVENUE SHARE BY SEGMENT, 2022 (%)
- FIGURE 71. GENERAL MOTORS: RESEARCH & DEVELOPMENT EXPENDITURE, 2020-2022 ($MILLION)
- FIGURE 72. GENERAL MOTORS: NET SALES, 2020-2022 ($MILLION)
- FIGURE 73. GENERAL MOTORS: REVENUE SHARE BY SEGMENT, 2022 (%)
- FIGURE 74. GENERAL MOTORS: REVENUE SHARE BY REGION, 2022 (%)
 車用通訊系統市場:按技術、服務、車輛、應用和最終用戶分類 - 2024-2030 年全球預測
 全球車用通訊系統市場:市場規模、佔有率、成長分析 - 按技術、銷售管道、產業預測(2024-2031)
 乘用車T-Box全球市場、中國市場(2024年)
 內燃機和電動車用通訊系統的全球市場:按服務(電子呼叫、公路式援助、保險風險評估、遠距離診斷)、型態(嵌入式、整合)、連接性、售後市場、地區- 預測(截至2030 年)
 2024 年汽車遠端資訊處理全球市場報告
 遠端資訊處理:市場佔有率分析、產業趨勢與統計、成長預測(2024-2029)
 2024 年小客車遠端資訊處理全球市場報告
 車隊遠端資訊處理系統的全球市場 2024-2028
 售後汽車遠端資訊處理市場:按提供的服務、應用、車輛類型分類 - 2024-2030 年全球預測
 遠端資訊處理控制單元 -市場佔有率分析、產業趨勢/統計、2024-2029 年成長預測