


 |
市場調查報告書
商品編碼
1414729
醫療雷射市場:按產品類型、應用和最終用戶分類:2023-2032 年全球機會分析和產業預測Medical Laser Market By Product Type, By Application, By End User : Global Opportunity Analysis and Industry Forecast, 2023-2032 |
||||||
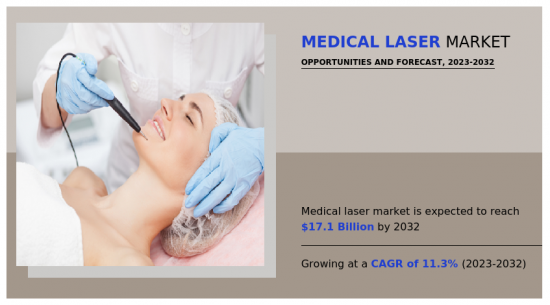
2022年醫療雷射市值為58億美元,預計2023年至2032年複合年成長率為11.3%,到2032年達到171億美元。
醫用雷射是產生強大的同調光束的專用設備,可用於各種醫療應用。這些雷射器旨在向人體內的組織提供精確且受控的能量,使其成為現代醫療保健中的寶貴工具。雷射通常用於外科手術,例如:
1 用於矯正視力的眼科手術(LASIK等),其中使用雷射改變角膜的形狀。
全球醫用雷射市場的成長主要是由於眼科疾病的日益流行以及醫療保健專業人員對醫用雷射的廣泛採用所推動的。醫用雷射提供精確性並減少創傷,使其成為各種手術應用的首選,包括:
1 眼科、皮膚科、美容外科。
眼科疾病盛行率的上升已成為醫用雷射市場成長的關鍵驅動力。眼科疾病包括影響眼睛的多種疾病,近年來越來越常見,主要原因如下:
1 人口老化、生活方式改變以及疾病發生率迅速增加,例如:
1 近視、青光眼、糖尿病視網膜病變和老齡化黃斑部病變等疾病的發生率迅速增加。例如,根據沙烏地阿拉伯衛生署2023年報告,全球疑似青光眼病例總數估計超過6,000萬例。例如,世界上最大的生物醫學圖書館和計算健康資訊學研究的領導者國家醫學圖書館報告稱,老齡化黃斑部病變佔全球失明的 8.7%。這些疾病通常需要精確的微創治療方案,而醫用雷射非常適合提供這種治療方案。 LumiBird Medical 是眼科醫療雷射的領先製造商,提供 Ellex Solo,提供快速、精確的青光眼雷射治療。因此,眼科疾病盛行率的增加預計將推動市場成長。
此外,醫療保健專業人員快速且廣泛地採用醫用雷射已成為醫用雷射市場大幅成長的關鍵驅動力。醫用雷射為醫療專業人員提供了適用於各種醫療程序的高精度、微創工具。這種精確度對於精細的手術和治療尤其重要,例如:
1 精確度至關重要的手術和治療,例如眼科、皮膚科和各種整容手術。針對特定組織和細胞同時最大限度地減少對周圍健康組織的損害的能力不僅可以改善患者的治療效果,還可以縮短恢復時間並減少術後併發症。此外,醫用雷射的多功能性擴大了其在各種醫療領域的效用,使從業者能夠解決越來越多的醫療狀況。醫用雷射目前用於切除腫瘤、治療血管問題、使皮膚恢復活力等。雷射已被證明有效,使其在醫療保健專業人員中廣受歡迎。例如,美國衛生與食品藥物管理局服務部下屬聯邦機構美國食品和藥物管理局 2023 年的一份報告發現,正確使用雷射可以幫助外科醫生完成更複雜的任務、減少出血並減少術後不適。據報道,它可以降低傷口感染的風險,減少傷口感染的機會,達到更好的創傷治療。總之,醫療保健專業人員對醫用雷射的廣泛採用預計將推動市場成長。
然而,醫用雷射的高成本可能會限制市場成長。此外,雷射在臨床領域的廣泛應用預計將為市場提供重大成長機會。
目錄
第1章簡介
第 2 章執行摘要
第3章市場概況
- 市場定義和範圍
- 主要發現
- 影響因素
- 主要投資機會
- 波特五力分析
- 市場動態
- 促進因素
- 醫療保健專業人員對醫用雷射的採用率很高
- 醫療雷射技術的技術進步
- 慢性病快速增加
- 抑制因素
- 醫用雷射高成本
- 機會
- 擴大雷射在臨床領域的應用
- 促進因素
第4章醫療雷射市場:依產品類型
- 概述
- 固體雷射系統
- 氣體雷射系統
- 染料雷射系統
- 二極體雷射系統
第5章醫療雷射市場:依應用分類
- 概述
- 眼科雷射
- 手術雷射
- 美容/皮膚科雷射
- 其他
第6章 醫療雷射市場:依最終用戶分類
- 概述
- 醫院
- 皮膚科和美容診所
- 眼科診所
- 其他
第7章 醫療雷射市場:依地區
- 概述
- 北美洲
- 美國
- 加拿大
- 墨西哥
- 歐洲
- 德國
- 法國
- 英國
- 義大利
- 西班牙
- 其他
- 亞太地區
- 中國
- 日本
- 印度
- 澳洲
- 韓國
- 其他
- 拉丁美洲/中東/非洲
- 巴西
- 沙烏地阿拉伯
- 南非
- 其他
第8章 競爭形勢
- 介紹
- 關鍵成功策略
- 10家主要企業產品圖譜
- 競爭對手儀表板
- 競爭熱圖
- 2022年主要企業定位
第9章 公司簡介
- Bausch Health Companies, Inc.
- Biolase Inc
- Boston Scientific Corporation
- Iridex corporation.
- Koninklijke Philips NV
- Novartis AG
- Artivion, Inc.
- Lumibird Medical
- Candela Corporation.
- Cynosure Inc
According to a new report published by Allied Market Research, titled, "Medical Laser Market," The medical laser market was valued at $5.8 billion in 2022, and is estimated to reach $17.1 billion by 2032, growing at a CAGR of 11.3% from 2023 to 2032.
Medical laser is a specialized device that generates intense beams of coherent light, harnessed for various medical applications. These lasers are designed to deliver precise and controlled energy to tissues within the human body, making them invaluable tools in modern healthcare. They are commonly used in surgical procedures, such as
1) eye surgeries to correct vision issues (e.g., LASIK), where the laser reshapes the cornea.
The growth of global medical laser market is majorly driven by increase in prevalence of ophthalmic diseases and high adoption of the medical lasers by healthcare professionals. Medical lasers offer precision and reduced trauma, making them a preferred choice for various surgical applications, such as
1) ophthalmology, dermatology, and aesthetic procedures.
The rise in the prevalence of ophthalmic disorders has emerged as a significant driver for the growth of the medical laser market. Ophthalmic disorders, including a wide range of conditions affecting the eyes, have become increasingly common in recent years, primarily due to factors such as
1) an aging population, changing lifestyles, and the surge in incidence of conditions such as
1) myopia, glaucoma, diabetic retinopathy, and age-related macular degeneration. For instance, according to 2023 report by Ministry of Health, Saudi Arabia, it was estimated that total number of suspected cases of glaucoma is over 60 million worldwide. For instance, according to National Library of Medicine, the world's largest biomedical library and a leader in research in computational health informatics, it was reported that age-related macular degeneration accounts for 8.7% of all types of blindness worldwide. These disorders often necessitate precise and minimally invasive treatment options, which medical lasers are well-suited to provide. Lumibird Medical, a leading medical laser manufacturer for ophthalmic applications, provides Ellex Solo to perform quick and highly accurate glaucoma laser treatments. Thus, the rise in prevalence of ophthalmic disorders is expected to drive the growth of the market.
Furthermore, the rapid and widespread adoption of medical lasers by healthcare professionals has emerged as a significant driving force behind the remarkable growth of the medical laser market. Medical lasers offer healthcare professionals a highly precise and minimally invasive tool for a wide range of medical procedures. This precision is particularly crucial in delicate surgeries and treatments, such as
1) ophthalmology, dermatology, and various cosmetic procedures, where accuracy is paramount. The ability to target specific tissues or cells with minimal damage to surrounding healthy tissue has not only improved patient outcomes but has also shortened recovery times and reduced post-operative complications. Moreover, the versatility of medical lasers has expanded their utility across various medical disciplines, allowing practitioners to address an ever-increasing number of medical conditions. Medical laser is now used in the removal of tumors, the treatment of vascular issues, or the rejuvenation of skin. Lasers have proven their efficacy, contributing to their popularity among healthcare professionals. For instance, according to 2023 report by U.S. Food and Drug Administration, a federal agency of the Department of Health and Human Services, it was reported that with proper use, lasers allow the surgeon to accomplish more complex tasks, reduce blood loss, decrease postoperative discomfort, reduce the chance of wound infection, and achieve better wound healing. In conclusion, the high adoption of medical lasers by healthcare professionals is expected to drive the growth of the market.
However, high cost of medical lasers might restrain the growth of the market. Moreover, expanded applications of lasers across clinical areas is expected to present significant growth opportunities in the market.
The medical laser market is segmented on the basis of product, application, end use, and region. By product, the market is classified into laser system and consumables. By application, the market is categorized into surgical lasers, dental laser, aesthetic lasers, and others. By end user, the market is divided into hospital, ambulatory surgical centers, and other. Region-wise, the market is analyzed across North America (the U.S., Canada, and Mexico), Europe (Germany, France, the UK, Italy, Spain, and rest of Europe), Asia-Pacific (Japan, China, Australia, India, South Korea, and rest of Asia-Pacific), and LAMEA (Brazil, South Africa, Saudi Arabia, and rest of LAMEA).
Major key players that operate in the global medical laser market are Bausch Health Companies, Inc, Boston Scientific Corporation, Koninklijke Philips N.V, Novartis AG, Biolase Inc, Iridex corporation, Artivion, Inc, Lumibird Medical, Candela Corporation and Cynosure, LLC.
Key Benefits For Stakeholders
- This report provides a quantitative analysis of the market segments, current trends, estimations, and dynamics of the medical laser market analysis from 2022 to 2032 to identify the prevailing medical laser market opportunities.
- The market research is offered along with information related to key drivers, restraints, and opportunities.
- Porter's five forces analysis highlights the potency of buyers and suppliers to enable stakeholders make profit-oriented business decisions and strengthen their supplier-buyer network.
- In-depth analysis of the medical laser market segmentation assists to determine the prevailing market opportunities.
- Major countries in each region are mapped according to their revenue contribution to the global market.
- Market player positioning facilitates benchmarking and provides a clear understanding of the present position of the market players.
- The report includes the analysis of the regional as well as global medical laser market trends, key players, market segments, application areas, and market growth strategies.
Additional benefits you will get with this purchase are:
- Quarterly Update and* (only available with a corporate license, on listed price)
- 5 additional Company Profile of client Choice pre- or Post-purchase, as a free update.
- Free Upcoming Version on the Purchase of Five and Enterprise User License.
- 16 analyst hours of support* (post-purchase, if you find additional data requirements upon review of the report, you may receive support amounting to 16 analyst hours to solve questions, and post-sale queries)
- 15% Free Customization* (in case the scope or segment of the report does not match your requirements, 15% is equivalent to 3 working days of free work, applicable once)
- Free data Pack on the Five and Enterprise User License. (Excel version of the report)
- Free Updated report if the report is 6-12 months old or older.
- 24-hour priority response*
- Free Industry updates and white papers.
Possible Customization with this report (with additional cost and timeline, please talk to the sales executive to know more)
- New Product Development/ Product Matrix of Key Players
- Additional company profiles with specific to client's interest
- Additional country or region analysis- market size and forecast
- Criss-cross segment analysis- market size and forecast
- Expanded list for Company Profiles
- Key player details (including location, contact details, supplier/vendor network etc. in excel format)
- SWOT Analysis
Key Market Segments
By Product Type
- Solid State laser systems
- Gas laser systems
- Dye laser systems
- Diode laser systems
By Application
- Ophthalmology lasers
- Surgical lasers
- Aesthetic and Dermatology Lasers
- Others
By End User
- Hospital
- Dermatology and Cosmetic Clinics
- Ophthalmic Clinics
- Others
By Region
- North America
- U.S.
- Canada
- Mexico
- Europe
- Germany
- France
- UK
- Italy
- Spain
- Rest of Europe
- Asia-Pacific
- China
- Japan
- India
- Australia
- South Korea
- Rest of Asia-Pacific
- LAMEA
- Brazil
- Saudi Arabia
- South Africa
- Rest of LAMEA
Key Market Players:
- Boston Scientific Corporation
- Bausch Health Companies, Inc.
- Candela Corporation.
- Lumibird Medical
- Koninklijke Philips N.V.
- Artivion, Inc.
- Cynosure Inc
- Novartis AG
- Biolase Inc
- Iridex corporation.
TABLE OF CONTENTS
CHAPTER 1: INTRODUCTION
- 1.1. Report description
- 1.2. Key market segments
- 1.3. Key benefits to the stakeholders
- 1.4. Research methodology
- 1.4.1. Primary research
- 1.4.2. Secondary research
- 1.4.3. Analyst tools and models
CHAPTER 2: EXECUTIVE SUMMARY
- 2.1. CXO Perspective
CHAPTER 3: MARKET OVERVIEW
- 3.1. Market definition and scope
- 3.2. Key findings
- 3.2.1. Top impacting factors
- 3.2.2. Top investment pockets
- 3.3. Porter's five forces analysis
- 3.3.1. Low bargaining power of suppliers
- 3.3.2. Low threat of new entrants
- 3.3.3. Low threat of substitutes
- 3.3.4. Low intensity of rivalry
- 3.3.5. Low bargaining power of buyers
- 3.4. Market dynamics
- 3.4.1. Drivers
- 3.4.1.1. High adoption of medical lasers by healthcare professionals
- 3.4.1.2. Technological advancement in the medical laser technology
- 3.4.1.3. Surge in prevalence of chronic diseases
- 3.4.2. Restraints
- 3.4.2.1. High cost of medical laser
- 3.4.3. Opportunities
- 3.4.3.1. Expanded applications of lasers across clinical areas
- 3.4.1. Drivers
CHAPTER 4: MEDICAL LASER MARKET, BY PRODUCT TYPE
- 4.1. Overview
- 4.1.1. Market size and forecast
- 4.2. Solid State laser systems
- 4.2.1. Key market trends, growth factors and opportunities
- 4.2.2. Market size and forecast, by region
- 4.2.3. Market share analysis by country
- 4.3. Gas laser systems
- 4.3.1. Key market trends, growth factors and opportunities
- 4.3.2. Market size and forecast, by region
- 4.3.3. Market share analysis by country
- 4.4. Dye laser systems
- 4.4.1. Key market trends, growth factors and opportunities
- 4.4.2. Market size and forecast, by region
- 4.4.3. Market share analysis by country
- 4.5. Diode laser systems
- 4.5.1. Key market trends, growth factors and opportunities
- 4.5.2. Market size and forecast, by region
- 4.5.3. Market share analysis by country
CHAPTER 5: MEDICAL LASER MARKET, BY APPLICATION
- 5.1. Overview
- 5.1.1. Market size and forecast
- 5.2. Ophthalmology lasers
- 5.2.1. Key market trends, growth factors and opportunities
- 5.2.2. Market size and forecast, by region
- 5.2.3. Market share analysis by country
- 5.3. Surgical lasers
- 5.3.1. Key market trends, growth factors and opportunities
- 5.3.2. Market size and forecast, by region
- 5.3.3. Market share analysis by country
- 5.4. Aesthetic and Dermatology Lasers
- 5.4.1. Key market trends, growth factors and opportunities
- 5.4.2. Market size and forecast, by region
- 5.4.3. Market share analysis by country
- 5.5. Others
- 5.5.1. Key market trends, growth factors and opportunities
- 5.5.2. Market size and forecast, by region
- 5.5.3. Market share analysis by country
CHAPTER 6: MEDICAL LASER MARKET, BY END USER
- 6.1. Overview
- 6.1.1. Market size and forecast
- 6.2. Hospital
- 6.2.1. Key market trends, growth factors and opportunities
- 6.2.2. Market size and forecast, by region
- 6.2.3. Market share analysis by country
- 6.3. Dermatology and Cosmetic Clinics
- 6.3.1. Key market trends, growth factors and opportunities
- 6.3.2. Market size and forecast, by region
- 6.3.3. Market share analysis by country
- 6.4. Ophthalmic Clinics
- 6.4.1. Key market trends, growth factors and opportunities
- 6.4.2. Market size and forecast, by region
- 6.4.3. Market share analysis by country
- 6.5. Others
- 6.5.1. Key market trends, growth factors and opportunities
- 6.5.2. Market size and forecast, by region
- 6.5.3. Market share analysis by country
CHAPTER 7: MEDICAL LASER MARKET, BY REGION
- 7.1. Overview
- 7.1.1. Market size and forecast By Region
- 7.2. North America
- 7.2.1. Key market trends, growth factors and opportunities
- 7.2.2. Market size and forecast, by Product Type
- 7.2.3. Market size and forecast, by Application
- 7.2.4. Market size and forecast, by End User
- 7.2.5. Market size and forecast, by country
- 7.2.5.1. U.S.
- 7.2.5.1.1. Market size and forecast, by Product Type
- 7.2.5.1.2. Market size and forecast, by Application
- 7.2.5.1.3. Market size and forecast, by End User
- 7.2.5.2. Canada
- 7.2.5.2.1. Market size and forecast, by Product Type
- 7.2.5.2.2. Market size and forecast, by Application
- 7.2.5.2.3. Market size and forecast, by End User
- 7.2.5.3. Mexico
- 7.2.5.3.1. Market size and forecast, by Product Type
- 7.2.5.3.2. Market size and forecast, by Application
- 7.2.5.3.3. Market size and forecast, by End User
- 7.3. Europe
- 7.3.1. Key market trends, growth factors and opportunities
- 7.3.2. Market size and forecast, by Product Type
- 7.3.3. Market size and forecast, by Application
- 7.3.4. Market size and forecast, by End User
- 7.3.5. Market size and forecast, by country
- 7.3.5.1. Germany
- 7.3.5.1.1. Market size and forecast, by Product Type
- 7.3.5.1.2. Market size and forecast, by Application
- 7.3.5.1.3. Market size and forecast, by End User
- 7.3.5.2. France
- 7.3.5.2.1. Market size and forecast, by Product Type
- 7.3.5.2.2. Market size and forecast, by Application
- 7.3.5.2.3. Market size and forecast, by End User
- 7.3.5.3. UK
- 7.3.5.3.1. Market size and forecast, by Product Type
- 7.3.5.3.2. Market size and forecast, by Application
- 7.3.5.3.3. Market size and forecast, by End User
- 7.3.5.4. Italy
- 7.3.5.4.1. Market size and forecast, by Product Type
- 7.3.5.4.2. Market size and forecast, by Application
- 7.3.5.4.3. Market size and forecast, by End User
- 7.3.5.5. Spain
- 7.3.5.5.1. Market size and forecast, by Product Type
- 7.3.5.5.2. Market size and forecast, by Application
- 7.3.5.5.3. Market size and forecast, by End User
- 7.3.5.6. Rest of Europe
- 7.3.5.6.1. Market size and forecast, by Product Type
- 7.3.5.6.2. Market size and forecast, by Application
- 7.3.5.6.3. Market size and forecast, by End User
- 7.4. Asia-Pacific
- 7.4.1. Key market trends, growth factors and opportunities
- 7.4.2. Market size and forecast, by Product Type
- 7.4.3. Market size and forecast, by Application
- 7.4.4. Market size and forecast, by End User
- 7.4.5. Market size and forecast, by country
- 7.4.5.1. China
- 7.4.5.1.1. Market size and forecast, by Product Type
- 7.4.5.1.2. Market size and forecast, by Application
- 7.4.5.1.3. Market size and forecast, by End User
- 7.4.5.2. Japan
- 7.4.5.2.1. Market size and forecast, by Product Type
- 7.4.5.2.2. Market size and forecast, by Application
- 7.4.5.2.3. Market size and forecast, by End User
- 7.4.5.3. India
- 7.4.5.3.1. Market size and forecast, by Product Type
- 7.4.5.3.2. Market size and forecast, by Application
- 7.4.5.3.3. Market size and forecast, by End User
- 7.4.5.4. Australia
- 7.4.5.4.1. Market size and forecast, by Product Type
- 7.4.5.4.2. Market size and forecast, by Application
- 7.4.5.4.3. Market size and forecast, by End User
- 7.4.5.5. South Korea
- 7.4.5.5.1. Market size and forecast, by Product Type
- 7.4.5.5.2. Market size and forecast, by Application
- 7.4.5.5.3. Market size and forecast, by End User
- 7.4.5.6. Rest of Asia-Pacific
- 7.4.5.6.1. Market size and forecast, by Product Type
- 7.4.5.6.2. Market size and forecast, by Application
- 7.4.5.6.3. Market size and forecast, by End User
- 7.5. LAMEA
- 7.5.1. Key market trends, growth factors and opportunities
- 7.5.2. Market size and forecast, by Product Type
- 7.5.3. Market size and forecast, by Application
- 7.5.4. Market size and forecast, by End User
- 7.5.5. Market size and forecast, by country
- 7.5.5.1. Brazil
- 7.5.5.1.1. Market size and forecast, by Product Type
- 7.5.5.1.2. Market size and forecast, by Application
- 7.5.5.1.3. Market size and forecast, by End User
- 7.5.5.2. Saudi Arabia
- 7.5.5.2.1. Market size and forecast, by Product Type
- 7.5.5.2.2. Market size and forecast, by Application
- 7.5.5.2.3. Market size and forecast, by End User
- 7.5.5.3. South Africa
- 7.5.5.3.1. Market size and forecast, by Product Type
- 7.5.5.3.2. Market size and forecast, by Application
- 7.5.5.3.3. Market size and forecast, by End User
- 7.5.5.4. Rest of LAMEA
- 7.5.5.4.1. Market size and forecast, by Product Type
- 7.5.5.4.2. Market size and forecast, by Application
- 7.5.5.4.3. Market size and forecast, by End User
CHAPTER 8: COMPETITIVE LANDSCAPE
- 8.1. Introduction
- 8.2. Top winning strategies
- 8.3. Product mapping of top 10 player
- 8.4. Competitive dashboard
- 8.5. Competitive heatmap
- 8.6. Top player positioning, 2022
CHAPTER 9: COMPANY PROFILES
- 9.1. Bausch Health Companies, Inc.
- 9.1.1. Company overview
- 9.1.2. Key executives
- 9.1.3. Company snapshot
- 9.1.4. Operating business segments
- 9.1.5. Product portfolio
- 9.1.6. Business performance
- 9.1.7. Key strategic moves and developments
- 9.2. Biolase Inc
- 9.2.1. Company overview
- 9.2.2. Key executives
- 9.2.3. Company snapshot
- 9.2.4. Operating business segments
- 9.2.5. Product portfolio
- 9.2.6. Business performance
- 9.3. Boston Scientific Corporation
- 9.3.1. Company overview
- 9.3.2. Key executives
- 9.3.3. Company snapshot
- 9.3.4. Operating business segments
- 9.3.5. Product portfolio
- 9.3.6. Business performance
- 9.3.7. Key strategic moves and developments
- 9.4. Iridex corporation.
- 9.4.1. Company overview
- 9.4.2. Key executives
- 9.4.3. Company snapshot
- 9.4.4. Operating business segments
- 9.4.5. Product portfolio
- 9.4.6. Business performance
- 9.5. Koninklijke Philips N.V.
- 9.5.1. Company overview
- 9.5.2. Key executives
- 9.5.3. Company snapshot
- 9.5.4. Operating business segments
- 9.5.5. Product portfolio
- 9.5.6. Business performance
- 9.5.7. Key strategic moves and developments
- 9.6. Novartis AG
- 9.6.1. Company overview
- 9.6.2. Key executives
- 9.6.3. Company snapshot
- 9.6.4. Operating business segments
- 9.6.5. Product portfolio
- 9.6.6. Business performance
- 9.7. Artivion, Inc.
- 9.7.1. Company overview
- 9.7.2. Key executives
- 9.7.3. Company snapshot
- 9.7.4. Operating business segments
- 9.7.5. Product portfolio
- 9.7.6. Business performance
- 9.8. Lumibird Medical
- 9.8.1. Company overview
- 9.8.2. Key executives
- 9.8.3. Company snapshot
- 9.8.4. Operating business segments
- 9.8.5. Product portfolio
- 9.8.6. Key strategic moves and developments
- 9.9. Candela Corporation.
- 9.9.1. Company overview
- 9.9.2. Key executives
- 9.9.3. Company snapshot
- 9.9.4. Operating business segments
- 9.9.5. Product portfolio
- 9.9.6. Key strategic moves and developments
- 9.10. Cynosure Inc
- 9.10.1. Company overview
- 9.10.2. Key executives
- 9.10.3. Company snapshot
- 9.10.4. Operating business segments
- 9.10.5. Product portfolio
LIST OF TABLES
- TABLE 01. GLOBAL MEDICAL LASER MARKET, BY PRODUCT TYPE, 2022-2032 ($MILLION)
- TABLE 02. MEDICAL LASER MARKET FOR SOLID STATE LASER SYSTEMS, BY REGION, 2022-2032 ($MILLION)
- TABLE 03. MEDICAL LASER MARKET FOR GAS LASER SYSTEMS, BY REGION, 2022-2032 ($MILLION)
- TABLE 04. MEDICAL LASER MARKET FOR DYE LASER SYSTEMS, BY REGION, 2022-2032 ($MILLION)
- TABLE 05. MEDICAL LASER MARKET FOR DIODE LASER SYSTEMS, BY REGION, 2022-2032 ($MILLION)
- TABLE 06. GLOBAL MEDICAL LASER MARKET, BY APPLICATION, 2022-2032 ($MILLION)
- TABLE 07. MEDICAL LASER MARKET FOR OPHTHALMOLOGY LASERS, BY REGION, 2022-2032 ($MILLION)
- TABLE 08. MEDICAL LASER MARKET FOR SURGICAL LASERS, BY REGION, 2022-2032 ($MILLION)
- TABLE 09. MEDICAL LASER MARKET FOR AESTHETIC AND DERMATOLOGY LASERS, BY REGION, 2022-2032 ($MILLION)
- TABLE 10. MEDICAL LASER MARKET FOR OTHERS, BY REGION, 2022-2032 ($MILLION)
- TABLE 11. GLOBAL MEDICAL LASER MARKET, BY END USER, 2022-2032 ($MILLION)
- TABLE 12. MEDICAL LASER MARKET FOR HOSPITAL, BY REGION, 2022-2032 ($MILLION)
- TABLE 13. MEDICAL LASER MARKET FOR DERMATOLOGY AND COSMETIC CLINICS, BY REGION, 2022-2032 ($MILLION)
- TABLE 14. MEDICAL LASER MARKET FOR OPHTHALMIC CLINICS, BY REGION, 2022-2032 ($MILLION)
- TABLE 15. MEDICAL LASER MARKET FOR OTHERS, BY REGION, 2022-2032 ($MILLION)
- TABLE 16. MEDICAL LASER MARKET, BY REGION, 2022-2032 ($MILLION)
- TABLE 17. NORTH AMERICA MEDICAL LASER MARKET, BY PRODUCT TYPE, 2022-2032 ($MILLION)
- TABLE 18. NORTH AMERICA MEDICAL LASER MARKET, BY APPLICATION, 2022-2032 ($MILLION)
- TABLE 19. NORTH AMERICA MEDICAL LASER MARKET, BY END USER, 2022-2032 ($MILLION)
- TABLE 20. NORTH AMERICA MEDICAL LASER MARKET, BY COUNTRY, 2022-2032 ($MILLION)
- TABLE 21. U.S. MEDICAL LASER MARKET, BY PRODUCT TYPE, 2022-2032 ($MILLION)
- TABLE 22. U.S. MEDICAL LASER MARKET, BY APPLICATION, 2022-2032 ($MILLION)
- TABLE 23. U.S. MEDICAL LASER MARKET, BY END USER, 2022-2032 ($MILLION)
- TABLE 24. CANADA MEDICAL LASER MARKET, BY PRODUCT TYPE, 2022-2032 ($MILLION)
- TABLE 25. CANADA MEDICAL LASER MARKET, BY APPLICATION, 2022-2032 ($MILLION)
- TABLE 26. CANADA MEDICAL LASER MARKET, BY END USER, 2022-2032 ($MILLION)
- TABLE 27. MEXICO MEDICAL LASER MARKET, BY PRODUCT TYPE, 2022-2032 ($MILLION)
- TABLE 28. MEXICO MEDICAL LASER MARKET, BY APPLICATION, 2022-2032 ($MILLION)
- TABLE 29. MEXICO MEDICAL LASER MARKET, BY END USER, 2022-2032 ($MILLION)
- TABLE 30. EUROPE MEDICAL LASER MARKET, BY PRODUCT TYPE, 2022-2032 ($MILLION)
- TABLE 31. EUROPE MEDICAL LASER MARKET, BY APPLICATION, 2022-2032 ($MILLION)
- TABLE 32. EUROPE MEDICAL LASER MARKET, BY END USER, 2022-2032 ($MILLION)
- TABLE 33. EUROPE MEDICAL LASER MARKET, BY COUNTRY, 2022-2032 ($MILLION)
- TABLE 34. GERMANY MEDICAL LASER MARKET, BY PRODUCT TYPE, 2022-2032 ($MILLION)
- TABLE 35. GERMANY MEDICAL LASER MARKET, BY APPLICATION, 2022-2032 ($MILLION)
- TABLE 36. GERMANY MEDICAL LASER MARKET, BY END USER, 2022-2032 ($MILLION)
- TABLE 37. FRANCE MEDICAL LASER MARKET, BY PRODUCT TYPE, 2022-2032 ($MILLION)
- TABLE 38. FRANCE MEDICAL LASER MARKET, BY APPLICATION, 2022-2032 ($MILLION)
- TABLE 39. FRANCE MEDICAL LASER MARKET, BY END USER, 2022-2032 ($MILLION)
- TABLE 40. UK MEDICAL LASER MARKET, BY PRODUCT TYPE, 2022-2032 ($MILLION)
- TABLE 41. UK MEDICAL LASER MARKET, BY APPLICATION, 2022-2032 ($MILLION)
- TABLE 42. UK MEDICAL LASER MARKET, BY END USER, 2022-2032 ($MILLION)
- TABLE 43. ITALY MEDICAL LASER MARKET, BY PRODUCT TYPE, 2022-2032 ($MILLION)
- TABLE 44. ITALY MEDICAL LASER MARKET, BY APPLICATION, 2022-2032 ($MILLION)
- TABLE 45. ITALY MEDICAL LASER MARKET, BY END USER, 2022-2032 ($MILLION)
- TABLE 46. SPAIN MEDICAL LASER MARKET, BY PRODUCT TYPE, 2022-2032 ($MILLION)
- TABLE 47. SPAIN MEDICAL LASER MARKET, BY APPLICATION, 2022-2032 ($MILLION)
- TABLE 48. SPAIN MEDICAL LASER MARKET, BY END USER, 2022-2032 ($MILLION)
- TABLE 49. REST OF EUROPE MEDICAL LASER MARKET, BY PRODUCT TYPE, 2022-2032 ($MILLION)
- TABLE 50. REST OF EUROPE MEDICAL LASER MARKET, BY APPLICATION, 2022-2032 ($MILLION)
- TABLE 51. REST OF EUROPE MEDICAL LASER MARKET, BY END USER, 2022-2032 ($MILLION)
- TABLE 52. ASIA-PACIFIC MEDICAL LASER MARKET, BY PRODUCT TYPE, 2022-2032 ($MILLION)
- TABLE 53. ASIA-PACIFIC MEDICAL LASER MARKET, BY APPLICATION, 2022-2032 ($MILLION)
- TABLE 54. ASIA-PACIFIC MEDICAL LASER MARKET, BY END USER, 2022-2032 ($MILLION)
- TABLE 55. ASIA-PACIFIC MEDICAL LASER MARKET, BY COUNTRY, 2022-2032 ($MILLION)
- TABLE 56. CHINA MEDICAL LASER MARKET, BY PRODUCT TYPE, 2022-2032 ($MILLION)
- TABLE 57. CHINA MEDICAL LASER MARKET, BY APPLICATION, 2022-2032 ($MILLION)
- TABLE 58. CHINA MEDICAL LASER MARKET, BY END USER, 2022-2032 ($MILLION)
- TABLE 59. JAPAN MEDICAL LASER MARKET, BY PRODUCT TYPE, 2022-2032 ($MILLION)
- TABLE 60. JAPAN MEDICAL LASER MARKET, BY APPLICATION, 2022-2032 ($MILLION)
- TABLE 61. JAPAN MEDICAL LASER MARKET, BY END USER, 2022-2032 ($MILLION)
- TABLE 62. INDIA MEDICAL LASER MARKET, BY PRODUCT TYPE, 2022-2032 ($MILLION)
- TABLE 63. INDIA MEDICAL LASER MARKET, BY APPLICATION, 2022-2032 ($MILLION)
- TABLE 64. INDIA MEDICAL LASER MARKET, BY END USER, 2022-2032 ($MILLION)
- TABLE 65. AUSTRALIA MEDICAL LASER MARKET, BY PRODUCT TYPE, 2022-2032 ($MILLION)
- TABLE 66. AUSTRALIA MEDICAL LASER MARKET, BY APPLICATION, 2022-2032 ($MILLION)
- TABLE 67. AUSTRALIA MEDICAL LASER MARKET, BY END USER, 2022-2032 ($MILLION)
- TABLE 68. SOUTH KOREA MEDICAL LASER MARKET, BY PRODUCT TYPE, 2022-2032 ($MILLION)
- TABLE 69. SOUTH KOREA MEDICAL LASER MARKET, BY APPLICATION, 2022-2032 ($MILLION)
- TABLE 70. SOUTH KOREA MEDICAL LASER MARKET, BY END USER, 2022-2032 ($MILLION)
- TABLE 71. REST OF ASIA-PACIFIC MEDICAL LASER MARKET, BY PRODUCT TYPE, 2022-2032 ($MILLION)
- TABLE 72. REST OF ASIA-PACIFIC MEDICAL LASER MARKET, BY APPLICATION, 2022-2032 ($MILLION)
- TABLE 73. REST OF ASIA-PACIFIC MEDICAL LASER MARKET, BY END USER, 2022-2032 ($MILLION)
- TABLE 74. LAMEA MEDICAL LASER MARKET, BY PRODUCT TYPE, 2022-2032 ($MILLION)
- TABLE 75. LAMEA MEDICAL LASER MARKET, BY APPLICATION, 2022-2032 ($MILLION)
- TABLE 76. LAMEA MEDICAL LASER MARKET, BY END USER, 2022-2032 ($MILLION)
- TABLE 77. LAMEA MEDICAL LASER MARKET, BY COUNTRY, 2022-2032 ($MILLION)
- TABLE 78. BRAZIL MEDICAL LASER MARKET, BY PRODUCT TYPE, 2022-2032 ($MILLION)
- TABLE 79. BRAZIL MEDICAL LASER MARKET, BY APPLICATION, 2022-2032 ($MILLION)
- TABLE 80. BRAZIL MEDICAL LASER MARKET, BY END USER, 2022-2032 ($MILLION)
- TABLE 81. SAUDI ARABIA MEDICAL LASER MARKET, BY PRODUCT TYPE, 2022-2032 ($MILLION)
- TABLE 82. SAUDI ARABIA MEDICAL LASER MARKET, BY APPLICATION, 2022-2032 ($MILLION)
- TABLE 83. SAUDI ARABIA MEDICAL LASER MARKET, BY END USER, 2022-2032 ($MILLION)
- TABLE 84. SOUTH AFRICA MEDICAL LASER MARKET, BY PRODUCT TYPE, 2022-2032 ($MILLION)
- TABLE 85. SOUTH AFRICA MEDICAL LASER MARKET, BY APPLICATION, 2022-2032 ($MILLION)
- TABLE 86. SOUTH AFRICA MEDICAL LASER MARKET, BY END USER, 2022-2032 ($MILLION)
- TABLE 87. REST OF LAMEA MEDICAL LASER MARKET, BY PRODUCT TYPE, 2022-2032 ($MILLION)
- TABLE 88. REST OF LAMEA MEDICAL LASER MARKET, BY APPLICATION, 2022-2032 ($MILLION)
- TABLE 89. REST OF LAMEA MEDICAL LASER MARKET, BY END USER, 2022-2032 ($MILLION)
- TABLE 90. BAUSCH HEALTH COMPANIES, INC.: KEY EXECUTIVES
- TABLE 91. BAUSCH HEALTH COMPANIES, INC.: COMPANY SNAPSHOT
- TABLE 92. BAUSCH HEALTH COMPANIES, INC.: PRODUCT SEGMENTS
- TABLE 93. BAUSCH HEALTH COMPANIES, INC.: PRODUCT PORTFOLIO
- TABLE 94. BAUSCH HEALTH COMPANIES, INC.: KEY STRATERGIES
- TABLE 95. BIOLASE INC: KEY EXECUTIVES
- TABLE 96. BIOLASE INC: COMPANY SNAPSHOT
- TABLE 97. BIOLASE INC: PRODUCT SEGMENTS
- TABLE 98. BIOLASE INC: PRODUCT PORTFOLIO
- TABLE 99. BOSTON SCIENTIFIC CORPORATION: KEY EXECUTIVES
- TABLE 100. BOSTON SCIENTIFIC CORPORATION: COMPANY SNAPSHOT
- TABLE 101. BOSTON SCIENTIFIC CORPORATION: PRODUCT SEGMENTS
- TABLE 102. BOSTON SCIENTIFIC CORPORATION: PRODUCT PORTFOLIO
- TABLE 103. BOSTON SCIENTIFIC CORPORATION: KEY STRATERGIES
- TABLE 104. IRIDEX CORPORATION.: KEY EXECUTIVES
- TABLE 105. IRIDEX CORPORATION.: COMPANY SNAPSHOT
- TABLE 106. IRIDEX CORPORATION.: PRODUCT SEGMENTS
- TABLE 107. IRIDEX CORPORATION.: PRODUCT PORTFOLIO
- TABLE 108. KONINKLIJKE PHILIPS N.V.: KEY EXECUTIVES
- TABLE 109. KONINKLIJKE PHILIPS N.V.: COMPANY SNAPSHOT
- TABLE 110. KONINKLIJKE PHILIPS N.V.: SERVICE SEGMENTS
- TABLE 111. KONINKLIJKE PHILIPS N.V.: PRODUCT PORTFOLIO
- TABLE 112. KONINKLIJKE PHILIPS N.V.: KEY STRATERGIES
- TABLE 113. NOVARTIS AG: KEY EXECUTIVES
- TABLE 114. NOVARTIS AG: COMPANY SNAPSHOT
- TABLE 115. NOVARTIS AG: PRODUCT SEGMENTS
- TABLE 116. NOVARTIS AG: PRODUCT PORTFOLIO
- TABLE 117. ARTIVION, INC.: KEY EXECUTIVES
- TABLE 118. ARTIVION, INC.: COMPANY SNAPSHOT
- TABLE 119. ARTIVION, INC.: PRODUCT SEGMENTS
- TABLE 120. ARTIVION, INC.: PRODUCT PORTFOLIO
- TABLE 121. LUMIBIRD MEDICAL: KEY EXECUTIVES
- TABLE 122. LUMIBIRD MEDICAL: COMPANY SNAPSHOT
- TABLE 123. LUMIBIRD MEDICAL: PRODUCT SEGMENTS
- TABLE 124. LUMIBIRD MEDICAL: PRODUCT PORTFOLIO
- TABLE 125. LUMIBIRD MEDICAL: KEY STRATERGIES
- TABLE 126. CANDELA CORPORATION.: KEY EXECUTIVES
- TABLE 127. CANDELA CORPORATION.: COMPANY SNAPSHOT
- TABLE 128. CANDELA CORPORATION.: PRODUCT SEGMENTS
- TABLE 129. CANDELA CORPORATION.: PRODUCT PORTFOLIO
- TABLE 130. CANDELA CORPORATION.: KEY STRATERGIES
- TABLE 131. CYNOSURE INC: KEY EXECUTIVES
- TABLE 132. CYNOSURE INC: COMPANY SNAPSHOT
- TABLE 133. CYNOSURE INC: PRODUCT SEGMENTS
- TABLE 134. CYNOSURE INC: PRODUCT PORTFOLIO
LIST OF FIGURES
- FIGURE 01. MEDICAL LASER MARKET, 2022-2032
- FIGURE 02. SEGMENTATION OF MEDICAL LASER MARKET,2022-2032
- FIGURE 03. TOP IMPACTING FACTORS IN MEDICAL LASER MARKET (2022 TO 2032)
- FIGURE 04. TOP INVESTMENT POCKETS IN MEDICAL LASER MARKET (2023-2032)
- FIGURE 05. LOW BARGAINING POWER OF SUPPLIERS
- FIGURE 06. LOW THREAT OF NEW ENTRANTS
- FIGURE 07. LOW THREAT OF SUBSTITUTES
- FIGURE 08. LOW INTENSITY OF RIVALRY
- FIGURE 09. LOW BARGAINING POWER OF BUYERS
- FIGURE 10. GLOBAL MEDICAL LASER MARKET:DRIVERS, RESTRAINTS AND OPPORTUNITIES
- FIGURE 11. MEDICAL LASER MARKET, BY PRODUCT TYPE, 2022 AND 2032(%)
- FIGURE 12. COMPARATIVE SHARE ANALYSIS OF MEDICAL LASER MARKET FOR SOLID STATE LASER SYSTEMS, BY COUNTRY 2022 AND 2032(%)
- FIGURE 13. COMPARATIVE SHARE ANALYSIS OF MEDICAL LASER MARKET FOR GAS LASER SYSTEMS, BY COUNTRY 2022 AND 2032(%)
- FIGURE 14. COMPARATIVE SHARE ANALYSIS OF MEDICAL LASER MARKET FOR DYE LASER SYSTEMS, BY COUNTRY 2022 AND 2032(%)
- FIGURE 15. COMPARATIVE SHARE ANALYSIS OF MEDICAL LASER MARKET FOR DIODE LASER SYSTEMS, BY COUNTRY 2022 AND 2032(%)
- FIGURE 16. MEDICAL LASER MARKET, BY APPLICATION, 2022 AND 2032(%)
- FIGURE 17. COMPARATIVE SHARE ANALYSIS OF MEDICAL LASER MARKET FOR OPHTHALMOLOGY LASERS, BY COUNTRY 2022 AND 2032(%)
- FIGURE 18. COMPARATIVE SHARE ANALYSIS OF MEDICAL LASER MARKET FOR SURGICAL LASERS, BY COUNTRY 2022 AND 2032(%)
- FIGURE 19. COMPARATIVE SHARE ANALYSIS OF MEDICAL LASER MARKET FOR AESTHETIC AND DERMATOLOGY LASERS, BY COUNTRY 2022 AND 2032(%)
- FIGURE 20. COMPARATIVE SHARE ANALYSIS OF MEDICAL LASER MARKET FOR OTHERS, BY COUNTRY 2022 AND 2032(%)
- FIGURE 21. MEDICAL LASER MARKET, BY END USER, 2022 AND 2032(%)
- FIGURE 22. COMPARATIVE SHARE ANALYSIS OF MEDICAL LASER MARKET FOR HOSPITAL, BY COUNTRY 2022 AND 2032(%)
- FIGURE 23. COMPARATIVE SHARE ANALYSIS OF MEDICAL LASER MARKET FOR DERMATOLOGY AND COSMETIC CLINICS, BY COUNTRY 2022 AND 2032(%)
- FIGURE 24. COMPARATIVE SHARE ANALYSIS OF MEDICAL LASER MARKET FOR OPHTHALMIC CLINICS, BY COUNTRY 2022 AND 2032(%)
- FIGURE 25. COMPARATIVE SHARE ANALYSIS OF MEDICAL LASER MARKET FOR OTHERS, BY COUNTRY 2022 AND 2032(%)
- FIGURE 26. MEDICAL LASER MARKET BY REGION, 2022 AND 2032(%)
- FIGURE 27. U.S. MEDICAL LASER MARKET, 2022-2032 ($MILLION)
- FIGURE 28. CANADA MEDICAL LASER MARKET, 2022-2032 ($MILLION)
- FIGURE 29. MEXICO MEDICAL LASER MARKET, 2022-2032 ($MILLION)
- FIGURE 30. GERMANY MEDICAL LASER MARKET, 2022-2032 ($MILLION)
- FIGURE 31. FRANCE MEDICAL LASER MARKET, 2022-2032 ($MILLION)
- FIGURE 32. UK MEDICAL LASER MARKET, 2022-2032 ($MILLION)
- FIGURE 33. ITALY MEDICAL LASER MARKET, 2022-2032 ($MILLION)
- FIGURE 34. SPAIN MEDICAL LASER MARKET, 2022-2032 ($MILLION)
- FIGURE 35. REST OF EUROPE MEDICAL LASER MARKET, 2022-2032 ($MILLION)
- FIGURE 36. CHINA MEDICAL LASER MARKET, 2022-2032 ($MILLION)
- FIGURE 37. JAPAN MEDICAL LASER MARKET, 2022-2032 ($MILLION)
- FIGURE 38. INDIA MEDICAL LASER MARKET, 2022-2032 ($MILLION)
- FIGURE 39. AUSTRALIA MEDICAL LASER MARKET, 2022-2032 ($MILLION)
- FIGURE 40. SOUTH KOREA MEDICAL LASER MARKET, 2022-2032 ($MILLION)
- FIGURE 41. REST OF ASIA-PACIFIC MEDICAL LASER MARKET, 2022-2032 ($MILLION)
- FIGURE 42. BRAZIL MEDICAL LASER MARKET, 2022-2032 ($MILLION)
- FIGURE 43. SAUDI ARABIA MEDICAL LASER MARKET, 2022-2032 ($MILLION)
- FIGURE 44. SOUTH AFRICA MEDICAL LASER MARKET, 2022-2032 ($MILLION)
- FIGURE 45. REST OF LAMEA MEDICAL LASER MARKET, 2022-2032 ($MILLION)
- FIGURE 46. TOP WINNING STRATEGIES, BY YEAR (2020-2023)
- FIGURE 47. TOP WINNING STRATEGIES, BY DEVELOPMENT (2020-2023)
- FIGURE 48. TOP WINNING STRATEGIES, BY COMPANY (2020-2023)
- FIGURE 49. PRODUCT MAPPING OF TOP 10 PLAYERS
- FIGURE 50. COMPETITIVE DASHBOARD
- FIGURE 51. COMPETITIVE HEATMAP: MEDICAL LASER MARKET
- FIGURE 52. TOP PLAYER POSITIONING, 2022
- FIGURE 53. BAUSCH HEALTH COMPANIES, INC.: NET REVENUE, 2020-2022 ($MILLION)
- FIGURE 54. BAUSCH HEALTH COMPANIES, INC.: REVENUE SHARE BY SEGMENT, 2022 (%)
- FIGURE 55. BAUSCH HEALTH COMPANIES, INC.: REVENUE SHARE BY REGION, 2022 (%)
- FIGURE 56. BIOLASE INC: NET REVENUE, 2020-2022 ($MILLION)
- FIGURE 57. BIOLASE INC: REVENUE SHARE BY REGION, 2022 (%)
- FIGURE 58. BOSTON SCIENTIFIC CORPORATION: NET SALES, 2020-2022 ($MILLION)
- FIGURE 59. BOSTON SCIENTIFIC CORPORATION: REVENUE SHARE BY SEGMENT, 2022 (%)
- FIGURE 60. BOSTON SCIENTIFIC CORPORATION: REVENUE SHARE BY REGION, 2022 (%)
- FIGURE 61. IRIDEX CORPORATION.: NET REVENUE, 2020-2022 ($MILLION)
- FIGURE 62. IRIDEX CORPORATION.: REVENUE SHARE BY REGION, 2022 (%)
- FIGURE 63. KONINKLIJKE PHILIPS N.V.: NET SALES, 2020-2022 ($MILLION)
- FIGURE 64. KONINKLIJKE PHILIPS N.V.: RESEARCH & DEVELOPMENT EXPENDITURE, 2020-2022 ($MILLION)
- FIGURE 65. KONINKLIJKE PHILIPS N.V.: REVENUE SHARE BY SEGMENT, 2022 (%)
- FIGURE 66. KONINKLIJKE PHILIPS N.V.: REVENUE SHARE BY REGION, 2022 (%)
- FIGURE 67. NOVARTIS AG: NET SALES, 2020-2022 ($MILLION)
- FIGURE 68. NOVARTIS AG: REVENUE SHARE BY SEGMENT, 2022 (%)
- FIGURE 69. NOVARTIS AG: REVENUE SHARE BY REGION, 2022 (%)
- FIGURE 70. ARTIVION, INC.: NET REVENUE, 2020-2022 ($MILLION)
- FIGURE 71. ARTIVION, INC.: REVENUE SHARE BY SEGMENT, 2022 (%)
- FIGURE 72. ARTIVION, INC.: REVENUE SHARE BY REGION, 2022 (%)
 2024 年醫用泌尿系統雷射全球市場報告
 全球醫用雷射市場:技術、應用、最終用戶未滿足的需求 - 預測(~2028 年)
 醫療雷射系統市場報告:2030 年趨勢、預測與競爭分析
 醫療雷射系統的全球市場:市場規模、區域前景、競爭策略以及按產品和應用分類的細分市場預測(截至 2033 年)
 醫療雷射系統市場 - 2018-2028 年全球產業規模、佔有率、趨勢、機會和預測,按產品、按應用、地區和競爭細分
 醫療雷射系統市場,按產品類型、按應用、最終用途、國家和地區 - 2023-2030 年行業分析、市場規模、市場佔有率和預測
 2024 年醫療雷射全球市場報告
 醫療雷射系統市場規模、佔有率、趨勢分析報告:按產品、按用途、按地區、細分趨勢,2023-2030
 醫療雷射市場:按產品類型、按應用、按最終用戶、按地區、機會、預測,2016-2030 年
 2030 年醫用雷射市場預測 - 按產品、類型、用途、最終用戶和地區分類的全球分析