


 |
市場調查報告書
商品編碼
1365773
子宮切除裝置市場:按疾病類型、手術方法和最終用戶分類:2022-2031 年全球機會分析和產業預測Hysterectomy Device Market By Disease type, By Surgical approach, By End User : Global Opportunity Analysis and Industry Forecast, 2022-2031 |
||||||
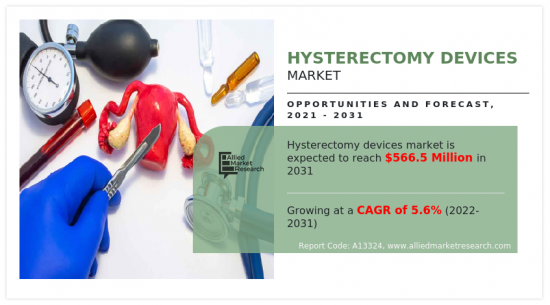
2021年子宮切除設備市場價值為3.2809億美元,預計2022年至2031年年複合成長率為5.6%,2031年達到5.665億美元。
子宮切除設備市場的促進因素是子宮內膜患病盛行率的上升。子宮內膜癌是最常見的婦科癌症之一,子宮切除術是此疾病的常見治療方法。此外,各種政府組織和非政府組織正在提高人們對女性健康的認知,這也促進了市場的成長。此外,子宮切除裝置近年來經歷了許多技術進步,手術效果得到改善,患者不適減少,恢復時間縮短也促進了市場成長。
然而,治療婦科疾病的替代治療方法等要素預計將阻礙子宮切除設備市場的成長。同時,微創手術需求的激增和微創手術預計將為市場提供成長機會。
目錄
第1章 簡介
第2章 執行摘要
第3章 市場概況
- 市場定義和範圍
- 主要發現
- 影響要素
- 主要投資機會
- 波特五力分析
- 市場動態
- 促進因素
- 子宮內膜患病盛行率上升
- 提高女性健康意識
- 子宮切除裝置的技術進步
- 抑制因素
- 替代治療的可用性
- 機會
- 微創手術需求增加
- 促進因素
- COVID-19 市場影響分析
第4章 子宮切除裝置市場:依疾病類型
- 概述
- 子宮癌
- 子宮肌瘤
- 慢性骨盆腔疼痛
- 其他
第5章 子宮切除裝置市場:透過手術方法
- 概述
- 陰道子宮切除術
- 腹腔鏡子宮切除術
- 機器人輔助腹腔鏡子宮切除術
- 經腹子宮切除術
第6章 子宮切除裝置市場:依最終使用者分類
- 概述
- 醫院
- 門診手術中心
- 其他
第7章 子宮切除裝置市場:依地區
- 概述
- 北美洲
- 美國
- 加拿大
- 墨西哥
- 歐洲
- 德國
- 法國
- 英國
- 義大利
- 西班牙
- 其他
- 亞太地區
- 日本
- 中國
- 印度
- 澳洲
- 韓國
- 其他
- 拉丁美洲/中東/非洲
- 巴西
- 沙烏地阿拉伯
- 南非
- 其他
第8章 競爭形勢
- 介紹
- 關鍵成功策略
- 10家主要企業產品圖譜
- 競爭儀表板
- 競爭熱圖
- 2021年主要企業定位
第9章 公司簡介
- Conkin surgical instruments ltd
- KARL STORZ GmbH & Co. KG
- CONMED Corporation
- Richard Wolf GmbH
- fortimedix surgical bv
- Johnson & Johnson
- Laborie, Inc
- Cooper Companies, Inc.
- B. Braun Melsungen AG
- Medtronic plc
According to a new report published by Allied Market Research, titled, "Hysterectomy Device Market," The hysterectomy device market was valued at $328.09 million in 2021, and is estimated to reach $566.5 million by 2031, growing at a CAGR of 5.6% from 2022 to 2031.
The driving factors for hysterectomy device market is rise in prevalence of uterine cancer. Uterine cancer is one of the most common gynecological cancers, and hysterectomy is a common treatment option for this disease. In addition, various government organizations and NGOs are creating awareness among the people about women's health which also fuels the market growth. Moreover, hysterectomy devices have seen a number of technological advancements in recent years, which have improved surgical outcomes, decreased patient discomfort and recovery time also propels the market growth.
However, factors such as availability of alternative treatment for the treatment of gynecological disorders expected to hinder the growth of hysterectomy device market. On the other hand, a surge in demand for minimally or less invasive surgeries is anticipated to offer growth opportunity for the market.
The global hysterectomy device market is segmented into disease type, surgical approach, end user and region. By disease type, the market is categorized into uterine cancer, fibroids, chronic pelvic pain and others. On the basis of surgical approach, the market is segregated into vaginal hysterectomy, laparoscopic hysterectomy, robotic assisted laparoscopic hysterectomy and abdominal hysterectomy. On the basis of end user, the market is categorized into hospitals, ambulatory surgical center and others. Region wise, the market is analyzed across North America (the U.S., Canada, and Mexico), Europe (Germany, France, the UK, Italy, Spain, and rest of Europe), Asia-Pacific (Japan, China, Australia, India, South Korea, and rest of Asia-Pacific), and LAMEA (Brazil, South Africa, Saudi Arabia, and rest of LAMEA).
Major Key players that operate in the global hysterectomy device market are Conkin surgical instruments ltd, Cooper Surgical, B. braun medical ltd, KARL STORZ GmbH & Co. KG, Conmed Corporation, Jhonson & Jhonson, Richard Wolf GmbH, Fortimedix Surgical, Medtronic corporation and Laborie, Inc.
Key Benefits For Stakeholders
- This report provides a quantitative analysis of the market segments, current trends, estimations, and dynamics of the hysterectomy device market analysis from 2021 to 2031 to identify the prevailing hysterectomy device market opportunities.
- The market research is offered along with information related to key drivers, restraints, and opportunities.
- Porter's five forces analysis highlights the potency of buyers and suppliers to enable stakeholders make profit-oriented business decisions and strengthen their supplier-buyer network.
- In-depth analysis of the hysterectomy device market segmentation assists to determine the prevailing market opportunities.
- Major countries in each region are mapped according to their revenue contribution to the global market.
- Market player positioning facilitates benchmarking and provides a clear understanding of the present position of the market players.
- The report includes the analysis of the regional as well as global hysterectomy device market trends, key players, market segments, application areas, and market growth strategies.
Additional benefits you will get with this purchase are:
- Quarterly Update and* (only available with a corporate license, on listed price)
- 5 additional Company Profile of client Choice pre- or Post-purchase, as a free update.
- Free Upcoming Version on the Purchase of Five and Enterprise User License.
- 16 analyst hours of support* (post-purchase, if you find additional data requirements upon review of the report, you may receive support amounting to 16 analyst hours to solve questions, and post-sale queries)
- 15% Free Customization* (in case the scope or segment of the report does not match your requirements, 20% is equivalent to 3 working days of free work, applicable once)
- Free data Pack on the Five and Enterprise User License. (Excel version of the report)
- Free Updated report if the report is 6-12 months old or older.
- 24-hour priority response*
- Free Industry updates and white papers.
Possible Customization with this report (with additional cost and timeline talk to the sales executive to know more)
- New Product Development/ Product Matrix of Key Players
- Regulatory Guidelines
- Additional company profiles with specific to client's interest
- Criss-cross segment analysis- market size and forecast
- Expanded list for Company Profiles
- Historic market data
- Key player details (including location, contact details, supplier/vendor network etc. in excel format)
- SWOT Analysis
Key Market Segments
By Surgical approach
- Laparoscopic hysterectomy
- Robotic assisted laparoscopic hysterectomy
- Abdominal hysterectomy
- Vaginal hysterectomy
By Disease type
- Uterine Cancer
- Fibroids
- Chronic pelvic pain
- Others
By End User
- Hospitals
- Ambulatory Surgical Centers
- Others
By Region
- North America
- U.S.
- Canada
- Mexico
- Europe
- Germany
- France
- UK
- Italy
- Spain
- Rest of Europe
- Asia-Pacific
- Japan
- China
- India
- Australia
- South Korea
- Rest of Asia-Pacific
- LAMEA
- Brazil
- Saudi Arabia
- South Africa
- Rest of LAMEA
Key Market Players:
- B. Braun Melsungen AG
- Conkin surgical instruments ltd
- CONMED Corporation
- Cooper Companies, Inc.
- fortimedix surgical b.v.
- Johnson & Johnson
- KARL STORZ GmbH & Co. KG
- Laborie, Inc
- Medtronic plc
- Richard Wolf GmbH
TABLE OF CONTENTS
CHAPTER 1: INTRODUCTION
- 1.1. Report description
- 1.2. Key market segments
- 1.3. Key benefits to the stakeholders
- 1.4. Research Methodology
- 1.4.1. Primary research
- 1.4.2. Secondary research
- 1.4.3. Analyst tools and models
CHAPTER 2: EXECUTIVE SUMMARY
- 2.1. CXO Perspective
CHAPTER 3: MARKET OVERVIEW
- 3.1. Market definition and scope
- 3.2. Key findings
- 3.2.1. Top impacting factors
- 3.2.2. Top investment pockets
- 3.3. Porter's five forces analysis
- 3.3.1. Moderate threat of substitutes
- 3.3.2. Moderate intensity of rivalry
- 3.3.3. High bargaining power of buyers
- 3.3.4. High bargaining power of suppliers
- 3.3.5. Moderate threat of new entrants
- 3.4. Market dynamics
- 3.4.1. Drivers
- 3.4.1.1. Rise in prevalence of uterine cancer
- 3.4.1.2. Increase in awareness of women's health
- 3.4.1.3. Technological advancements in hysterectomy devices
- 3.4.1. Drivers
- 3.4.2. Restraints
- 3.4.2.1. Availability of alternative treatments
- 3.4.3. Opportunities
- 3.4.3.1. Increase in demand for the minimally invasive procedures
- 3.5. COVID-19 Impact Analysis on the market
CHAPTER 4: HYSTERECTOMY DEVICE MARKET, BY DISEASE TYPE
- 4.1. Overview
- 4.1.1. Market size and forecast
- 4.2. Uterine Cancer
- 4.2.1. Key market trends, growth factors and opportunities
- 4.2.2. Market size and forecast, by region
- 4.2.3. Market share analysis by country
- 4.3. Fibroids
- 4.3.1. Key market trends, growth factors and opportunities
- 4.3.2. Market size and forecast, by region
- 4.3.3. Market share analysis by country
- 4.4. Chronic pelvic pain
- 4.4.1. Key market trends, growth factors and opportunities
- 4.4.2. Market size and forecast, by region
- 4.4.3. Market share analysis by country
- 4.5. Others
- 4.5.1. Key market trends, growth factors and opportunities
- 4.5.2. Market size and forecast, by region
- 4.5.3. Market share analysis by country
CHAPTER 5: HYSTERECTOMY DEVICE MARKET, BY SURGICAL APPROACH
- 5.1. Overview
- 5.1.1. Market size and forecast
- 5.2. Vaginal hysterectomy
- 5.2.1. Key market trends, growth factors and opportunities
- 5.2.2. Market size and forecast, by region
- 5.2.3. Market share analysis by country
- 5.3. Laparoscopic hysterectomy
- 5.3.1. Key market trends, growth factors and opportunities
- 5.3.2. Market size and forecast, by region
- 5.3.3. Market share analysis by country
- 5.4. Robotic assisted laparoscopic hysterectomy
- 5.4.1. Key market trends, growth factors and opportunities
- 5.4.2. Market size and forecast, by region
- 5.4.3. Market share analysis by country
- 5.5. Abdominal hysterectomy
- 5.5.1. Key market trends, growth factors and opportunities
- 5.5.2. Market size and forecast, by region
- 5.5.3. Market share analysis by country
CHAPTER 6: HYSTERECTOMY DEVICE MARKET, BY END USER
- 6.1. Overview
- 6.1.1. Market size and forecast
- 6.2. Hospitals
- 6.2.1. Key market trends, growth factors and opportunities
- 6.2.2. Market size and forecast, by region
- 6.2.3. Market share analysis by country
- 6.3. Ambulatory Surgical Centers
- 6.3.1. Key market trends, growth factors and opportunities
- 6.3.2. Market size and forecast, by region
- 6.3.3. Market share analysis by country
- 6.4. Others
- 6.4.1. Key market trends, growth factors and opportunities
- 6.4.2. Market size and forecast, by region
- 6.4.3. Market share analysis by country
CHAPTER 7: HYSTERECTOMY DEVICE MARKET, BY REGION
- 7.1. Overview
- 7.1.1. Market size and forecast By Region
- 7.2. North America
- 7.2.1. Key trends and opportunities
- 7.2.2. Market size and forecast, by Disease type
- 7.2.3. Market size and forecast, by Surgical approach
- 7.2.4. Market size and forecast, by End User
- 7.2.5. Market size and forecast, by country
- 7.2.5.1. U.S.
- 7.2.5.1.1. Key market trends, growth factors and opportunities
- 7.2.5.1.2. Market size and forecast, by Disease type
- 7.2.5.1.3. Market size and forecast, by Surgical approach
- 7.2.5.1.4. Market size and forecast, by End User
- 7.2.5.2. Canada
- 7.2.5.2.1. Key market trends, growth factors and opportunities
- 7.2.5.2.2. Market size and forecast, by Disease type
- 7.2.5.2.3. Market size and forecast, by Surgical approach
- 7.2.5.2.4. Market size and forecast, by End User
- 7.2.5.3. Mexico
- 7.2.5.3.1. Key market trends, growth factors and opportunities
- 7.2.5.3.2. Market size and forecast, by Disease type
- 7.2.5.3.3. Market size and forecast, by Surgical approach
- 7.2.5.3.4. Market size and forecast, by End User
- 7.3. Europe
- 7.3.1. Key trends and opportunities
- 7.3.2. Market size and forecast, by Disease type
- 7.3.3. Market size and forecast, by Surgical approach
- 7.3.4. Market size and forecast, by End User
- 7.3.5. Market size and forecast, by country
- 7.3.5.1. Germany
- 7.3.5.1.1. Key market trends, growth factors and opportunities
- 7.3.5.1.2. Market size and forecast, by Disease type
- 7.3.5.1.3. Market size and forecast, by Surgical approach
- 7.3.5.1.4. Market size and forecast, by End User
- 7.3.5.2. France
- 7.3.5.2.1. Key market trends, growth factors and opportunities
- 7.3.5.2.2. Market size and forecast, by Disease type
- 7.3.5.2.3. Market size and forecast, by Surgical approach
- 7.3.5.2.4. Market size and forecast, by End User
- 7.3.5.3. UK
- 7.3.5.3.1. Key market trends, growth factors and opportunities
- 7.3.5.3.2. Market size and forecast, by Disease type
- 7.3.5.3.3. Market size and forecast, by Surgical approach
- 7.3.5.3.4. Market size and forecast, by End User
- 7.3.5.4. Italy
- 7.3.5.4.1. Key market trends, growth factors and opportunities
- 7.3.5.4.2. Market size and forecast, by Disease type
- 7.3.5.4.3. Market size and forecast, by Surgical approach
- 7.3.5.4.4. Market size and forecast, by End User
- 7.3.5.5. Spain
- 7.3.5.5.1. Key market trends, growth factors and opportunities
- 7.3.5.5.2. Market size and forecast, by Disease type
- 7.3.5.5.3. Market size and forecast, by Surgical approach
- 7.3.5.5.4. Market size and forecast, by End User
- 7.3.5.6. Rest of Europe
- 7.3.5.6.1. Key market trends, growth factors and opportunities
- 7.3.5.6.2. Market size and forecast, by Disease type
- 7.3.5.6.3. Market size and forecast, by Surgical approach
- 7.3.5.6.4. Market size and forecast, by End User
- 7.4. Asia-Pacific
- 7.4.1. Key trends and opportunities
- 7.4.2. Market size and forecast, by Disease type
- 7.4.3. Market size and forecast, by Surgical approach
- 7.4.4. Market size and forecast, by End User
- 7.4.5. Market size and forecast, by country
- 7.4.5.1. Japan
- 7.4.5.1.1. Key market trends, growth factors and opportunities
- 7.4.5.1.2. Market size and forecast, by Disease type
- 7.4.5.1.3. Market size and forecast, by Surgical approach
- 7.4.5.1.4. Market size and forecast, by End User
- 7.4.5.2. China
- 7.4.5.2.1. Key market trends, growth factors and opportunities
- 7.4.5.2.2. Market size and forecast, by Disease type
- 7.4.5.2.3. Market size and forecast, by Surgical approach
- 7.4.5.2.4. Market size and forecast, by End User
- 7.4.5.3. India
- 7.4.5.3.1. Key market trends, growth factors and opportunities
- 7.4.5.3.2. Market size and forecast, by Disease type
- 7.4.5.3.3. Market size and forecast, by Surgical approach
- 7.4.5.3.4. Market size and forecast, by End User
- 7.4.5.4. Australia
- 7.4.5.4.1. Key market trends, growth factors and opportunities
- 7.4.5.4.2. Market size and forecast, by Disease type
- 7.4.5.4.3. Market size and forecast, by Surgical approach
- 7.4.5.4.4. Market size and forecast, by End User
- 7.4.5.5. South Korea
- 7.4.5.5.1. Key market trends, growth factors and opportunities
- 7.4.5.5.2. Market size and forecast, by Disease type
- 7.4.5.5.3. Market size and forecast, by Surgical approach
- 7.4.5.5.4. Market size and forecast, by End User
- 7.4.5.6. Rest of Asia-Pacific
- 7.4.5.6.1. Key market trends, growth factors and opportunities
- 7.4.5.6.2. Market size and forecast, by Disease type
- 7.4.5.6.3. Market size and forecast, by Surgical approach
- 7.4.5.6.4. Market size and forecast, by End User
- 7.5. LAMEA
- 7.5.1. Key trends and opportunities
- 7.5.2. Market size and forecast, by Disease type
- 7.5.3. Market size and forecast, by Surgical approach
- 7.5.4. Market size and forecast, by End User
- 7.5.5. Market size and forecast, by country
- 7.5.5.1. Brazil
- 7.5.5.1.1. Key market trends, growth factors and opportunities
- 7.5.5.1.2. Market size and forecast, by Disease type
- 7.5.5.1.3. Market size and forecast, by Surgical approach
- 7.5.5.1.4. Market size and forecast, by End User
- 7.5.5.2. Saudi Arabia
- 7.5.5.2.1. Key market trends, growth factors and opportunities
- 7.5.5.2.2. Market size and forecast, by Disease type
- 7.5.5.2.3. Market size and forecast, by Surgical approach
- 7.5.5.2.4. Market size and forecast, by End User
- 7.5.5.3. South Africa
- 7.5.5.3.1. Key market trends, growth factors and opportunities
- 7.5.5.3.2. Market size and forecast, by Disease type
- 7.5.5.3.3. Market size and forecast, by Surgical approach
- 7.5.5.3.4. Market size and forecast, by End User
- 7.5.5.4. Rest of LAMEA
- 7.5.5.4.1. Key market trends, growth factors and opportunities
- 7.5.5.4.2. Market size and forecast, by Disease type
- 7.5.5.4.3. Market size and forecast, by Surgical approach
- 7.5.5.4.4. Market size and forecast, by End User
CHAPTER 8: COMPETITIVE LANDSCAPE
- 8.1. Introduction
- 8.2. Top winning strategies
- 8.3. Product Mapping of Top 10 Player
- 8.4. Competitive Dashboard
- 8.5. Competitive Heatmap
- 8.6. Top player positioning, 2021
CHAPTER 9: COMPANY PROFILES
- 9.1. Conkin surgical instruments ltd
- 9.1.1. Company overview
- 9.1.2. Key Executives
- 9.1.3. Company snapshot
- 9.1.4. Operating business segments
- 9.1.5. Product portfolio
- 9.2. KARL STORZ GmbH & Co. KG
- 9.2.1. Company overview
- 9.2.2. Key Executives
- 9.2.3. Company snapshot
- 9.2.4. Operating business segments
- 9.2.5. Product portfolio
- 9.3. CONMED Corporation
- 9.3.1. Company overview
- 9.3.2. Key Executives
- 9.3.3. Company snapshot
- 9.3.4. Operating business segments
- 9.3.5. Product portfolio
- 9.3.6. Business performance
- 9.4. Richard Wolf GmbH
- 9.4.1. Company overview
- 9.4.2. Key Executives
- 9.4.3. Company snapshot
- 9.4.4. Operating business segments
- 9.4.5. Product portfolio
- 9.5. fortimedix surgical b.v.
- 9.5.1. Company overview
- 9.5.2. Key Executives
- 9.5.3. Company snapshot
- 9.5.4. Operating business segments
- 9.5.5. Product portfolio
- 9.6. Johnson & Johnson
- 9.6.1. Company overview
- 9.6.2. Key Executives
- 9.6.3. Company snapshot
- 9.6.4. Operating business segments
- 9.6.5. Product portfolio
- 9.6.6. Business performance
- 9.7. Laborie, Inc
- 9.7.1. Company overview
- 9.7.2. Key Executives
- 9.7.3. Company snapshot
- 9.7.4. Operating business segments
- 9.7.5. Product portfolio
- 9.8. Cooper Companies, Inc.
- 9.8.1. Company overview
- 9.8.2. Key Executives
- 9.8.3. Company snapshot
- 9.8.4. Operating business segments
- 9.8.5. Product portfolio
- 9.8.6. Business performance
- 9.8.7. Key strategic moves and developments
- 9.9. B. Braun Melsungen AG
- 9.9.1. Company overview
- 9.9.2. Key Executives
- 9.9.3. Company snapshot
- 9.9.4. Operating business segments
- 9.9.5. Product portfolio
- 9.9.6. Business performance
- 9.10. Medtronic plc
- 9.10.1. Company overview
- 9.10.2. Key Executives
- 9.10.3. Company snapshot
- 9.10.4. Operating business segments
- 9.10.5. Product portfolio
- 9.10.6. Business performance
LIST OF TABLES
- TABLE 01. GLOBAL HYSTERECTOMY DEVICE MARKET, BY DISEASE TYPE, 2021-2031 ($MILLION)
- TABLE 02. HYSTERECTOMY DEVICE MARKET FOR UTERINE CANCER, BY REGION, 2021-2031 ($MILLION)
- TABLE 03. HYSTERECTOMY DEVICE MARKET FOR FIBROIDS, BY REGION, 2021-2031 ($MILLION)
- TABLE 04. HYSTERECTOMY DEVICE MARKET FOR CHRONIC PELVIC PAIN, BY REGION, 2021-2031 ($MILLION)
- TABLE 05. HYSTERECTOMY DEVICE MARKET FOR OTHERS, BY REGION, 2021-2031 ($MILLION)
- TABLE 06. GLOBAL HYSTERECTOMY DEVICE MARKET, BY SURGICAL APPROACH, 2021-2031 ($MILLION)
- TABLE 07. HYSTERECTOMY DEVICE MARKET FOR VAGINAL HYSTERECTOMY, BY REGION, 2021-2031 ($MILLION)
- TABLE 08. HYSTERECTOMY DEVICE MARKET FOR LAPAROSCOPIC HYSTERECTOMY, BY REGION, 2021-2031 ($MILLION)
- TABLE 09. HYSTERECTOMY DEVICE MARKET FOR ROBOTIC ASSISTED LAPAROSCOPIC HYSTERECTOMY, BY REGION, 2021-2031 ($MILLION)
- TABLE 10. HYSTERECTOMY DEVICE MARKET FOR ABDOMINAL HYSTERECTOMY, BY REGION, 2021-2031 ($MILLION)
- TABLE 11. GLOBAL HYSTERECTOMY DEVICE MARKET, BY END USER, 2021-2031 ($MILLION)
- TABLE 12. HYSTERECTOMY DEVICE MARKET FOR HOSPITALS, BY REGION, 2021-2031 ($MILLION)
- TABLE 13. HYSTERECTOMY DEVICE MARKET FOR AMBULATORY SURGICAL CENTERS, BY REGION, 2021-2031 ($MILLION)
- TABLE 14. HYSTERECTOMY DEVICE MARKET FOR OTHERS, BY REGION, 2021-2031 ($MILLION)
- TABLE 15. HYSTERECTOMY DEVICE MARKET, BY REGION, 2021-2031 ($MILLION)
- TABLE 16. NORTH AMERICA HYSTERECTOMY DEVICE MARKET, BY DISEASE TYPE, 2021-2031 ($MILLION)
- TABLE 17. NORTH AMERICA HYSTERECTOMY DEVICE MARKET, BY SURGICAL APPROACH, 2021-2031 ($MILLION)
- TABLE 18. NORTH AMERICA HYSTERECTOMY DEVICE MARKET, BY END USER, 2021-2031 ($MILLION)
- TABLE 19. NORTH AMERICA HYSTERECTOMY DEVICE MARKET, BY COUNTRY, 2021-2031 ($MILLION)
- TABLE 20. U.S. HYSTERECTOMY DEVICE MARKET, BY DISEASE TYPE, 2021-2031 ($MILLION)
- TABLE 21. U.S. HYSTERECTOMY DEVICE MARKET, BY SURGICAL APPROACH, 2021-2031 ($MILLION)
- TABLE 22. U.S. HYSTERECTOMY DEVICE MARKET, BY END USER, 2021-2031 ($MILLION)
- TABLE 23. CANADA HYSTERECTOMY DEVICE MARKET, BY DISEASE TYPE, 2021-2031 ($MILLION)
- TABLE 24. CANADA HYSTERECTOMY DEVICE MARKET, BY SURGICAL APPROACH, 2021-2031 ($MILLION)
- TABLE 25. CANADA HYSTERECTOMY DEVICE MARKET, BY END USER, 2021-2031 ($MILLION)
- TABLE 26. MEXICO HYSTERECTOMY DEVICE MARKET, BY DISEASE TYPE, 2021-2031 ($MILLION)
- TABLE 27. MEXICO HYSTERECTOMY DEVICE MARKET, BY SURGICAL APPROACH, 2021-2031 ($MILLION)
- TABLE 28. MEXICO HYSTERECTOMY DEVICE MARKET, BY END USER, 2021-2031 ($MILLION)
- TABLE 29. EUROPE HYSTERECTOMY DEVICE MARKET, BY DISEASE TYPE, 2021-2031 ($MILLION)
- TABLE 30. EUROPE HYSTERECTOMY DEVICE MARKET, BY SURGICAL APPROACH, 2021-2031 ($MILLION)
- TABLE 31. EUROPE HYSTERECTOMY DEVICE MARKET, BY END USER, 2021-2031 ($MILLION)
- TABLE 32. EUROPE HYSTERECTOMY DEVICE MARKET, BY COUNTRY, 2021-2031 ($MILLION)
- TABLE 33. GERMANY HYSTERECTOMY DEVICE MARKET, BY DISEASE TYPE, 2021-2031 ($MILLION)
- TABLE 34. GERMANY HYSTERECTOMY DEVICE MARKET, BY SURGICAL APPROACH, 2021-2031 ($MILLION)
- TABLE 35. GERMANY HYSTERECTOMY DEVICE MARKET, BY END USER, 2021-2031 ($MILLION)
- TABLE 36. FRANCE HYSTERECTOMY DEVICE MARKET, BY DISEASE TYPE, 2021-2031 ($MILLION)
- TABLE 37. FRANCE HYSTERECTOMY DEVICE MARKET, BY SURGICAL APPROACH, 2021-2031 ($MILLION)
- TABLE 38. FRANCE HYSTERECTOMY DEVICE MARKET, BY END USER, 2021-2031 ($MILLION)
- TABLE 39. UK HYSTERECTOMY DEVICE MARKET, BY DISEASE TYPE, 2021-2031 ($MILLION)
- TABLE 40. UK HYSTERECTOMY DEVICE MARKET, BY SURGICAL APPROACH, 2021-2031 ($MILLION)
- TABLE 41. UK HYSTERECTOMY DEVICE MARKET, BY END USER, 2021-2031 ($MILLION)
- TABLE 42. ITALY HYSTERECTOMY DEVICE MARKET, BY DISEASE TYPE, 2021-2031 ($MILLION)
- TABLE 43. ITALY HYSTERECTOMY DEVICE MARKET, BY SURGICAL APPROACH, 2021-2031 ($MILLION)
- TABLE 44. ITALY HYSTERECTOMY DEVICE MARKET, BY END USER, 2021-2031 ($MILLION)
- TABLE 45. SPAIN HYSTERECTOMY DEVICE MARKET, BY DISEASE TYPE, 2021-2031 ($MILLION)
- TABLE 46. SPAIN HYSTERECTOMY DEVICE MARKET, BY SURGICAL APPROACH, 2021-2031 ($MILLION)
- TABLE 47. SPAIN HYSTERECTOMY DEVICE MARKET, BY END USER, 2021-2031 ($MILLION)
- TABLE 48. REST OF EUROPE HYSTERECTOMY DEVICE MARKET, BY DISEASE TYPE, 2021-2031 ($MILLION)
- TABLE 49. REST OF EUROPE HYSTERECTOMY DEVICE MARKET, BY SURGICAL APPROACH, 2021-2031 ($MILLION)
- TABLE 50. REST OF EUROPE HYSTERECTOMY DEVICE MARKET, BY END USER, 2021-2031 ($MILLION)
- TABLE 51. ASIA-PACIFIC HYSTERECTOMY DEVICE MARKET, BY DISEASE TYPE, 2021-2031 ($MILLION)
- TABLE 52. ASIA-PACIFIC HYSTERECTOMY DEVICE MARKET, BY SURGICAL APPROACH, 2021-2031 ($MILLION)
- TABLE 53. ASIA-PACIFIC HYSTERECTOMY DEVICE MARKET, BY END USER, 2021-2031 ($MILLION)
- TABLE 54. ASIA-PACIFIC HYSTERECTOMY DEVICE MARKET, BY COUNTRY, 2021-2031 ($MILLION)
- TABLE 55. JAPAN HYSTERECTOMY DEVICE MARKET, BY DISEASE TYPE, 2021-2031 ($MILLION)
- TABLE 56. JAPAN HYSTERECTOMY DEVICE MARKET, BY SURGICAL APPROACH, 2021-2031 ($MILLION)
- TABLE 57. JAPAN HYSTERECTOMY DEVICE MARKET, BY END USER, 2021-2031 ($MILLION)
- TABLE 58. CHINA HYSTERECTOMY DEVICE MARKET, BY DISEASE TYPE, 2021-2031 ($MILLION)
- TABLE 59. CHINA HYSTERECTOMY DEVICE MARKET, BY SURGICAL APPROACH, 2021-2031 ($MILLION)
- TABLE 60. CHINA HYSTERECTOMY DEVICE MARKET, BY END USER, 2021-2031 ($MILLION)
- TABLE 61. INDIA HYSTERECTOMY DEVICE MARKET, BY DISEASE TYPE, 2021-2031 ($MILLION)
- TABLE 62. INDIA HYSTERECTOMY DEVICE MARKET, BY SURGICAL APPROACH, 2021-2031 ($MILLION)
- TABLE 63. INDIA HYSTERECTOMY DEVICE MARKET, BY END USER, 2021-2031 ($MILLION)
- TABLE 64. AUSTRALIA HYSTERECTOMY DEVICE MARKET, BY DISEASE TYPE, 2021-2031 ($MILLION)
- TABLE 65. AUSTRALIA HYSTERECTOMY DEVICE MARKET, BY SURGICAL APPROACH, 2021-2031 ($MILLION)
- TABLE 66. AUSTRALIA HYSTERECTOMY DEVICE MARKET, BY END USER, 2021-2031 ($MILLION)
- TABLE 67. SOUTH KOREA HYSTERECTOMY DEVICE MARKET, BY DISEASE TYPE, 2021-2031 ($MILLION)
- TABLE 68. SOUTH KOREA HYSTERECTOMY DEVICE MARKET, BY SURGICAL APPROACH, 2021-2031 ($MILLION)
- TABLE 69. SOUTH KOREA HYSTERECTOMY DEVICE MARKET, BY END USER, 2021-2031 ($MILLION)
- TABLE 70. REST OF ASIA-PACIFIC HYSTERECTOMY DEVICE MARKET, BY DISEASE TYPE, 2021-2031 ($MILLION)
- TABLE 71. REST OF ASIA-PACIFIC HYSTERECTOMY DEVICE MARKET, BY SURGICAL APPROACH, 2021-2031 ($MILLION)
- TABLE 72. REST OF ASIA-PACIFIC HYSTERECTOMY DEVICE MARKET, BY END USER, 2021-2031 ($MILLION)
- TABLE 73. LAMEA HYSTERECTOMY DEVICE MARKET, BY DISEASE TYPE, 2021-2031 ($MILLION)
- TABLE 74. LAMEA HYSTERECTOMY DEVICE MARKET, BY SURGICAL APPROACH, 2021-2031 ($MILLION)
- TABLE 75. LAMEA HYSTERECTOMY DEVICE MARKET, BY END USER, 2021-2031 ($MILLION)
- TABLE 76. LAMEA HYSTERECTOMY DEVICE MARKET, BY COUNTRY, 2021-2031 ($MILLION)
- TABLE 77. BRAZIL HYSTERECTOMY DEVICE MARKET, BY DISEASE TYPE, 2021-2031 ($MILLION)
- TABLE 78. BRAZIL HYSTERECTOMY DEVICE MARKET, BY SURGICAL APPROACH, 2021-2031 ($MILLION)
- TABLE 79. BRAZIL HYSTERECTOMY DEVICE MARKET, BY END USER, 2021-2031 ($MILLION)
- TABLE 80. SAUDI ARABIA HYSTERECTOMY DEVICE MARKET, BY DISEASE TYPE, 2021-2031 ($MILLION)
- TABLE 81. SAUDI ARABIA HYSTERECTOMY DEVICE MARKET, BY SURGICAL APPROACH, 2021-2031 ($MILLION)
- TABLE 82. SAUDI ARABIA HYSTERECTOMY DEVICE MARKET, BY END USER, 2021-2031 ($MILLION)
- TABLE 83. SOUTH AFRICA HYSTERECTOMY DEVICE MARKET, BY DISEASE TYPE, 2021-2031 ($MILLION)
- TABLE 84. SOUTH AFRICA HYSTERECTOMY DEVICE MARKET, BY SURGICAL APPROACH, 2021-2031 ($MILLION)
- TABLE 85. SOUTH AFRICA HYSTERECTOMY DEVICE MARKET, BY END USER, 2021-2031 ($MILLION)
- TABLE 86. REST OF LAMEA HYSTERECTOMY DEVICE MARKET, BY DISEASE TYPE, 2021-2031 ($MILLION)
- TABLE 87. REST OF LAMEA HYSTERECTOMY DEVICE MARKET, BY SURGICAL APPROACH, 2021-2031 ($MILLION)
- TABLE 88. REST OF LAMEA HYSTERECTOMY DEVICE MARKET, BY END USER, 2021-2031 ($MILLION)
- TABLE 89. CONKIN SURGICAL INSTRUMENTS LTD: KEY EXECUTIVES
- TABLE 90. CONKIN SURGICAL INSTRUMENTS LTD: COMPANY SNAPSHOT
- TABLE 91. CONKIN SURGICAL INSTRUMENTS LTD: PRODUCT SEGMENTS
- TABLE 92. CONKIN SURGICAL INSTRUMENTS LTD: PRODUCT PORTFOLIO
- TABLE 93. KARL STORZ GMBH & CO. KG: KEY EXECUTIVES
- TABLE 94. KARL STORZ GMBH & CO. KG: COMPANY SNAPSHOT
- TABLE 95. KARL STORZ GMBH & CO. KG: PRODUCT SEGMENTS
- TABLE 96. KARL STORZ GMBH & CO. KG: PRODUCT PORTFOLIO
- TABLE 97. CONMED CORPORATION: KEY EXECUTIVES
- TABLE 98. CONMED CORPORATION: COMPANY SNAPSHOT
- TABLE 99. CONMED CORPORATION: PRODUCT SEGMENTS
- TABLE 100. CONMED CORPORATION: PRODUCT PORTFOLIO
- TABLE 101. RICHARD WOLF GMBH: KEY EXECUTIVES
- TABLE 102. RICHARD WOLF GMBH: COMPANY SNAPSHOT
- TABLE 103. RICHARD WOLF GMBH: PRODUCT SEGMENTS
- TABLE 104. RICHARD WOLF GMBH: PRODUCT PORTFOLIO
- TABLE 105. FORTIMEDIX SURGICAL B.V.: KEY EXECUTIVES
- TABLE 106. FORTIMEDIX SURGICAL B.V.: COMPANY SNAPSHOT
- TABLE 107. FORTIMEDIX SURGICAL B.V.: PRODUCT SEGMENTS
- TABLE 108. FORTIMEDIX SURGICAL B.V.: PRODUCT PORTFOLIO
- TABLE 109. JOHNSON & JOHNSON: KEY EXECUTIVES
- TABLE 110. JOHNSON & JOHNSON: COMPANY SNAPSHOT
- TABLE 111. JOHNSON & JOHNSON: PRODUCT SEGMENTS
- TABLE 112. JOHNSON & JOHNSON: PRODUCT PORTFOLIO
- TABLE 113. LABORIE, INC: KEY EXECUTIVES
- TABLE 114. LABORIE, INC: COMPANY SNAPSHOT
- TABLE 115. LABORIE, INC: PRODUCT SEGMENTS
- TABLE 116. LABORIE, INC: PRODUCT PORTFOLIO
- TABLE 117. COOPER COMPANIES, INC.: KEY EXECUTIVES
- TABLE 118. COOPER COMPANIES, INC.: COMPANY SNAPSHOT
- TABLE 119. COOPER COMPANIES, INC.: PRODUCT SEGMENTS
- TABLE 120. COOPER COMPANIES, INC.: PRODUCT PORTFOLIO
- TABLE 121. COOPER COMPANIES, INC.: KEY STRATERGIES
- TABLE 122. B. BRAUN MELSUNGEN AG: KEY EXECUTIVES
- TABLE 123. B. BRAUN MELSUNGEN AG: COMPANY SNAPSHOT
- TABLE 124. B. BRAUN MELSUNGEN AG: PRODUCT SEGMENTS
- TABLE 125. B. BRAUN MELSUNGEN AG: PRODUCT PORTFOLIO
- TABLE 126. MEDTRONIC PLC: KEY EXECUTIVES
- TABLE 127. MEDTRONIC PLC: COMPANY SNAPSHOT
- TABLE 128. MEDTRONIC PLC: PRODUCT SEGMENTS
- TABLE 129. MEDTRONIC PLC: PRODUCT PORTFOLIO
LIST OF FIGURES
- FIGURE 01. HYSTERECTOMY DEVICE MARKET, 2021-2031
- FIGURE 02. SEGMENTATION OF HYSTERECTOMY DEVICE MARKET, 2021-2031
- FIGURE 03. HYSTERECTOMY DEVICE MARKET,2021-2031
- FIGURE 04. TOP INVESTMENT POCKETS IN HYSTERECTOMY DEVICE MARKET (2022-2031)
- FIGURE 05. MODERATE THREAT OF SUBSTITUTES
- FIGURE 06. MODERATE INTENSITY OF RIVALRY
- FIGURE 07. HIGH BARGAINING POWER OF BUYERS
- FIGURE 08. HIGH BARGAINING POWER OF SUPPLIERS
- FIGURE 09. MODERATE THREAT OF NEW ENTRANTS
- FIGURE 10. GLOBAL HYSTERECTOMY DEVICE MARKET:DRIVERS, RESTRAINTS AND OPPORTUNITIES
- FIGURE 11. HYSTERECTOMY DEVICE MARKET, BY DISEASE TYPE, 2021(%)
- FIGURE 12. COMPARATIVE SHARE ANALYSIS OF HYSTERECTOMY DEVICE MARKET FOR UTERINE CANCER, BY COUNTRY 2021 AND 2031(%)
- FIGURE 13. COMPARATIVE SHARE ANALYSIS OF HYSTERECTOMY DEVICE MARKET FOR FIBROIDS, BY COUNTRY 2021 AND 2031(%)
- FIGURE 14. COMPARATIVE SHARE ANALYSIS OF HYSTERECTOMY DEVICE MARKET FOR CHRONIC PELVIC PAIN, BY COUNTRY 2021 AND 2031(%)
- FIGURE 15. COMPARATIVE SHARE ANALYSIS OF HYSTERECTOMY DEVICE MARKET FOR OTHERS, BY COUNTRY 2021 AND 2031(%)
- FIGURE 16. HYSTERECTOMY DEVICE MARKET, BY SURGICAL APPROACH, 2021(%)
- FIGURE 17. COMPARATIVE SHARE ANALYSIS OF HYSTERECTOMY DEVICE MARKET FOR VAGINAL HYSTERECTOMY, BY COUNTRY 2021 AND 2031(%)
- FIGURE 18. COMPARATIVE SHARE ANALYSIS OF HYSTERECTOMY DEVICE MARKET FOR LAPAROSCOPIC HYSTERECTOMY, BY COUNTRY 2021 AND 2031(%)
- FIGURE 19. COMPARATIVE SHARE ANALYSIS OF HYSTERECTOMY DEVICE MARKET FOR ROBOTIC ASSISTED LAPAROSCOPIC HYSTERECTOMY, BY COUNTRY 2021 AND 2031(%)
- FIGURE 20. COMPARATIVE SHARE ANALYSIS OF HYSTERECTOMY DEVICE MARKET FOR ABDOMINAL HYSTERECTOMY, BY COUNTRY 2021 AND 2031(%)
- FIGURE 21. HYSTERECTOMY DEVICE MARKET, BY END USER, 2021(%)
- FIGURE 22. COMPARATIVE SHARE ANALYSIS OF HYSTERECTOMY DEVICE MARKET FOR HOSPITALS, BY COUNTRY 2021 AND 2031(%)
- FIGURE 23. COMPARATIVE SHARE ANALYSIS OF HYSTERECTOMY DEVICE MARKET FOR AMBULATORY SURGICAL CENTERS, BY COUNTRY 2021 AND 2031(%)
- FIGURE 24. COMPARATIVE SHARE ANALYSIS OF HYSTERECTOMY DEVICE MARKET FOR OTHERS, BY COUNTRY 2021 AND 2031(%)
- FIGURE 25. HYSTERECTOMY DEVICE MARKET BY REGION, 2021
- FIGURE 26. U.S. HYSTERECTOMY DEVICE MARKET, 2021-2031 ($MILLION)
- FIGURE 27. CANADA HYSTERECTOMY DEVICE MARKET, 2021-2031 ($MILLION)
- FIGURE 28. MEXICO HYSTERECTOMY DEVICE MARKET, 2021-2031 ($MILLION)
- FIGURE 29. GERMANY HYSTERECTOMY DEVICE MARKET, 2021-2031 ($MILLION)
- FIGURE 30. FRANCE HYSTERECTOMY DEVICE MARKET, 2021-2031 ($MILLION)
- FIGURE 31. UK HYSTERECTOMY DEVICE MARKET, 2021-2031 ($MILLION)
- FIGURE 32. ITALY HYSTERECTOMY DEVICE MARKET, 2021-2031 ($MILLION)
- FIGURE 33. SPAIN HYSTERECTOMY DEVICE MARKET, 2021-2031 ($MILLION)
- FIGURE 34. REST OF EUROPE HYSTERECTOMY DEVICE MARKET, 2021-2031 ($MILLION)
- FIGURE 35. JAPAN HYSTERECTOMY DEVICE MARKET, 2021-2031 ($MILLION)
- FIGURE 36. CHINA HYSTERECTOMY DEVICE MARKET, 2021-2031 ($MILLION)
- FIGURE 37. INDIA HYSTERECTOMY DEVICE MARKET, 2021-2031 ($MILLION)
- FIGURE 38. AUSTRALIA HYSTERECTOMY DEVICE MARKET, 2021-2031 ($MILLION)
- FIGURE 39. SOUTH KOREA HYSTERECTOMY DEVICE MARKET, 2021-2031 ($MILLION)
- FIGURE 40. REST OF ASIA-PACIFIC HYSTERECTOMY DEVICE MARKET, 2021-2031 ($MILLION)
- FIGURE 41. BRAZIL HYSTERECTOMY DEVICE MARKET, 2021-2031 ($MILLION)
- FIGURE 42. SAUDI ARABIA HYSTERECTOMY DEVICE MARKET, 2021-2031 ($MILLION)
- FIGURE 43. SOUTH AFRICA HYSTERECTOMY DEVICE MARKET, 2021-2031 ($MILLION)
- FIGURE 44. REST OF LAMEA HYSTERECTOMY DEVICE MARKET, 2021-2031 ($MILLION)
- FIGURE 45. TOP WINNING STRATEGIES, BY YEAR
- FIGURE 46. TOP WINNING STRATEGIES, BY DEVELOPMENT
- FIGURE 47. TOP WINNING STRATEGIES, BY COMPANY
- FIGURE 48. PRODUCT MAPPING OF TOP 10 PLAYERS
- FIGURE 49. COMPETITIVE DASHBOARD
- FIGURE 50. COMPETITIVE HEATMAP: HYSTERECTOMY DEVICE MARKET
- FIGURE 51. TOP PLAYER POSITIONING, 2021
- FIGURE 52. CONMED CORPORATION.: NET SALES, 2020-2022 ($MILLION)
- FIGURE 53. CONMED CORPORATION.: REVENUE SHARE BY SEGMENT, 2022 (%)
- FIGURE 54. CONMED CORPORATION.: REVENUE SHARE BY REGION, 2022 (%)
- FIGURE 55. JOHNSON & JOHNSON: NET SALES, 2020-2022 ($MILLION)
- FIGURE 56. JOHNSON & JOHNSON: REVENUE SHARE BY SEGMENT, 2022 (%)
- FIGURE 57. JOHNSON & JOHNSON: REVENUE SHARE BY REGION, 2022 (%)
- FIGURE 58. COOPER COMPANIES, INC.: NET REVENUE, 2020-2022 ($MILLION)
- FIGURE 59. COOPER COMPANIES, INC.: REVENUE SHARE BY SEGMENT, 2022 (%)
- FIGURE 60. B. BRAUN MELSUNGEN AG: NET SALES, 2020-2022 ($MILLION)
- FIGURE 61. B. BRAUN MELSUNGEN AG: REVENUE SHARE BY REGION, 2022 (%)
- FIGURE 62. B. BRAUN MELSUNGEN AG: REVENUE SHARE BY SEGMENT, 2022 (%)
- FIGURE 63. MEDTRONIC PLC: NET SALES, 2020-2022 ($MILLION)
- FIGURE 64. MEDTRONIC PLC: REVENUE SHARE BY SEGMENT, 2022 (%)
- FIGURE 65. MEDTRONIC PLC: REVENUE SHARE BY REGION, 2022 (%)
 子宮腔鏡設備 - 全球市場回顧、競爭格局、市場預測(2030)
 2024 年全球子子宮鏡市場報告
 子宮鏡檢查設備市場:按產品、可用性、最終用戶、應用分類 - 2024-2030 年全球預測
 全球子宮腔鏡器材市場研究報告 - 2023 年至 2030 年產業分析、規模、佔有率、成長、趨勢與預測
 子宮鏡檢查手術市場規模、佔有率和趨勢分析報告:按手術、最終用途、地區、細分市場趨勢,2023-2030 年
 全球宮腔鏡市場 - 2023-2030
 宮腔鏡市場:按類型(診斷、手術)、最終用途(門診手術中心、診所、醫院) - 俄羅斯-烏克蘭衝突和高通貨膨脹 - 全球預測 2023-2030
 金磚國家的子宮切除術市場:各市場區隔(機器人式,非機器人式)手術數量與2030年前的預測
 日本的子宮切除術數量:各市場區隔(機器人支援子宮切除術,非機器人支援子宮切除術),預測(~2030年)
 2022-2028 年全球子宮切除術設備市場規模、份額、行業趨勢分析報告,按疾病類型、最終用戶、手術方法、地區展望和預測