


 |
市場調查報告書
商品編碼
1365765
乾燥劑市場:按類型、最終用途產業:2023-2032 年全球機會分析與產業預測Desiccant Market By Type, By End-use industries : Global Opportunity Analysis and Industry Forecast, 2023-2032 |
||||||
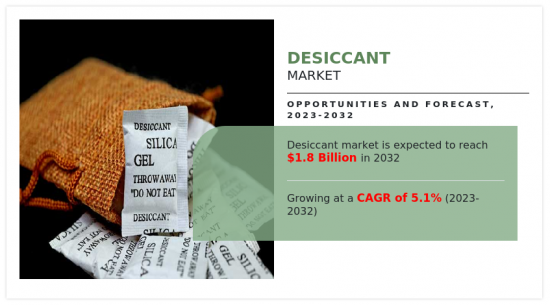
2022年乾燥劑市值為11億美元,預計2023年至2032年年複合成長率為5.1%,到2032年將達到18億美元。
在石油、天然氣工業中,活性氧化鋁用於去除天然氣流中的水分。天然氣被認為是美國成長最快的能源,新煉油廠計畫的建立預計將成為活性氧化鋁的主要促進因素。根據英國石油公司統計,2021年中國石油日產量約400萬桶。中國石油工業由中國海洋石油總公司等國營企業主導。此外,2022年至2024年,中國海洋石油總公司石油、天然氣產量每年將增加6%以上,成為中國能源供應安全的重要參與者。
印度政府實施了各種計劃來滿足日益成長的石油、天然氣需求。它允許許多工業領域100% 的外國直接投資 (FDI),包括天然氣、石油產品和煉油廠。根據國際能源總署(IEA)預測,到 2026 年,全球石油需求預計將達到 104.1 mb/d(百萬桶/日),其中中國和印度約佔該年成長的一半。這預計將貢獻以利於未來的市場拓展。因此,預計活性氧化鋁的需求在預測期內將大幅成長。
為了製造乾燥劑,需要安裝必要的機械,這需要大量的初始投資成本。此外,這些機器需要定期維護,這會增加整體製造成本。因此,阻礙了乾燥劑市場的成長。乾燥劑是從周圍環境吸收水分的物質,因此當它們與人體皮膚接觸時會造成健康風險。因此,處理這些物質時必須格外小心。因此,乾燥劑需要特殊的包裝材料來確保最高的安全性。
由於化學領域和空調行業的需求不斷成長,乾燥劑市場有望利用利潤豐厚的機會。在化學領域,乾燥劑在維持各種化合物的完整性、防止潮濕引起的劣化、確保產品品質和保存期限方面發揮重要作用。此外,空調系統為乾燥劑的利用提供了一個有前景的途徑。乾燥劑是先進空調系統的重要組成部分,可有效去除空氣中多餘的水分並提高冷卻效率。隨著節能環保的空調解決方案普及更加普遍,這些系統對乾燥劑的需求預計將會增加。化學領域的濕度控制需求和不斷成長的空調市場相結合,為乾燥劑行業提供了強勁的成長和創新機會。製造商和相關人員可以做出策略性努力來開拓這種新前景,並進一步推動乾燥劑市場的成長。
目錄
第1章 簡介
第2章 執行摘要
第3章 市場概況
- 市場定義和範圍
- 主要發現
- 影響要素
- 主要投資機會
- 波特五力分析
- 市場動態
- 促進因素
- 製藥業對乾燥劑的需求增加
- 石油、天然氣產業對活性氧化鋁的需求增加
- 抑制因素
- 投資成本高
- 機會
- 化學領域和空調系統中乾燥劑的使用增加
- 促進因素
- 市場佔有率分析
- 價值鏈分析
- 價格分析
- 專利形勢
第4章 乾燥劑市場:依類型
- 概述
- 矽膠
- 活性氧化鋁
- 活性碳
- 沸石
- 氯化鈣
- 黏土
- 其他
第5章 乾燥劑市場:依最終用途產業
- 概述
- 包裝
- 食品
- 藥品
- 電子產品
- 其他
第6章 乾燥劑市場:按地區
- 概述
- 北美洲
- 美國
- 加拿大
- 墨西哥
- 歐洲
- 德國
- 法國
- 英國
- 西班牙
- 義大利
- 其他
- 亞太地區
- 中國
- 日本
- 印度
- 韓國
- 澳洲
- 其他
- 拉丁美洲/中東/非洲
- 巴西
- 沙烏地阿拉伯
- 南非
- 其他
第7章 競爭形勢
- 介紹
- 關鍵成功策略
- 10家主要企業產品圖譜
- 競爭儀表板
- 競爭熱圖
- 2022年主要企業定位
第8章 公司簡介
- Fuji Silysia Chemical Ltd.
- Desicca Chemical Pvt. Ltd.
- TROPACK Packmitel GmbH
- OKER-CHEMIE
- Hengye, Inc.
- Multisorb
- CLARIANT
- Capitol Scientific, Inc.
- WR Grace & Co.-Conn.
- Evonik Industries AG
According to a new report published by Allied Market Research, titled, "Desiccant Market," The desiccant market was valued at $1.1 billion in 2022, and is estimated to reach $1.8 billion by 2032, growing at a CAGR of 5.1% from 2023 to 2032.
In the oil and gas industry, activated alumina is used to eliminate water from natural gas streams. Natural gas is regarded as the fastest-growing energy source in the U.S. The establishment of new refinery initiatives is anticipated to be the primary growth driver for the activated alumina. China produced roughly 4 million barrels of oil per day in 2021, according to BP statistics. State-owned corporations, such as China National Offshore Oil Corp., dominate the China oil industry. In addition, China National Offshore Oil Corporation (CNOOC) oil and gas production increased by more than 6% annually between 2022 and 2024, playing a crucial position in China's energy supply security.
The government of India has implemented a variety of plans to satisfy the rise in demand for oil and gas. It has permitted 100 % foreign direct investment (FDI) in a number of industry segments, including natural gas, petroleum products, and refineries. According to the International Energy Agency, global oil demand is expected to reach 104.1 mb/d (million barrels per day) by 2026, with China and India accounting for approximately half of the growth through that year, thereby contributing to market expansion in the future. Thus, the demand for activated alumina is anticipated to expand substantially during the forecast period.
To manufacture desiccant, it is necessary to set up the necessary machinery, which results in significant initial investment expenses. In addition, regular maintenance of these machines is required, which contributes to an increase in the overall cost of manufacturing. Thus hampering the growth of the desiccant market. Desiccants are substances that draw moisture out of their surroundings and, as a result, provide a health risk if they come into contact with human skin. As a result, handling these substances requires extreme caution. As a consequence of this, particular packaging materials for desiccants are required to guarantee the highest possible level of safety.
The desiccant market is poised to capitalize on lucrative opportunities owing to the rise in demand in the chemical sector and the air conditioning industry. In the chemical sector, desiccants play a crucial role in maintaining the integrity of various chemical compounds and preventing moisture-induced degradation, ensuring product quality and shelf life. In addition, the air conditioning system presents a promising avenue for desiccant utilization. Desiccants are integral components in advanced air conditioning systems, effectively removing excess moisture from the air, and enhancing cooling efficiency. As energy-efficient and eco-friendly air conditioning solutions gain traction, the demand for desiccants in these systems is projected to rise. This dual opportunity, driven by the chemical sector's need for moisture control and the expanding air conditioning market, positions the desiccant industry for robust growth and innovation. Manufacturers and stakeholders can strategically align their efforts to tap into these emerging prospects and further propel the desiccant market growth.
The desiccant market is segmented into type, end-use industry, and region. Depending on the type, the market is divided into silica gel, activated alumina, activated charcoal, zeolite, calcium chloride, clay, and others. On the basis of the end-use industry, it is categorized into packaging, food, pharmaceutical, electronics, and others. Region-wise, the market is studied across North America, Europe, Asia-Pacific, And LAMEA.
The major players operating in the global desiccant market are Fuji Silysia Chemical Ltd., Hengye, Inc., TROPACK Packmitel GmbH, CLARIANT, Capitol Scientific, Inc. Multisorb, OKER-CHEMIE, Evonik Industries AG, Desicca Chemical Pvt. Ltd., and W. R. Grace & Co.-Conn. Other players include Porocel Corporation, The Dow Chemical Company, INEOS Corporation, Qingdao Makll Group, Zeotec Adsorbents Private Limited,AGM Container Controls, Delta Adsorbents, and others.
Key Benefits For Stakeholders
- This report provides a quantitative analysis of the market segments, current trends, estimations, and dynamics of the desiccant market analysis from 2022 to 2032 to identify the prevailing desiccant market opportunities.
- The market research is offered along with information related to key drivers, restraints, and opportunities.
- Porter's five forces analysis highlights the potency of buyers and suppliers to enable stakeholders make profit-oriented business decisions and strengthen their supplier-buyer network.
- In-depth analysis of the desiccant market segmentation assists to determine the prevailing market opportunities.
- Major countries in each region are mapped according to their revenue contribution to the global market.
- Market player positioning facilitates benchmarking and provides a clear understanding of the present position of the market players.
- The report includes the analysis of the regional as well as global desiccant market trends, key players, market segments, application areas, and market growth strategies.
Additional benefits you will get with this purchase are:
- Quarterly Update and* (only available with a corporate license, on listed price)
- 5 additional Company Profile of client Choice pre- or Post-purchase, as a free update.
- Free Upcoming Version on the Purchase of Five and Enterprise User License.
- 16 analyst hours of support* (post-purchase, if you find additional data requirements upon review of the report, you may receive support amounting to 16 analyst hours to solve questions, and post-sale queries)
- 15% Free Customization* (in case the scope or segment of the report does not match your requirements, 20% is equivalent to 3 working days of free work, applicable once)
- Free data Pack on the Five and Enterprise User License. (Excel version of the report)
- Free Updated report if the report is 6-12 months old or older.
- 24-hour priority response*
- Free Industry updates and white papers.
Possible Customization with this report (with additional cost and timeline talk to the sales executive to know more)
- Manufacturing Capacity
- Product Benchmarking / Product specification and applications
- Supply Chain Analysis & Vendor Margins
- Upcoming/New Entrant by Regions
- Technology Trend Analysis
- Distributor margin Analysis
- Market share analysis of players by products/segments
- New Product Development/ Product Matrix of Key Players
- Regulatory Guidelines
- Additional company profiles with specific to client's interest
- Additional country or region analysis- market size and forecast
- Average Selling Price Analysis / Price Point Analysis
- Brands Share Analysis
- Expanded list for Company Profiles
- Historic market data
- Import Export Analysis/Data
- Key player details (including location, contact details, supplier/vendor network etc. in excel format)
- List of customers/consumers/raw material suppliers- value chain analysis
- Market share analysis of players at global/region/country level
- Product Consumption Analysis
- SWOT Analysis
- Volume Market Size and Forecast
Key Market Segments
By Type
- Silica Gel
- Activated Alumina
- Activated Charcoal
- Zeolite
- Calcium Chloride
- Clay
- Others
By End-use industries
- Packaging
- Food
- Pharmaceutical
- Electronics
- Others
By Region
- North America
- U.S.
- Canada
- Mexico
- Europe
- Germany
- France
- UK
- Spain
- Italy
- Rest of Europe
- Asia-Pacific
- China
- Japan
- India
- South Korea
- Australia
- Rest of Asia-Pacific
- LAMEA
- Brazil
- Saudi Arabia
- South Africa
- Rest of LAMEA
Key Market Players:
- Fuji Silysia Chemical Ltd.
- Hengye, Inc.
- TROPACK Packmitel GmbH
- CLARIANT
- Capitol Scientific, Inc.
- Multisorb
- OKER-CHEMIE
- Evonik Industries AG
- Desicca Chemical Pvt. Ltd.
- W. R. Grace & Co.-Conn.
TABLE OF CONTENTS
CHAPTER 1: INTRODUCTION
- 1.1. Report description
- 1.2. Key market segments
- 1.3. Key benefits to the stakeholders
- 1.4. Research Methodology
- 1.4.1. Primary research
- 1.4.2. Secondary research
- 1.4.3. Analyst tools and models
CHAPTER 2: EXECUTIVE SUMMARY
- 2.1. CXO Perspective
CHAPTER 3: MARKET OVERVIEW
- 3.1. Market definition and scope
- 3.2. Key findings
- 3.2.1. Top impacting factors
- 3.2.2. Top investment pockets
- 3.3. Porter's five forces analysis
- 3.3.1. Moderate bargaining power of suppliers
- 3.3.2. Moderate threat of new entrants
- 3.3.3. Moderate threat of substitutes
- 3.3.4. High intensity of rivalry
- 3.3.5. High bargaining power of buyers
- 3.4. Market dynamics
- 3.4.1. Drivers
- 3.4.1.1. Increase in demand for desiccants from the pharmaceutical industry
- 3.4.1.2. Increase in Demand for Activated Alumina from the Oil and Gas Industry
- 3.4.2. Restraints
- 3.4.2.1. High investment costs
- 3.4.3. Opportunities
- 3.4.3.1. Increase in the use of desiccant in the chemical sector and air conditioning system
- 3.4.1. Drivers
- 3.5. Market Share Analysis
- 3.6. Value Chain Analysis
- 3.7. Pricing Analysis
- 3.8. Patent Landscape
CHAPTER 4: DESICCANT MARKET, BY TYPE
- 4.1. Overview
- 4.1.1. Market size and forecast
- 4.2. Silica Gel
- 4.2.1. Key market trends, growth factors and opportunities
- 4.2.2. Market size and forecast, by region
- 4.2.3. Market share analysis by country
- 4.3. Activated Alumina
- 4.3.1. Key market trends, growth factors and opportunities
- 4.3.2. Market size and forecast, by region
- 4.3.3. Market share analysis by country
- 4.4. Activated Charcoal
- 4.4.1. Key market trends, growth factors and opportunities
- 4.4.2. Market size and forecast, by region
- 4.4.3. Market share analysis by country
- 4.5. Zeolite
- 4.5.1. Key market trends, growth factors and opportunities
- 4.5.2. Market size and forecast, by region
- 4.5.3. Market share analysis by country
- 4.6. Calcium Chloride
- 4.6.1. Key market trends, growth factors and opportunities
- 4.6.2. Market size and forecast, by region
- 4.6.3. Market share analysis by country
- 4.7. Clay
- 4.7.1. Key market trends, growth factors and opportunities
- 4.7.2. Market size and forecast, by region
- 4.7.3. Market share analysis by country
- 4.8. Others
- 4.8.1. Key market trends, growth factors and opportunities
- 4.8.2. Market size and forecast, by region
- 4.8.3. Market share analysis by country
CHAPTER 5: DESICCANT MARKET, BY END-USE INDUSTRIES
- 5.1. Overview
- 5.1.1. Market size and forecast
- 5.2. Packaging
- 5.2.1. Key market trends, growth factors and opportunities
- 5.2.2. Market size and forecast, by region
- 5.2.3. Market share analysis by country
- 5.3. Food
- 5.3.1. Key market trends, growth factors and opportunities
- 5.3.2. Market size and forecast, by region
- 5.3.3. Market share analysis by country
- 5.4. Pharmaceutical
- 5.4.1. Key market trends, growth factors and opportunities
- 5.4.2. Market size and forecast, by region
- 5.4.3. Market share analysis by country
- 5.5. Electronics
- 5.5.1. Key market trends, growth factors and opportunities
- 5.5.2. Market size and forecast, by region
- 5.5.3. Market share analysis by country
- 5.6. Others
- 5.6.1. Key market trends, growth factors and opportunities
- 5.6.2. Market size and forecast, by region
- 5.6.3. Market share analysis by country
CHAPTER 6: DESICCANT MARKET, BY REGION
- 6.1. Overview
- 6.1.1. Market size and forecast By Region
- 6.2. North America
- 6.2.1. Key market trends, growth factors and opportunities
- 6.2.2. Market size and forecast, by Type
- 6.2.3. Market size and forecast, by End-use industries
- 6.2.4. Market size and forecast, by country
- 6.2.4.1. U.S.
- 6.2.4.1.1. Market size and forecast, by Type
- 6.2.4.1.2. Market size and forecast, by End-use industries
- 6.2.4.2. Canada
- 6.2.4.2.1. Market size and forecast, by Type
- 6.2.4.2.2. Market size and forecast, by End-use industries
- 6.2.4.3. Mexico
- 6.2.4.3.1. Market size and forecast, by Type
- 6.2.4.3.2. Market size and forecast, by End-use industries
- 6.3. Europe
- 6.3.1. Key market trends, growth factors and opportunities
- 6.3.2. Market size and forecast, by Type
- 6.3.3. Market size and forecast, by End-use industries
- 6.3.4. Market size and forecast, by country
- 6.3.4.1. Germany
- 6.3.4.1.1. Market size and forecast, by Type
- 6.3.4.1.2. Market size and forecast, by End-use industries
- 6.3.4.2. France
- 6.3.4.2.1. Market size and forecast, by Type
- 6.3.4.2.2. Market size and forecast, by End-use industries
- 6.3.4.3. UK
- 6.3.4.3.1. Market size and forecast, by Type
- 6.3.4.3.2. Market size and forecast, by End-use industries
- 6.3.4.4. Spain
- 6.3.4.4.1. Market size and forecast, by Type
- 6.3.4.4.2. Market size and forecast, by End-use industries
- 6.3.4.5. Italy
- 6.3.4.5.1. Market size and forecast, by Type
- 6.3.4.5.2. Market size and forecast, by End-use industries
- 6.3.4.6. Rest of Europe
- 6.3.4.6.1. Market size and forecast, by Type
- 6.3.4.6.2. Market size and forecast, by End-use industries
- 6.4. Asia-Pacific
- 6.4.1. Key market trends, growth factors and opportunities
- 6.4.2. Market size and forecast, by Type
- 6.4.3. Market size and forecast, by End-use industries
- 6.4.4. Market size and forecast, by country
- 6.4.4.1. China
- 6.4.4.1.1. Market size and forecast, by Type
- 6.4.4.1.2. Market size and forecast, by End-use industries
- 6.4.4.2. Japan
- 6.4.4.2.1. Market size and forecast, by Type
- 6.4.4.2.2. Market size and forecast, by End-use industries
- 6.4.4.3. India
- 6.4.4.3.1. Market size and forecast, by Type
- 6.4.4.3.2. Market size and forecast, by End-use industries
- 6.4.4.4. South Korea
- 6.4.4.4.1. Market size and forecast, by Type
- 6.4.4.4.2. Market size and forecast, by End-use industries
- 6.4.4.5. Australia
- 6.4.4.5.1. Market size and forecast, by Type
- 6.4.4.5.2. Market size and forecast, by End-use industries
- 6.4.4.6. Rest of Asia-Pacific
- 6.4.4.6.1. Market size and forecast, by Type
- 6.4.4.6.2. Market size and forecast, by End-use industries
- 6.5. LAMEA
- 6.5.1. Key market trends, growth factors and opportunities
- 6.5.2. Market size and forecast, by Type
- 6.5.3. Market size and forecast, by End-use industries
- 6.5.4. Market size and forecast, by country
- 6.5.4.1. Brazil
- 6.5.4.1.1. Market size and forecast, by Type
- 6.5.4.1.2. Market size and forecast, by End-use industries
- 6.5.4.2. Saudi Arabia
- 6.5.4.2.1. Market size and forecast, by Type
- 6.5.4.2.2. Market size and forecast, by End-use industries
- 6.5.4.3. South Africa
- 6.5.4.3.1. Market size and forecast, by Type
- 6.5.4.3.2. Market size and forecast, by End-use industries
- 6.5.4.4. Rest of LAMEA
- 6.5.4.4.1. Market size and forecast, by Type
- 6.5.4.4.2. Market size and forecast, by End-use industries
CHAPTER 7: COMPETITIVE LANDSCAPE
- 7.1. Introduction
- 7.2. Top winning strategies
- 7.3. Product Mapping of Top 10 Player
- 7.4. Competitive Dashboard
- 7.5. Competitive Heatmap
- 7.6. Top player positioning, 2022
CHAPTER 8: COMPANY PROFILES
- 8.1. Fuji Silysia Chemical Ltd.
- 8.1.1. Company overview
- 8.1.2. Key Executives
- 8.1.3. Company snapshot
- 8.1.4. Operating business segments
- 8.1.5. Product portfolio
- 8.2. Desicca Chemical Pvt. Ltd.
- 8.2.1. Company overview
- 8.2.2. Key Executives
- 8.2.3. Company snapshot
- 8.2.4. Operating business segments
- 8.2.5. Product portfolio
- 8.3. TROPACK Packmitel GmbH
- 8.3.1. Company overview
- 8.3.2. Key Executives
- 8.3.3. Company snapshot
- 8.3.4. Operating business segments
- 8.3.5. Product portfolio
- 8.4. OKER-CHEMIE
- 8.4.1. Company overview
- 8.4.2. Key Executives
- 8.4.3. Company snapshot
- 8.4.4. Operating business segments
- 8.4.5. Product portfolio
- 8.5. Hengye, Inc.
- 8.5.1. Company overview
- 8.5.2. Key Executives
- 8.5.3. Company snapshot
- 8.5.4. Operating business segments
- 8.5.5. Product portfolio
- 8.6. Multisorb
- 8.6.1. Company overview
- 8.6.2. Key Executives
- 8.6.3. Company snapshot
- 8.6.4. Operating business segments
- 8.6.5. Product portfolio
- 8.7. CLARIANT
- 8.7.1. Company overview
- 8.7.2. Key Executives
- 8.7.3. Company snapshot
- 8.7.4. Operating business segments
- 8.7.5. Product portfolio
- 8.7.6. Business performance
- 8.8. Capitol Scientific, Inc.
- 8.8.1. Company overview
- 8.8.2. Key Executives
- 8.8.3. Company snapshot
- 8.8.4. Operating business segments
- 8.8.5. Product portfolio
- 8.9. W. R. Grace & Co.-Conn.
- 8.9.1. Company overview
- 8.9.2. Key Executives
- 8.9.3. Company snapshot
- 8.9.4. Operating business segments
- 8.9.5. Product portfolio
- 8.9.6. Business performance
- 8.10. Evonik Industries AG
- 8.10.1. Company overview
- 8.10.2. Key Executives
- 8.10.3. Company snapshot
- 8.10.4. Operating business segments
- 8.10.5. Product portfolio
- 8.10.6. Business performance
LIST OF TABLES
- TABLE 01. GLOBAL DESICCANT MARKET, BY TYPE, 2022-2032 ($MILLION)
- TABLE 02. GLOBAL DESICCANT MARKET, BY TYPE, 2022-2032 (KILOTON)
- TABLE 03. DESICCANT MARKET FOR SILICA GEL, BY REGION, 2022-2032 ($MILLION)
- TABLE 04. DESICCANT MARKET FOR SILICA GEL, BY REGION, 2022-2032 (KILOTON)
- TABLE 05. DESICCANT MARKET FOR ACTIVATED ALUMINA, BY REGION, 2022-2032 ($MILLION)
- TABLE 06. DESICCANT MARKET FOR ACTIVATED ALUMINA, BY REGION, 2022-2032 (KILOTON)
- TABLE 07. DESICCANT MARKET FOR ACTIVATED CHARCOAL, BY REGION, 2022-2032 ($MILLION)
- TABLE 08. DESICCANT MARKET FOR ACTIVATED CHARCOAL, BY REGION, 2022-2032 (KILOTON)
- TABLE 09. DESICCANT MARKET FOR ZEOLITE, BY REGION, 2022-2032 ($MILLION)
- TABLE 10. DESICCANT MARKET FOR ZEOLITE, BY REGION, 2022-2032 (KILOTON)
- TABLE 11. DESICCANT MARKET FOR CALCIUM CHLORIDE, BY REGION, 2022-2032 ($MILLION)
- TABLE 12. DESICCANT MARKET FOR CALCIUM CHLORIDE, BY REGION, 2022-2032 (KILOTON)
- TABLE 13. DESICCANT MARKET FOR CLAY, BY REGION, 2022-2032 ($MILLION)
- TABLE 14. DESICCANT MARKET FOR CLAY, BY REGION, 2022-2032 (KILOTON)
- TABLE 15. DESICCANT MARKET FOR OTHERS, BY REGION, 2022-2032 ($MILLION)
- TABLE 16. DESICCANT MARKET FOR OTHERS, BY REGION, 2022-2032 (KILOTON)
- TABLE 17. GLOBAL DESICCANT MARKET, BY END-USE INDUSTRIES, 2022-2032 ($MILLION)
- TABLE 18. GLOBAL DESICCANT MARKET, BY END-USE INDUSTRIES, 2022-2032 (KILOTON)
- TABLE 19. DESICCANT MARKET FOR PACKAGING, BY REGION, 2022-2032 ($MILLION)
- TABLE 20. DESICCANT MARKET FOR PACKAGING, BY REGION, 2022-2032 (KILOTON)
- TABLE 21. DESICCANT MARKET FOR FOOD, BY REGION, 2022-2032 ($MILLION)
- TABLE 22. DESICCANT MARKET FOR FOOD, BY REGION, 2022-2032 (KILOTON)
- TABLE 23. DESICCANT MARKET FOR PHARMACEUTICAL, BY REGION, 2022-2032 ($MILLION)
- TABLE 24. DESICCANT MARKET FOR PHARMACEUTICAL, BY REGION, 2022-2032 (KILOTON)
- TABLE 25. DESICCANT MARKET FOR ELECTRONICS, BY REGION, 2022-2032 ($MILLION)
- TABLE 26. DESICCANT MARKET FOR ELECTRONICS, BY REGION, 2022-2032 (KILOTON)
- TABLE 27. DESICCANT MARKET FOR OTHERS, BY REGION, 2022-2032 ($MILLION)
- TABLE 28. DESICCANT MARKET FOR OTHERS, BY REGION, 2022-2032 (KILOTON)
- TABLE 29. DESICCANT MARKET, BY REGION, 2022-2032 ($MILLION)
- TABLE 30. DESICCANT MARKET, BY REGION, 2022-2032 (KILOTON)
- TABLE 31. NORTH AMERICA DESICCANT MARKET, BY TYPE, 2022-2032 ($MILLION)
- TABLE 32. NORTH AMERICA DESICCANT MARKET, BY TYPE, 2022-2032 (KILOTON)
- TABLE 33. NORTH AMERICA DESICCANT MARKET, BY END-USE INDUSTRIES, 2022-2032 ($MILLION)
- TABLE 34. NORTH AMERICA DESICCANT MARKET, BY END-USE INDUSTRIES, 2022-2032 (KILOTON)
- TABLE 35. NORTH AMERICA DESICCANT MARKET, BY COUNTRY, 2022-2032 ($MILLION)
- TABLE 36. NORTH AMERICA DESICCANT MARKET, BY COUNTRY, 2022-2032 (KILOTON)
- TABLE 37. U.S. DESICCANT MARKET, BY TYPE, 2022-2032 ($MILLION)
- TABLE 38. U.S. DESICCANT MARKET, BY TYPE, 2022-2032 (KILOTON)
- TABLE 39. U.S. DESICCANT MARKET, BY END-USE INDUSTRIES, 2022-2032 ($MILLION)
- TABLE 40. U.S. DESICCANT MARKET, BY END-USE INDUSTRIES, 2022-2032 (KILOTON)
- TABLE 41. CANADA DESICCANT MARKET, BY TYPE, 2022-2032 ($MILLION)
- TABLE 42. CANADA DESICCANT MARKET, BY TYPE, 2022-2032 (KILOTON)
- TABLE 43. CANADA DESICCANT MARKET, BY END-USE INDUSTRIES, 2022-2032 ($MILLION)
- TABLE 44. CANADA DESICCANT MARKET, BY END-USE INDUSTRIES, 2022-2032 (KILOTON)
- TABLE 45. MEXICO DESICCANT MARKET, BY TYPE, 2022-2032 ($MILLION)
- TABLE 46. MEXICO DESICCANT MARKET, BY TYPE, 2022-2032 (KILOTON)
- TABLE 47. MEXICO DESICCANT MARKET, BY END-USE INDUSTRIES, 2022-2032 ($MILLION)
- TABLE 48. MEXICO DESICCANT MARKET, BY END-USE INDUSTRIES, 2022-2032 (KILOTON)
- TABLE 49. EUROPE DESICCANT MARKET, BY TYPE, 2022-2032 ($MILLION)
- TABLE 50. EUROPE DESICCANT MARKET, BY TYPE, 2022-2032 (KILOTON)
- TABLE 51. EUROPE DESICCANT MARKET, BY END-USE INDUSTRIES, 2022-2032 ($MILLION)
- TABLE 52. EUROPE DESICCANT MARKET, BY END-USE INDUSTRIES, 2022-2032 (KILOTON)
- TABLE 53. EUROPE DESICCANT MARKET, BY COUNTRY, 2022-2032 ($MILLION)
- TABLE 54. EUROPE DESICCANT MARKET, BY COUNTRY, 2022-2032 (KILOTON)
- TABLE 55. GERMANY DESICCANT MARKET, BY TYPE, 2022-2032 ($MILLION)
- TABLE 56. GERMANY DESICCANT MARKET, BY TYPE, 2022-2032 (KILOTON)
- TABLE 57. GERMANY DESICCANT MARKET, BY END-USE INDUSTRIES, 2022-2032 ($MILLION)
- TABLE 58. GERMANY DESICCANT MARKET, BY END-USE INDUSTRIES, 2022-2032 (KILOTON)
- TABLE 59. FRANCE DESICCANT MARKET, BY TYPE, 2022-2032 ($MILLION)
- TABLE 60. FRANCE DESICCANT MARKET, BY TYPE, 2022-2032 (KILOTON)
- TABLE 61. FRANCE DESICCANT MARKET, BY END-USE INDUSTRIES, 2022-2032 ($MILLION)
- TABLE 62. FRANCE DESICCANT MARKET, BY END-USE INDUSTRIES, 2022-2032 (KILOTON)
- TABLE 63. UK DESICCANT MARKET, BY TYPE, 2022-2032 ($MILLION)
- TABLE 64. UK DESICCANT MARKET, BY TYPE, 2022-2032 (KILOTON)
- TABLE 65. UK DESICCANT MARKET, BY END-USE INDUSTRIES, 2022-2032 ($MILLION)
- TABLE 66. UK DESICCANT MARKET, BY END-USE INDUSTRIES, 2022-2032 (KILOTON)
- TABLE 67. SPAIN DESICCANT MARKET, BY TYPE, 2022-2032 ($MILLION)
- TABLE 68. SPAIN DESICCANT MARKET, BY TYPE, 2022-2032 (KILOTON)
- TABLE 69. SPAIN DESICCANT MARKET, BY END-USE INDUSTRIES, 2022-2032 ($MILLION)
- TABLE 70. SPAIN DESICCANT MARKET, BY END-USE INDUSTRIES, 2022-2032 (KILOTON)
- TABLE 71. ITALY DESICCANT MARKET, BY TYPE, 2022-2032 ($MILLION)
- TABLE 72. ITALY DESICCANT MARKET, BY TYPE, 2022-2032 (KILOTON)
- TABLE 73. ITALY DESICCANT MARKET, BY END-USE INDUSTRIES, 2022-2032 ($MILLION)
- TABLE 74. ITALY DESICCANT MARKET, BY END-USE INDUSTRIES, 2022-2032 (KILOTON)
- TABLE 75. REST OF EUROPE DESICCANT MARKET, BY TYPE, 2022-2032 ($MILLION)
- TABLE 76. REST OF EUROPE DESICCANT MARKET, BY TYPE, 2022-2032 (KILOTON)
- TABLE 77. REST OF EUROPE DESICCANT MARKET, BY END-USE INDUSTRIES, 2022-2032 ($MILLION)
- TABLE 78. REST OF EUROPE DESICCANT MARKET, BY END-USE INDUSTRIES, 2022-2032 (KILOTON)
- TABLE 79. ASIA-PACIFIC DESICCANT MARKET, BY TYPE, 2022-2032 ($MILLION)
- TABLE 80. ASIA-PACIFIC DESICCANT MARKET, BY TYPE, 2022-2032 (KILOTON)
- TABLE 81. ASIA-PACIFIC DESICCANT MARKET, BY END-USE INDUSTRIES, 2022-2032 ($MILLION)
- TABLE 82. ASIA-PACIFIC DESICCANT MARKET, BY END-USE INDUSTRIES, 2022-2032 (KILOTON)
- TABLE 83. ASIA-PACIFIC DESICCANT MARKET, BY COUNTRY, 2022-2032 ($MILLION)
- TABLE 84. ASIA-PACIFIC DESICCANT MARKET, BY COUNTRY, 2022-2032 (KILOTON)
- TABLE 85. CHINA DESICCANT MARKET, BY TYPE, 2022-2032 ($MILLION)
- TABLE 86. CHINA DESICCANT MARKET, BY TYPE, 2022-2032 (KILOTON)
- TABLE 87. CHINA DESICCANT MARKET, BY END-USE INDUSTRIES, 2022-2032 ($MILLION)
- TABLE 88. CHINA DESICCANT MARKET, BY END-USE INDUSTRIES, 2022-2032 (KILOTON)
- TABLE 89. JAPAN DESICCANT MARKET, BY TYPE, 2022-2032 ($MILLION)
- TABLE 90. JAPAN DESICCANT MARKET, BY TYPE, 2022-2032 (KILOTON)
- TABLE 91. JAPAN DESICCANT MARKET, BY END-USE INDUSTRIES, 2022-2032 ($MILLION)
- TABLE 92. JAPAN DESICCANT MARKET, BY END-USE INDUSTRIES, 2022-2032 (KILOTON)
- TABLE 93. INDIA DESICCANT MARKET, BY TYPE, 2022-2032 ($MILLION)
- TABLE 94. INDIA DESICCANT MARKET, BY TYPE, 2022-2032 (KILOTON)
- TABLE 95. INDIA DESICCANT MARKET, BY END-USE INDUSTRIES, 2022-2032 ($MILLION)
- TABLE 96. INDIA DESICCANT MARKET, BY END-USE INDUSTRIES, 2022-2032 (KILOTON)
- TABLE 97. SOUTH KOREA DESICCANT MARKET, BY TYPE, 2022-2032 ($MILLION)
- TABLE 98. SOUTH KOREA DESICCANT MARKET, BY TYPE, 2022-2032 (KILOTON)
- TABLE 99. SOUTH KOREA DESICCANT MARKET, BY END-USE INDUSTRIES, 2022-2032 ($MILLION)
- TABLE 100. SOUTH KOREA DESICCANT MARKET, BY END-USE INDUSTRIES, 2022-2032 (KILOTON)
- TABLE 101. AUSTRALIA DESICCANT MARKET, BY TYPE, 2022-2032 ($MILLION)
- TABLE 102. AUSTRALIA DESICCANT MARKET, BY TYPE, 2022-2032 (KILOTON)
- TABLE 103. AUSTRALIA DESICCANT MARKET, BY END-USE INDUSTRIES, 2022-2032 ($MILLION)
- TABLE 104. AUSTRALIA DESICCANT MARKET, BY END-USE INDUSTRIES, 2022-2032 (KILOTON)
- TABLE 105. REST OF ASIA-PACIFIC DESICCANT MARKET, BY TYPE, 2022-2032 ($MILLION)
- TABLE 106. REST OF ASIA-PACIFIC DESICCANT MARKET, BY TYPE, 2022-2032 (KILOTON)
- TABLE 107. REST OF ASIA-PACIFIC DESICCANT MARKET, BY END-USE INDUSTRIES, 2022-2032 ($MILLION)
- TABLE 108. REST OF ASIA-PACIFIC DESICCANT MARKET, BY END-USE INDUSTRIES, 2022-2032 (KILOTON)
- TABLE 109. LAMEA DESICCANT MARKET, BY TYPE, 2022-2032 ($MILLION)
- TABLE 110. LAMEA DESICCANT MARKET, BY TYPE, 2022-2032 (KILOTON)
- TABLE 111. LAMEA DESICCANT MARKET, BY END-USE INDUSTRIES, 2022-2032 ($MILLION)
- TABLE 112. LAMEA DESICCANT MARKET, BY END-USE INDUSTRIES, 2022-2032 (KILOTON)
- TABLE 113. LAMEA DESICCANT MARKET, BY COUNTRY, 2022-2032 ($MILLION)
- TABLE 114. LAMEA DESICCANT MARKET, BY COUNTRY, 2022-2032 (KILOTON)
- TABLE 115. BRAZIL DESICCANT MARKET, BY TYPE, 2022-2032 ($MILLION)
- TABLE 116. BRAZIL DESICCANT MARKET, BY TYPE, 2022-2032 (KILOTON)
- TABLE 117. BRAZIL DESICCANT MARKET, BY END-USE INDUSTRIES, 2022-2032 ($MILLION)
- TABLE 118. BRAZIL DESICCANT MARKET, BY END-USE INDUSTRIES, 2022-2032 (KILOTON)
- TABLE 119. SAUDI ARABIA DESICCANT MARKET, BY TYPE, 2022-2032 ($MILLION)
- TABLE 120. SAUDI ARABIA DESICCANT MARKET, BY TYPE, 2022-2032 (KILOTON)
- TABLE 121. SAUDI ARABIA DESICCANT MARKET, BY END-USE INDUSTRIES, 2022-2032 ($MILLION)
- TABLE 122. SAUDI ARABIA DESICCANT MARKET, BY END-USE INDUSTRIES, 2022-2032 (KILOTON)
- TABLE 123. SOUTH AFRICA DESICCANT MARKET, BY TYPE, 2022-2032 ($MILLION)
- TABLE 124. SOUTH AFRICA DESICCANT MARKET, BY TYPE, 2022-2032 (KILOTON)
- TABLE 125. SOUTH AFRICA DESICCANT MARKET, BY END-USE INDUSTRIES, 2022-2032 ($MILLION)
- TABLE 126. SOUTH AFRICA DESICCANT MARKET, BY END-USE INDUSTRIES, 2022-2032 (KILOTON)
- TABLE 127. REST OF LAMEA DESICCANT MARKET, BY TYPE, 2022-2032 ($MILLION)
- TABLE 128. REST OF LAMEA DESICCANT MARKET, BY TYPE, 2022-2032 (KILOTON)
- TABLE 129. REST OF LAMEA DESICCANT MARKET, BY END-USE INDUSTRIES, 2022-2032 ($MILLION)
- TABLE 130. REST OF LAMEA DESICCANT MARKET, BY END-USE INDUSTRIES, 2022-2032 (KILOTON)
- TABLE 131. FUJI SILYSIA CHEMICAL LTD.: KEY EXECUTIVES
- TABLE 132. FUJI SILYSIA CHEMICAL LTD.: COMPANY SNAPSHOT
- TABLE 133. FUJI SILYSIA CHEMICAL LTD.: PRODUCT SEGMENTS
- TABLE 134. FUJI SILYSIA CHEMICAL LTD.: PRODUCT PORTFOLIO
- TABLE 135. DESICCA CHEMICAL PVT. LTD.: KEY EXECUTIVES
- TABLE 136. DESICCA CHEMICAL PVT. LTD.: COMPANY SNAPSHOT
- TABLE 137. DESICCA CHEMICAL PVT. LTD.: PRODUCT SEGMENTS
- TABLE 138. DESICCA CHEMICAL PVT. LTD.: PRODUCT PORTFOLIO
- TABLE 139. TROPACK PACKMITEL GMBH: KEY EXECUTIVES
- TABLE 140. TROPACK PACKMITEL GMBH: COMPANY SNAPSHOT
- TABLE 141. TROPACK PACKMITEL GMBH: PRODUCT SEGMENTS
- TABLE 142. TROPACK PACKMITEL GMBH: PRODUCT PORTFOLIO
- TABLE 143. OKER-CHEMIE: KEY EXECUTIVES
- TABLE 144. OKER-CHEMIE: COMPANY SNAPSHOT
- TABLE 145. OKER-CHEMIE: PRODUCT SEGMENTS
- TABLE 146. OKER-CHEMIE: PRODUCT PORTFOLIO
- TABLE 147. HENGYE, INC.: KEY EXECUTIVES
- TABLE 148. HENGYE, INC.: COMPANY SNAPSHOT
- TABLE 149. HENGYE, INC.: PRODUCT SEGMENTS
- TABLE 150. HENGYE, INC.: PRODUCT PORTFOLIO
- TABLE 151. MULTISORB: KEY EXECUTIVES
- TABLE 152. MULTISORB: COMPANY SNAPSHOT
- TABLE 153. MULTISORB: PRODUCT SEGMENTS
- TABLE 154. MULTISORB: PRODUCT PORTFOLIO
- TABLE 155. CLARIANT: KEY EXECUTIVES
- TABLE 156. CLARIANT: COMPANY SNAPSHOT
- TABLE 157. CLARIANT: PRODUCT SEGMENTS
- TABLE 158. CLARIANT: PRODUCT PORTFOLIO
- TABLE 159. CAPITOL SCIENTIFIC, INC.: KEY EXECUTIVES
- TABLE 160. CAPITOL SCIENTIFIC, INC.: COMPANY SNAPSHOT
- TABLE 161. CAPITOL SCIENTIFIC, INC.: PRODUCT SEGMENTS
- TABLE 162. CAPITOL SCIENTIFIC, INC.: PRODUCT PORTFOLIO
- TABLE 163. W. R. GRACE & CO.-CONN.: KEY EXECUTIVES
- TABLE 164. W. R. GRACE & CO.-CONN.: COMPANY SNAPSHOT
- TABLE 165. W. R. GRACE & CO.-CONN.: PRODUCT SEGMENTS
- TABLE 166. W. R. GRACE & CO.-CONN.: PRODUCT PORTFOLIO
- TABLE 167. EVONIK INDUSTRIES AG: KEY EXECUTIVES
- TABLE 168. EVONIK INDUSTRIES AG: COMPANY SNAPSHOT
- TABLE 169. EVONIK INDUSTRIES AG: PRODUCT SEGMENTS
- TABLE 170. EVONIK INDUSTRIES AG: PRODUCT PORTFOLIO
LIST OF FIGURES
- FIGURE 01. DESICCANT MARKET, 2022-2032
- FIGURE 02. SEGMENTATION OF DESICCANT MARKET,2022-2032
- FIGURE 03. TOP INVESTMENT POCKETS IN DESICCANT MARKET (2023-2032)
- FIGURE 04. MODERATE BARGAINING POWER OF SUPPLIERS
- FIGURE 05. MODERATE THREAT OF NEW ENTRANTS
- FIGURE 06. MODERATE THREAT OF SUBSTITUTES
- FIGURE 07. HIGH INTENSITY OF RIVALRY
- FIGURE 08. HIGH BARGAINING POWER OF BUYERS
- FIGURE 09. GLOBAL DESICCANT MARKET:DRIVERS, RESTRAINTS AND OPPORTUNITIES
- FIGURE 10. MARKET SHARE ANALYSIS OF DESICCANT MARKET BY KEY PLAYERS, 2022 (%)
- FIGURE 11. PRICING ANALYSIS: DESICCANT MARKET 2022 AND 2032
- FIGURE 12. PATENT ANALYSIS BY COMPANY
- FIGURE 13. PATENT ANALYSIS BY COUNTRY
- FIGURE 14. DESICCANT MARKET, BY TYPE, 2022 AND 2032(%)
- FIGURE 15. COMPARATIVE SHARE ANALYSIS OF DESICCANT MARKET FOR SILICA GEL, BY COUNTRY 2022 AND 2032(%)
- FIGURE 16. COMPARATIVE SHARE ANALYSIS OF DESICCANT MARKET FOR ACTIVATED ALUMINA, BY COUNTRY 2022 AND 2032(%)
- FIGURE 17. COMPARATIVE SHARE ANALYSIS OF DESICCANT MARKET FOR ACTIVATED CHARCOAL, BY COUNTRY 2022 AND 2032(%)
- FIGURE 18. COMPARATIVE SHARE ANALYSIS OF DESICCANT MARKET FOR ZEOLITE, BY COUNTRY 2022 AND 2032(%)
- FIGURE 19. COMPARATIVE SHARE ANALYSIS OF DESICCANT MARKET FOR CALCIUM CHLORIDE, BY COUNTRY 2022 AND 2032(%)
- FIGURE 20. COMPARATIVE SHARE ANALYSIS OF DESICCANT MARKET FOR CLAY, BY COUNTRY 2022 AND 2032(%)
- FIGURE 21. COMPARATIVE SHARE ANALYSIS OF DESICCANT MARKET FOR OTHERS, BY COUNTRY 2022 AND 2032(%)
- FIGURE 22. DESICCANT MARKET, BY END-USE INDUSTRIES, 2022 AND 2032(%)
- FIGURE 23. COMPARATIVE SHARE ANALYSIS OF DESICCANT MARKET FOR PACKAGING, BY COUNTRY 2022 AND 2032(%)
- FIGURE 24. COMPARATIVE SHARE ANALYSIS OF DESICCANT MARKET FOR FOOD, BY COUNTRY 2022 AND 2032(%)
- FIGURE 25. COMPARATIVE SHARE ANALYSIS OF DESICCANT MARKET FOR PHARMACEUTICAL, BY COUNTRY 2022 AND 2032(%)
- FIGURE 26. COMPARATIVE SHARE ANALYSIS OF DESICCANT MARKET FOR ELECTRONICS, BY COUNTRY 2022 AND 2032(%)
- FIGURE 27. COMPARATIVE SHARE ANALYSIS OF DESICCANT MARKET FOR OTHERS, BY COUNTRY 2022 AND 2032(%)
- FIGURE 28. DESICCANT MARKET BY REGION, 2022 AND 2032(%)
- FIGURE 29. U.S. DESICCANT MARKET, 2022-2032 ($MILLION)
- FIGURE 30. CANADA DESICCANT MARKET, 2022-2032 ($MILLION)
- FIGURE 31. MEXICO DESICCANT MARKET, 2022-2032 ($MILLION)
- FIGURE 32. GERMANY DESICCANT MARKET, 2022-2032 ($MILLION)
- FIGURE 33. FRANCE DESICCANT MARKET, 2022-2032 ($MILLION)
- FIGURE 34. UK DESICCANT MARKET, 2022-2032 ($MILLION)
- FIGURE 35. SPAIN DESICCANT MARKET, 2022-2032 ($MILLION)
- FIGURE 36. ITALY DESICCANT MARKET, 2022-2032 ($MILLION)
- FIGURE 37. REST OF EUROPE DESICCANT MARKET, 2022-2032 ($MILLION)
- FIGURE 38. CHINA DESICCANT MARKET, 2022-2032 ($MILLION)
- FIGURE 39. JAPAN DESICCANT MARKET, 2022-2032 ($MILLION)
- FIGURE 40. INDIA DESICCANT MARKET, 2022-2032 ($MILLION)
- FIGURE 41. SOUTH KOREA DESICCANT MARKET, 2022-2032 ($MILLION)
- FIGURE 42. AUSTRALIA DESICCANT MARKET, 2022-2032 ($MILLION)
- FIGURE 43. REST OF ASIA-PACIFIC DESICCANT MARKET, 2022-2032 ($MILLION)
- FIGURE 44. BRAZIL DESICCANT MARKET, 2022-2032 ($MILLION)
- FIGURE 45. SAUDI ARABIA DESICCANT MARKET, 2022-2032 ($MILLION)
- FIGURE 46. SOUTH AFRICA DESICCANT MARKET, 2022-2032 ($MILLION)
- FIGURE 47. REST OF LAMEA DESICCANT MARKET, 2022-2032 ($MILLION)
- FIGURE 48. TOP WINNING STRATEGIES, BY YEAR
- FIGURE 49. TOP WINNING STRATEGIES, BY DEVELOPMENT
- FIGURE 50. TOP WINNING STRATEGIES, BY COMPANY
- FIGURE 51. PRODUCT MAPPING OF TOP 10 PLAYERS
- FIGURE 52. COMPETITIVE DASHBOARD
- FIGURE 53. COMPETITIVE HEATMAP: DESICCANT MARKET
- FIGURE 54. TOP PLAYER POSITIONING, 2022
- FIGURE 55. CLARIANT: NET REVENUE, 2020-2022 ($MILLION)
- FIGURE 56. CLARIANT: RESEARCH & DEVELOPMENT EXPENDITURE, 2020-2022 ($MILLION)
- FIGURE 57. CLARIANT: REVENUE SHARE BY SEGMENT, 2022 (%)
- FIGURE 58. CLARIANT: REVENUE SHARE BY REGION, 2022 (%)
- FIGURE 59. W. R. GRACE & CO.-CONN.: NET REVENUE, 2018-2020 ($MILLION)
- FIGURE 60. W. R. GRACE & CO.-CONN.: REVENUE SHARE BY SEGMENT, 2020 (%)
- FIGURE 61. W. R. GRACE & CO.-CONN.: REVENUE SHARE BY REGION, 2020 (%)
- FIGURE 62. EVONIK INDUSTRIES AG: NET REVENUE, 2019-2021 ($MILLION)
- FIGURE 63. EVONIK INDUSTRIES AG: RESEARCH & DEVELOPMENT EXPENDITURE, 2019-2021 ($MILLION)
- FIGURE 64. EVONIK INDUSTRIES AG: REVENUE SHARE BY SEGMENT, 2021 (%)
- FIGURE 65. EVONIK INDUSTRIES AG: REVENUE SHARE BY REGION, 2021 (%)
 乾燥劑除濕轉輪全球市場:按類型、產品類型、乾燥劑類型、分銷管道、應用 - 預測 2024-2030
 2024 年乾燥劑全球市場報告
 到 2032 年乾燥劑全球市場、機會與策略
 乾燥劑市場 - 2018-2028 年全球產業規模、佔有率、趨勢、機會和預測,按類型、最終用戶、地區和競爭細分
 乾燥劑除濕機的世界市場
 2023-2030 年全球乾燥器市場規模研究與預測(按類型、材料、應用和區域分析)
 乾燥劑除濕機市場:趨勢,機會,競爭分析【2023-2028年】
 全球乾燥劑除濕機市場研究報告 - 2023 年至 2030 年的行業分析、規模、佔有率、成長、趨勢和預測
 除濕機全球市場規模、份額、行業趨勢分析報告:按產品類型、應用、最終用戶、地區劃分的展望和預測,2023-2030 年
 乾燥劑除濕轉輪市場:按類型、產品、乾燥劑類型、配銷通路、用途- 全球預測 2023-2030