


 |
市場調查報告書
商品編碼
1365758
語意網市場:按組件、部署類型、公司規模和產業分類:2023-2032年全球機會分析與產業預測Semantic Web Market By Component, By Deployment Type, By Enterprise Size, By Industry Vertical : Global Opportunity Analysis and Industry Forecast, 2023-2032 |
||||||
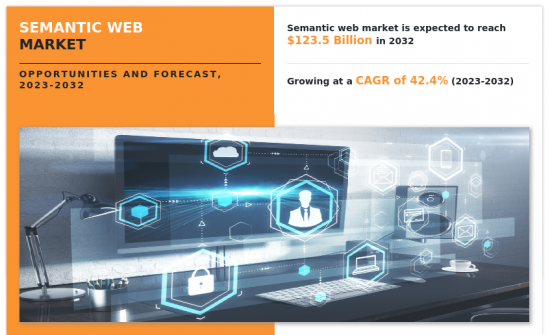
2022年語意網市場規模預估為37億美元,2023年至2032年年複合成長率為42.4%,2032年將達1,235億美元。
網路設備普及的提高以及各企業對靈活安全服務的需求不斷成長等因素預計將在預測期內推動市場成長。此外,安全資料視覺化工具也有所增加,預計這將在預測期內為市場提供有利的成長機會。透過以語義方式表示資料,可以建立互動式動態視覺化,更深入了解複雜的安全情況。安全分析師可以更有效地探索資料並做出更資訊的決策。
此外,企業擴大採用資料管理解決方案和語義網解決方案,預計也將對未來幾年的市場成長產生積極影響。此外,對語言處理和多語言應用程式的需求迅速成長推動全球市場的成長。然而,資料隱私和安全、缺乏知識和資料品質以及標準化錯誤阻礙市場成長。此外,人工智慧和機器學習技術的日益整合以及物聯網技術的引進為語義網市場的成長創造機會。
目錄
第1章 簡介
第2章 執行摘要
第3章 市場概況
- 市場定義和範圍
- 主要發現
- 影響因素
- 主要投資機會
- 波特五力分析
- 市場動態
- 促進因素
- 更多採用資料管理解決方案
- 語意網在企業中的採用率不斷提高
- 語言處理和多語言應用程式的需求快速成長
- 抑制因素
- 資料品質和標準化誤差
- 資料安全和隱私
- 機會
- 人工智慧和機器學習技術整合的成長
- 物聯網技術介紹
- 促進因素
- COVID-19 市場影響分析
- 關鍵法規分析
- 公共
第4章 語意網路市場:按組成部分
- 概述
- 解決方案
- 服務
第5章 語意 Web 市集:依部署類型
- 概述
- 公眾
- 私人
- 混合
第6章 語意網市場:依公司規模分類
- 概述
- 主要企業
- 中小企業
第7章 語意網路市場:依行業分類
- 概述
- BFSI
- 資訊科技/通訊
- 零售/電子商務
- 醫學/生命科學
- 媒體/出版
- 政府/公共機構
- 教育
- 其他
第8章 語意網路市集:依地區
- 概述
- 北美洲
- 美國
- 加拿大
- 歐洲
- 英國
- 德國
- 法國
- 義大利
- 西班牙
- 其他
- 亞太地區
- 中國
- 日本
- 印度
- 澳洲
- 韓國
- 其他
- 拉丁美洲
- 拉丁美洲
- 中東
- 非洲
第9章 競爭形勢
- 介紹
- 關鍵成功策略
- 10家主要企業產品圖譜
- 競爭儀表板
- 競爭熱圖
- 2022年主要企業定位
第10章 公司簡介
- Altova
- NetBase Quid
- OpenLink Software Inc.
- Semantic Web Company
- Franz Inc.
- Microsoft Corporation
- Cambridge Semantics
- Ontotext
- TopQuadrant
- Cycorp Inc.
According to a new report published by Allied Market Research, titled, "Semantic Web Market," The semantic web market was valued at $3.7 billion in 2022, and is estimated to reach $123.5 billion by 2032, growing at a CAGR of 42.4% from 2023 to 2032.
Factors such as increasing adoption of internet devices and growing demand for flexible security services across various businesses are expected to fuel the growth of the market during the forecast period. Furthermore, the rise in visualization tools for security data is also arising, which further is expected to provide lucrative growth opportunities for the market in the forecast period. By representing data semantically, it can build interactive and dynamic visualizations that provide deeper insights into complex security situations. Security analysts can explore data more effectively and make more informed decisions.
Furthermore, the rise in the adoption of data management solutions and increasing adoption of semantic web solutions in businesses is expected to positively impact the growth of the market in the future. In addition, the surge in need for language processing and multilingual applications are driving global market growth. However, data privacy and security and lack of knowledge and data quality and standardization errors hamper market growth. Furthermore, growing integration of AI and ML technologies and implementation of IoT technology create opportunities for semantic web market growth.
The semantic web market is segmented into component, deployment type, enterprise size, industry vertical, and region. By component, it is bifurcated into solution and service. By deployment type, it is divided into public, private and hybrid. By enterprise size, it is categorized into large enterprises and small and medium-sized enterprises. By industry vertical, the market is classified into BFSI, IT and telecom, retail and e-commerce, healthcare and life science, media and publishing, government and public sector, education, and others. Region wise, it is analyzed across North America, Europe, Asia-Pacific, and LAMEA.
The market players operating in the global semantic web market. This report further outlines the current trends and key areas of investment. In addition, it includes Porter's five forces analysis to understand the competitive scenario of the industry and role of each stakeholder. The report features the strategies adopted by key market players to maintain their foothold in the market. Furthermore, it highlights the competitive landscape of key market players to increase their market share and sustain intense competition in the industry. The key players operating in the market include Altova, Cambridge Semantics, Cycorp Inc, Franz Inc., Microsoft Corporation, NetBase Solutions Inc., Ontotext, OpenLink Software Inc., Semantic Web Company and TopQuadrant.
Key Benefits for Stakeholders
- The study provides an in-depth analysis of the semantic web market forecast along with the current and future trends to explain the imminent investment pockets.
- Information about key drivers, restraints, and opportunities and their impact analysis on semantic web market trends is provided in the report.
- The Porter's five forces analysis illustrates the potency of the buyers and suppliers operating in the industry.
- The quantitative analysis of the semantic web market from 2022 to 2032 is provided to determine the market potential.
Additional benefits you will get with this purchase are:
- Quarterly Update and* (only available with a corporate license, on listed price)
- 5 additional Company Profile of client Choice pre- or Post-purchase, as a free update.
- Free Upcoming Version on the Purchase of Five and Enterprise User License.
- 16 analyst hours of support* (post-purchase, if you find additional data requirements upon review of the report, you may receive support amounting to 16 analyst hours to solve questions, and post-sale queries)
- 15% Free Customization* (in case the scope or segment of the report does not match your requirements, 20% is equivalent to 3 working days of free work, applicable once)
- Free data Pack on the Five and Enterprise User License. (Excel version of the report)
- Free Updated report if the report is 6-12 months old or older.
- 24-hour priority response*
- Free Industry updates and white papers.
Possible Customization with this report (with additional cost and timeline talk to the sales executive to know more)
- Investment Opportunities
- Technology Trend Analysis
- Regulatory Guidelines
- Strategic Recommedations
- Additional company profiles with specific to client's interest
- SWOT Analysis
Key Market Segments
By Component
- Solution
- Service
By Deployment Type
- Public
- Private
- Hybrid
By Enterprise Size
- Large Enterprises
- Small and Medium-sized Enterprises
By Industry Vertical
- BFSI
- IT and Telecom
- Retail and E-commerce
- Healthcare and Life Science
- Media and Publishing
- Government and Public Sector
- Education
- Others
By Region
- North America
- U.S.
- Canada
- Europe
- UK
- Germany
- France
- Italy
- Spain
- Rest of Europe
- Asia-Pacific
- China
- Japan
- India
- Australia
- South Korea
- Rest of Asia-Pacific
- LAMEA
- Latin America
- Middle East
- Africa
Key Market Players:
- Altova
- NetBase Quid
- OpenLink Software Inc.
- Franz Inc.
- Cambridge Semantics
- Ontotext
- Cycorp Inc.
- TopQuadrant
- Microsoft Corporation
- Semantic Web Company
TABLE OF CONTENTS
CHAPTER 1: INTRODUCTION
- 1.1. Report description
- 1.2. Key market segments
- 1.3. Key benefits to the stakeholders
- 1.4. Research Methodology
- 1.4.1. Primary research
- 1.4.2. Secondary research
- 1.4.3. Analyst tools and models
CHAPTER 2: EXECUTIVE SUMMARY
- 2.1. CXO Perspective
CHAPTER 3: MARKET OVERVIEW
- 3.1. Market definition and scope
- 3.2. Key findings
- 3.2.1. Top impacting factors
- 3.2.2. Top investment pockets
- 3.3. Porter's five forces analysis
- 3.3.1. Moerate bargaining power of suppliers
- 3.3.2. Low-to-high threat of new entrants
- 3.3.3. Moderate threat of substitutes
- 3.3.4. Moderate intensity of rivalry
- 3.3.5. Moderate bargaining power of buyers
- 3.4. Market dynamics
- 3.4.1. Drivers
- 3.4.1.1. The rise in the adoption of data management solutions
- 3.4.1.2. Increase in adoption of semantic web in businesses
- 3.4.1.3. Surge in need for language processing and multilingual applications
- 3.4.1. Drivers
- 3.4.2. Restraints
- 3.4.2.1. Data quality and standardization errors
- 3.4.2.2. Data security and privacy
- 3.4.3. Opportunities
- 3.4.3.1. Growth in integration of AI and ML technologies
- 3.4.3.2. Implementation of IoT technology
- 3.5. COVID-19 Impact Analysis on the market
- 3.6. Key Regulation Analysis
- 3.7. Public Policy
CHAPTER 4: SEMANTIC WEB MARKET, BY COMPONENT
- 4.1. Overview
- 4.1.1. Market size and forecast
- 4.2. Solution
- 4.2.1. Key market trends, growth factors and opportunities
- 4.2.2. Market size and forecast, by region
- 4.2.3. Market share analysis by country
- 4.3. Service
- 4.3.1. Key market trends, growth factors and opportunities
- 4.3.2. Market size and forecast, by region
- 4.3.3. Market share analysis by country
CHAPTER 5: SEMANTIC WEB MARKET, BY DEPLOYMENT TYPE
- 5.1. Overview
- 5.1.1. Market size and forecast
- 5.2. Public
- 5.2.1. Key market trends, growth factors and opportunities
- 5.2.2. Market size and forecast, by region
- 5.2.3. Market share analysis by country
- 5.3. Private
- 5.3.1. Key market trends, growth factors and opportunities
- 5.3.2. Market size and forecast, by region
- 5.3.3. Market share analysis by country
- 5.4. Hybrid
- 5.4.1. Key market trends, growth factors and opportunities
- 5.4.2. Market size and forecast, by region
- 5.4.3. Market share analysis by country
CHAPTER 6: SEMANTIC WEB MARKET, BY ENTERPRISE SIZE
- 6.1. Overview
- 6.1.1. Market size and forecast
- 6.2. Large Enterprises
- 6.2.1. Key market trends, growth factors and opportunities
- 6.2.2. Market size and forecast, by region
- 6.2.3. Market share analysis by country
- 6.3. Small and Medium-sized Enterprises
- 6.3.1. Key market trends, growth factors and opportunities
- 6.3.2. Market size and forecast, by region
- 6.3.3. Market share analysis by country
CHAPTER 7: SEMANTIC WEB MARKET, BY INDUSTRY VERTICAL
- 7.1. Overview
- 7.1.1. Market size and forecast
- 7.2. BFSI
- 7.2.1. Key market trends, growth factors and opportunities
- 7.2.2. Market size and forecast, by region
- 7.2.3. Market share analysis by country
- 7.3. IT and Telecom
- 7.3.1. Key market trends, growth factors and opportunities
- 7.3.2. Market size and forecast, by region
- 7.3.3. Market share analysis by country
- 7.4. Retail and E-commerce
- 7.4.1. Key market trends, growth factors and opportunities
- 7.4.2. Market size and forecast, by region
- 7.4.3. Market share analysis by country
- 7.5. Healthcare and Life Science
- 7.5.1. Key market trends, growth factors and opportunities
- 7.5.2. Market size and forecast, by region
- 7.5.3. Market share analysis by country
- 7.6. Media and Publishing
- 7.6.1. Key market trends, growth factors and opportunities
- 7.6.2. Market size and forecast, by region
- 7.6.3. Market share analysis by country
- 7.7. Government and Public Sector
- 7.7.1. Key market trends, growth factors and opportunities
- 7.7.2. Market size and forecast, by region
- 7.7.3. Market share analysis by country
- 7.8. Education
- 7.8.1. Key market trends, growth factors and opportunities
- 7.8.2. Market size and forecast, by region
- 7.8.3. Market share analysis by country
- 7.9. Others
- 7.9.1. Key market trends, growth factors and opportunities
- 7.9.2. Market size and forecast, by region
- 7.9.3. Market share analysis by country
CHAPTER 8: SEMANTIC WEB MARKET, BY REGION
- 8.1. Overview
- 8.1.1. Market size and forecast By Region
- 8.2. North America
- 8.2.1. Key market trends, growth factors and opportunities
- 8.2.2. Market size and forecast, by Component
- 8.2.3. Market size and forecast, by Deployment Type
- 8.2.4. Market size and forecast, by Enterprise Size
- 8.2.5. Market size and forecast, by Industry Vertical
- 8.2.6. Market size and forecast, by country
- 8.2.6.1. U.S.
- 8.2.6.1.1. Market size and forecast, by Component
- 8.2.6.1.2. Market size and forecast, by Deployment Type
- 8.2.6.1.3. Market size and forecast, by Enterprise Size
- 8.2.6.1.4. Market size and forecast, by Industry Vertical
- 8.2.6.2. Canada
- 8.2.6.2.1. Market size and forecast, by Component
- 8.2.6.2.2. Market size and forecast, by Deployment Type
- 8.2.6.2.3. Market size and forecast, by Enterprise Size
- 8.2.6.2.4. Market size and forecast, by Industry Vertical
- 8.3. Europe
- 8.3.1. Key market trends, growth factors and opportunities
- 8.3.2. Market size and forecast, by Component
- 8.3.3. Market size and forecast, by Deployment Type
- 8.3.4. Market size and forecast, by Enterprise Size
- 8.3.5. Market size and forecast, by Industry Vertical
- 8.3.6. Market size and forecast, by country
- 8.3.6.1. UK
- 8.3.6.1.1. Market size and forecast, by Component
- 8.3.6.1.2. Market size and forecast, by Deployment Type
- 8.3.6.1.3. Market size and forecast, by Enterprise Size
- 8.3.6.1.4. Market size and forecast, by Industry Vertical
- 8.3.6.2. Germany
- 8.3.6.2.1. Market size and forecast, by Component
- 8.3.6.2.2. Market size and forecast, by Deployment Type
- 8.3.6.2.3. Market size and forecast, by Enterprise Size
- 8.3.6.2.4. Market size and forecast, by Industry Vertical
- 8.3.6.3. France
- 8.3.6.3.1. Market size and forecast, by Component
- 8.3.6.3.2. Market size and forecast, by Deployment Type
- 8.3.6.3.3. Market size and forecast, by Enterprise Size
- 8.3.6.3.4. Market size and forecast, by Industry Vertical
- 8.3.6.4. Italy
- 8.3.6.4.1. Market size and forecast, by Component
- 8.3.6.4.2. Market size and forecast, by Deployment Type
- 8.3.6.4.3. Market size and forecast, by Enterprise Size
- 8.3.6.4.4. Market size and forecast, by Industry Vertical
- 8.3.6.5. Spain
- 8.3.6.5.1. Market size and forecast, by Component
- 8.3.6.5.2. Market size and forecast, by Deployment Type
- 8.3.6.5.3. Market size and forecast, by Enterprise Size
- 8.3.6.5.4. Market size and forecast, by Industry Vertical
- 8.3.6.6. Rest of Europe
- 8.3.6.6.1. Market size and forecast, by Component
- 8.3.6.6.2. Market size and forecast, by Deployment Type
- 8.3.6.6.3. Market size and forecast, by Enterprise Size
- 8.3.6.6.4. Market size and forecast, by Industry Vertical
- 8.4. Asia-Pacific
- 8.4.1. Key market trends, growth factors and opportunities
- 8.4.2. Market size and forecast, by Component
- 8.4.3. Market size and forecast, by Deployment Type
- 8.4.4. Market size and forecast, by Enterprise Size
- 8.4.5. Market size and forecast, by Industry Vertical
- 8.4.6. Market size and forecast, by country
- 8.4.6.1. China
- 8.4.6.1.1. Market size and forecast, by Component
- 8.4.6.1.2. Market size and forecast, by Deployment Type
- 8.4.6.1.3. Market size and forecast, by Enterprise Size
- 8.4.6.1.4. Market size and forecast, by Industry Vertical
- 8.4.6.2. Japan
- 8.4.6.2.1. Market size and forecast, by Component
- 8.4.6.2.2. Market size and forecast, by Deployment Type
- 8.4.6.2.3. Market size and forecast, by Enterprise Size
- 8.4.6.2.4. Market size and forecast, by Industry Vertical
- 8.4.6.3. India
- 8.4.6.3.1. Market size and forecast, by Component
- 8.4.6.3.2. Market size and forecast, by Deployment Type
- 8.4.6.3.3. Market size and forecast, by Enterprise Size
- 8.4.6.3.4. Market size and forecast, by Industry Vertical
- 8.4.6.4. Australia
- 8.4.6.4.1. Market size and forecast, by Component
- 8.4.6.4.2. Market size and forecast, by Deployment Type
- 8.4.6.4.3. Market size and forecast, by Enterprise Size
- 8.4.6.4.4. Market size and forecast, by Industry Vertical
- 8.4.6.5. South Korea
- 8.4.6.5.1. Market size and forecast, by Component
- 8.4.6.5.2. Market size and forecast, by Deployment Type
- 8.4.6.5.3. Market size and forecast, by Enterprise Size
- 8.4.6.5.4. Market size and forecast, by Industry Vertical
- 8.4.6.6. Rest of Asia-Pacific
- 8.4.6.6.1. Market size and forecast, by Component
- 8.4.6.6.2. Market size and forecast, by Deployment Type
- 8.4.6.6.3. Market size and forecast, by Enterprise Size
- 8.4.6.6.4. Market size and forecast, by Industry Vertical
- 8.5. LAMEA
- 8.5.1. Key market trends, growth factors and opportunities
- 8.5.2. Market size and forecast, by Component
- 8.5.3. Market size and forecast, by Deployment Type
- 8.5.4. Market size and forecast, by Enterprise Size
- 8.5.5. Market size and forecast, by Industry Vertical
- 8.5.6. Market size and forecast, by country
- 8.5.6.1. Latin America
- 8.5.6.1.1. Market size and forecast, by Component
- 8.5.6.1.2. Market size and forecast, by Deployment Type
- 8.5.6.1.3. Market size and forecast, by Enterprise Size
- 8.5.6.1.4. Market size and forecast, by Industry Vertical
- 8.5.6.2. Middle East
- 8.5.6.2.1. Market size and forecast, by Component
- 8.5.6.2.2. Market size and forecast, by Deployment Type
- 8.5.6.2.3. Market size and forecast, by Enterprise Size
- 8.5.6.2.4. Market size and forecast, by Industry Vertical
- 8.5.6.3. Africa
- 8.5.6.3.1. Market size and forecast, by Component
- 8.5.6.3.2. Market size and forecast, by Deployment Type
- 8.5.6.3.3. Market size and forecast, by Enterprise Size
- 8.5.6.3.4. Market size and forecast, by Industry Vertical
CHAPTER 9: COMPETITIVE LANDSCAPE
- 9.1. Introduction
- 9.2. Top winning strategies
- 9.3. Product Mapping of Top 10 Player
- 9.4. Competitive Dashboard
- 9.5. Competitive Heatmap
- 9.6. Top player positioning, 2022
CHAPTER 10: COMPANY PROFILES
- 10.1. Altova
- 10.1.1. Company overview
- 10.1.2. Key Executives
- 10.1.3. Company snapshot
- 10.1.4. Operating business segments
- 10.1.5. Product portfolio
- 10.1.6. Key strategic moves and developments
- 10.2. NetBase Quid
- 10.2.1. Company overview
- 10.2.2. Key Executives
- 10.2.3. Company snapshot
- 10.2.4. Operating business segments
- 10.2.5. Product portfolio
- 10.2.6. Key strategic moves and developments
- 10.3. OpenLink Software Inc.
- 10.3.1. Company overview
- 10.3.2. Key Executives
- 10.3.3. Company snapshot
- 10.3.4. Operating business segments
- 10.3.5. Product portfolio
- 10.3.6. Key strategic moves and developments
- 10.4. Semantic Web Company
- 10.4.1. Company overview
- 10.4.2. Key Executives
- 10.4.3. Company snapshot
- 10.4.4. Operating business segments
- 10.4.5. Product portfolio
- 10.4.6. Key strategic moves and developments
- 10.5. Franz Inc.
- 10.5.1. Company overview
- 10.5.2. Key Executives
- 10.5.3. Company snapshot
- 10.5.4. Operating business segments
- 10.5.5. Product portfolio
- 10.5.6. Key strategic moves and developments
- 10.6. Microsoft Corporation
- 10.6.1. Company overview
- 10.6.2. Key Executives
- 10.6.3. Company snapshot
- 10.6.4. Operating business segments
- 10.6.5. Product portfolio
- 10.6.6. Business performance
- 10.6.7. Key strategic moves and developments
- 10.7. Cambridge Semantics
- 10.7.1. Company overview
- 10.7.2. Key Executives
- 10.7.3. Company snapshot
- 10.7.4. Operating business segments
- 10.7.5. Product portfolio
- 10.7.6. Key strategic moves and developments
- 10.8. Ontotext
- 10.8.1. Company overview
- 10.8.2. Key Executives
- 10.8.3. Company snapshot
- 10.8.4. Operating business segments
- 10.8.5. Product portfolio
- 10.8.6. Key strategic moves and developments
- 10.9. TopQuadrant
- 10.9.1. Company overview
- 10.9.2. Key Executives
- 10.9.3. Company snapshot
- 10.9.4. Operating business segments
- 10.9.5. Product portfolio
- 10.9.6. Key strategic moves and developments
- 10.10. Cycorp Inc.
- 10.10.1. Company overview
- 10.10.2. Key Executives
- 10.10.3. Company snapshot
- 10.10.4. Operating business segments
- 10.10.5. Product portfolio
LIST OF TABLES
- TABLE 01. GLOBAL SEMANTIC WEB MARKET, BY COMPONENT, 2022-2032 ($MILLION)
- TABLE 02. SEMANTIC WEB MARKET FOR SOLUTION, BY REGION, 2022-2032 ($MILLION)
- TABLE 03. SEMANTIC WEB MARKET FOR SERVICE, BY REGION, 2022-2032 ($MILLION)
- TABLE 04. GLOBAL SEMANTIC WEB MARKET, BY DEPLOYMENT TYPE, 2022-2032 ($MILLION)
- TABLE 05. SEMANTIC WEB MARKET FOR PUBLIC, BY REGION, 2022-2032 ($MILLION)
- TABLE 06. SEMANTIC WEB MARKET FOR PRIVATE, BY REGION, 2022-2032 ($MILLION)
- TABLE 07. SEMANTIC WEB MARKET FOR HYBRID, BY REGION, 2022-2032 ($MILLION)
- TABLE 08. GLOBAL SEMANTIC WEB MARKET, BY ENTERPRISE SIZE, 2022-2032 ($MILLION)
- TABLE 09. SEMANTIC WEB MARKET FOR LARGE ENTERPRISES, BY REGION, 2022-2032 ($MILLION)
- TABLE 10. SEMANTIC WEB MARKET FOR SMALL AND MEDIUM-SIZED ENTERPRISES, BY REGION, 2022-2032 ($MILLION)
- TABLE 11. GLOBAL SEMANTIC WEB MARKET, BY INDUSTRY VERTICAL, 2022-2032 ($MILLION)
- TABLE 12. SEMANTIC WEB MARKET FOR BFSI, BY REGION, 2022-2032 ($MILLION)
- TABLE 13. SEMANTIC WEB MARKET FOR IT AND TELECOM, BY REGION, 2022-2032 ($MILLION)
- TABLE 14. SEMANTIC WEB MARKET FOR RETAIL AND E-COMMERCE, BY REGION, 2022-2032 ($MILLION)
- TABLE 15. SEMANTIC WEB MARKET FOR HEALTHCARE AND LIFE SCIENCE, BY REGION, 2022-2032 ($MILLION)
- TABLE 16. SEMANTIC WEB MARKET FOR MEDIA AND PUBLISHING, BY REGION, 2022-2032 ($MILLION)
- TABLE 17. SEMANTIC WEB MARKET FOR GOVERNMENT AND PUBLIC SECTOR, BY REGION, 2022-2032 ($MILLION)
- TABLE 18. SEMANTIC WEB MARKET FOR EDUCATION, BY REGION, 2022-2032 ($MILLION)
- TABLE 19. SEMANTIC WEB MARKET FOR OTHERS, BY REGION, 2022-2032 ($MILLION)
- TABLE 20. SEMANTIC WEB MARKET, BY REGION, 2022-2032 ($MILLION)
- TABLE 21. NORTH AMERICA SEMANTIC WEB MARKET, BY COMPONENT, 2022-2032 ($MILLION)
- TABLE 22. NORTH AMERICA SEMANTIC WEB MARKET, BY DEPLOYMENT TYPE, 2022-2032 ($MILLION)
- TABLE 23. NORTH AMERICA SEMANTIC WEB MARKET, BY ENTERPRISE SIZE, 2022-2032 ($MILLION)
- TABLE 24. NORTH AMERICA SEMANTIC WEB MARKET, BY INDUSTRY VERTICAL, 2022-2032 ($MILLION)
- TABLE 25. NORTH AMERICA SEMANTIC WEB MARKET, BY COUNTRY, 2022-2032 ($MILLION)
- TABLE 26. U.S. SEMANTIC WEB MARKET, BY COMPONENT, 2022-2032 ($MILLION)
- TABLE 27. U.S. SEMANTIC WEB MARKET, BY DEPLOYMENT TYPE, 2022-2032 ($MILLION)
- TABLE 28. U.S. SEMANTIC WEB MARKET, BY ENTERPRISE SIZE, 2022-2032 ($MILLION)
- TABLE 29. U.S. SEMANTIC WEB MARKET, BY INDUSTRY VERTICAL, 2022-2032 ($MILLION)
- TABLE 30. CANADA SEMANTIC WEB MARKET, BY COMPONENT, 2022-2032 ($MILLION)
- TABLE 31. CANADA SEMANTIC WEB MARKET, BY DEPLOYMENT TYPE, 2022-2032 ($MILLION)
- TABLE 32. CANADA SEMANTIC WEB MARKET, BY ENTERPRISE SIZE, 2022-2032 ($MILLION)
- TABLE 33. CANADA SEMANTIC WEB MARKET, BY INDUSTRY VERTICAL, 2022-2032 ($MILLION)
- TABLE 34. EUROPE SEMANTIC WEB MARKET, BY COMPONENT, 2022-2032 ($MILLION)
- TABLE 35. EUROPE SEMANTIC WEB MARKET, BY DEPLOYMENT TYPE, 2022-2032 ($MILLION)
- TABLE 36. EUROPE SEMANTIC WEB MARKET, BY ENTERPRISE SIZE, 2022-2032 ($MILLION)
- TABLE 37. EUROPE SEMANTIC WEB MARKET, BY INDUSTRY VERTICAL, 2022-2032 ($MILLION)
- TABLE 38. EUROPE SEMANTIC WEB MARKET, BY COUNTRY, 2022-2032 ($MILLION)
- TABLE 39. UK SEMANTIC WEB MARKET, BY COMPONENT, 2022-2032 ($MILLION)
- TABLE 40. UK SEMANTIC WEB MARKET, BY DEPLOYMENT TYPE, 2022-2032 ($MILLION)
- TABLE 41. UK SEMANTIC WEB MARKET, BY ENTERPRISE SIZE, 2022-2032 ($MILLION)
- TABLE 42. UK SEMANTIC WEB MARKET, BY INDUSTRY VERTICAL, 2022-2032 ($MILLION)
- TABLE 43. GERMANY SEMANTIC WEB MARKET, BY COMPONENT, 2022-2032 ($MILLION)
- TABLE 44. GERMANY SEMANTIC WEB MARKET, BY DEPLOYMENT TYPE, 2022-2032 ($MILLION)
- TABLE 45. GERMANY SEMANTIC WEB MARKET, BY ENTERPRISE SIZE, 2022-2032 ($MILLION)
- TABLE 46. GERMANY SEMANTIC WEB MARKET, BY INDUSTRY VERTICAL, 2022-2032 ($MILLION)
- TABLE 47. FRANCE SEMANTIC WEB MARKET, BY COMPONENT, 2022-2032 ($MILLION)
- TABLE 48. FRANCE SEMANTIC WEB MARKET, BY DEPLOYMENT TYPE, 2022-2032 ($MILLION)
- TABLE 49. FRANCE SEMANTIC WEB MARKET, BY ENTERPRISE SIZE, 2022-2032 ($MILLION)
- TABLE 50. FRANCE SEMANTIC WEB MARKET, BY INDUSTRY VERTICAL, 2022-2032 ($MILLION)
- TABLE 51. ITALY SEMANTIC WEB MARKET, BY COMPONENT, 2022-2032 ($MILLION)
- TABLE 52. ITALY SEMANTIC WEB MARKET, BY DEPLOYMENT TYPE, 2022-2032 ($MILLION)
- TABLE 53. ITALY SEMANTIC WEB MARKET, BY ENTERPRISE SIZE, 2022-2032 ($MILLION)
- TABLE 54. ITALY SEMANTIC WEB MARKET, BY INDUSTRY VERTICAL, 2022-2032 ($MILLION)
- TABLE 55. SPAIN SEMANTIC WEB MARKET, BY COMPONENT, 2022-2032 ($MILLION)
- TABLE 56. SPAIN SEMANTIC WEB MARKET, BY DEPLOYMENT TYPE, 2022-2032 ($MILLION)
- TABLE 57. SPAIN SEMANTIC WEB MARKET, BY ENTERPRISE SIZE, 2022-2032 ($MILLION)
- TABLE 58. SPAIN SEMANTIC WEB MARKET, BY INDUSTRY VERTICAL, 2022-2032 ($MILLION)
- TABLE 59. REST OF EUROPE SEMANTIC WEB MARKET, BY COMPONENT, 2022-2032 ($MILLION)
- TABLE 60. REST OF EUROPE SEMANTIC WEB MARKET, BY DEPLOYMENT TYPE, 2022-2032 ($MILLION)
- TABLE 61. REST OF EUROPE SEMANTIC WEB MARKET, BY ENTERPRISE SIZE, 2022-2032 ($MILLION)
- TABLE 62. REST OF EUROPE SEMANTIC WEB MARKET, BY INDUSTRY VERTICAL, 2022-2032 ($MILLION)
- TABLE 63. ASIA-PACIFIC SEMANTIC WEB MARKET, BY COMPONENT, 2022-2032 ($MILLION)
- TABLE 64. ASIA-PACIFIC SEMANTIC WEB MARKET, BY DEPLOYMENT TYPE, 2022-2032 ($MILLION)
- TABLE 65. ASIA-PACIFIC SEMANTIC WEB MARKET, BY ENTERPRISE SIZE, 2022-2032 ($MILLION)
- TABLE 66. ASIA-PACIFIC SEMANTIC WEB MARKET, BY INDUSTRY VERTICAL, 2022-2032 ($MILLION)
- TABLE 67. ASIA-PACIFIC SEMANTIC WEB MARKET, BY COUNTRY, 2022-2032 ($MILLION)
- TABLE 68. CHINA SEMANTIC WEB MARKET, BY COMPONENT, 2022-2032 ($MILLION)
- TABLE 69. CHINA SEMANTIC WEB MARKET, BY DEPLOYMENT TYPE, 2022-2032 ($MILLION)
- TABLE 70. CHINA SEMANTIC WEB MARKET, BY ENTERPRISE SIZE, 2022-2032 ($MILLION)
- TABLE 71. CHINA SEMANTIC WEB MARKET, BY INDUSTRY VERTICAL, 2022-2032 ($MILLION)
- TABLE 72. JAPAN SEMANTIC WEB MARKET, BY COMPONENT, 2022-2032 ($MILLION)
- TABLE 73. JAPAN SEMANTIC WEB MARKET, BY DEPLOYMENT TYPE, 2022-2032 ($MILLION)
- TABLE 74. JAPAN SEMANTIC WEB MARKET, BY ENTERPRISE SIZE, 2022-2032 ($MILLION)
- TABLE 75. JAPAN SEMANTIC WEB MARKET, BY INDUSTRY VERTICAL, 2022-2032 ($MILLION)
- TABLE 76. INDIA SEMANTIC WEB MARKET, BY COMPONENT, 2022-2032 ($MILLION)
- TABLE 77. INDIA SEMANTIC WEB MARKET, BY DEPLOYMENT TYPE, 2022-2032 ($MILLION)
- TABLE 78. INDIA SEMANTIC WEB MARKET, BY ENTERPRISE SIZE, 2022-2032 ($MILLION)
- TABLE 79. INDIA SEMANTIC WEB MARKET, BY INDUSTRY VERTICAL, 2022-2032 ($MILLION)
- TABLE 80. AUSTRALIA SEMANTIC WEB MARKET, BY COMPONENT, 2022-2032 ($MILLION)
- TABLE 81. AUSTRALIA SEMANTIC WEB MARKET, BY DEPLOYMENT TYPE, 2022-2032 ($MILLION)
- TABLE 82. AUSTRALIA SEMANTIC WEB MARKET, BY ENTERPRISE SIZE, 2022-2032 ($MILLION)
- TABLE 83. AUSTRALIA SEMANTIC WEB MARKET, BY INDUSTRY VERTICAL, 2022-2032 ($MILLION)
- TABLE 84. SOUTH KOREA SEMANTIC WEB MARKET, BY COMPONENT, 2022-2032 ($MILLION)
- TABLE 85. SOUTH KOREA SEMANTIC WEB MARKET, BY DEPLOYMENT TYPE, 2022-2032 ($MILLION)
- TABLE 86. SOUTH KOREA SEMANTIC WEB MARKET, BY ENTERPRISE SIZE, 2022-2032 ($MILLION)
- TABLE 87. SOUTH KOREA SEMANTIC WEB MARKET, BY INDUSTRY VERTICAL, 2022-2032 ($MILLION)
- TABLE 88. REST OF ASIA-PACIFIC SEMANTIC WEB MARKET, BY COMPONENT, 2022-2032 ($MILLION)
- TABLE 89. REST OF ASIA-PACIFIC SEMANTIC WEB MARKET, BY DEPLOYMENT TYPE, 2022-2032 ($MILLION)
- TABLE 90. REST OF ASIA-PACIFIC SEMANTIC WEB MARKET, BY ENTERPRISE SIZE, 2022-2032 ($MILLION)
- TABLE 91. REST OF ASIA-PACIFIC SEMANTIC WEB MARKET, BY INDUSTRY VERTICAL, 2022-2032 ($MILLION)
- TABLE 92. LAMEA SEMANTIC WEB MARKET, BY COMPONENT, 2022-2032 ($MILLION)
- TABLE 93. LAMEA SEMANTIC WEB MARKET, BY DEPLOYMENT TYPE, 2022-2032 ($MILLION)
- TABLE 94. LAMEA SEMANTIC WEB MARKET, BY ENTERPRISE SIZE, 2022-2032 ($MILLION)
- TABLE 95. LAMEA SEMANTIC WEB MARKET, BY INDUSTRY VERTICAL, 2022-2032 ($MILLION)
- TABLE 96. LAMEA SEMANTIC WEB MARKET, BY COUNTRY, 2022-2032 ($MILLION)
- TABLE 97. LATIN AMERICA SEMANTIC WEB MARKET, BY COMPONENT, 2022-2032 ($MILLION)
- TABLE 98. LATIN AMERICA SEMANTIC WEB MARKET, BY DEPLOYMENT TYPE, 2022-2032 ($MILLION)
- TABLE 99. LATIN AMERICA SEMANTIC WEB MARKET, BY ENTERPRISE SIZE, 2022-2032 ($MILLION)
- TABLE 100. LATIN AMERICA SEMANTIC WEB MARKET, BY INDUSTRY VERTICAL, 2022-2032 ($MILLION)
- TABLE 101. MIDDLE EAST SEMANTIC WEB MARKET, BY COMPONENT, 2022-2032 ($MILLION)
- TABLE 102. MIDDLE EAST SEMANTIC WEB MARKET, BY DEPLOYMENT TYPE, 2022-2032 ($MILLION)
- TABLE 103. MIDDLE EAST SEMANTIC WEB MARKET, BY ENTERPRISE SIZE, 2022-2032 ($MILLION)
- TABLE 104. MIDDLE EAST SEMANTIC WEB MARKET, BY INDUSTRY VERTICAL, 2022-2032 ($MILLION)
- TABLE 105. AFRICA SEMANTIC WEB MARKET, BY COMPONENT, 2022-2032 ($MILLION)
- TABLE 106. AFRICA SEMANTIC WEB MARKET, BY DEPLOYMENT TYPE, 2022-2032 ($MILLION)
- TABLE 107. AFRICA SEMANTIC WEB MARKET, BY ENTERPRISE SIZE, 2022-2032 ($MILLION)
- TABLE 108. AFRICA SEMANTIC WEB MARKET, BY INDUSTRY VERTICAL, 2022-2032 ($MILLION)
- TABLE 109. ALTOVA: KEY EXECUTIVES
- TABLE 110. ALTOVA: COMPANY SNAPSHOT
- TABLE 111. ALTOVA: SERVICE SEGMENTS
- TABLE 112. ALTOVA: PRODUCT PORTFOLIO
- TABLE 113. ALTOVA: KEY STRATERGIES
- TABLE 114. NETBASE QUID: KEY EXECUTIVES
- TABLE 115. NETBASE QUID: COMPANY SNAPSHOT
- TABLE 116. NETBASE QUID: SERVICE SEGMENTS
- TABLE 117. NETBASE QUID: PRODUCT PORTFOLIO
- TABLE 118. NETBASE QUID: KEY STRATERGIES
- TABLE 119. OPENLINK SOFTWARE INC.: KEY EXECUTIVES
- TABLE 120. OPENLINK SOFTWARE INC.: COMPANY SNAPSHOT
- TABLE 121. OPENLINK SOFTWARE INC.: SERVICE SEGMENTS
- TABLE 122. OPENLINK SOFTWARE INC.: PRODUCT PORTFOLIO
- TABLE 123. OPENLINK SOFTWARE INC.: KEY STRATERGIES
- TABLE 124. SEMANTIC WEB COMPANY: KEY EXECUTIVES
- TABLE 125. SEMANTIC WEB COMPANY: COMPANY SNAPSHOT
- TABLE 126. SEMANTIC WEB COMPANY: SERVICE SEGMENTS
- TABLE 127. SEMANTIC WEB COMPANY: PRODUCT PORTFOLIO
- TABLE 128. SEMANTIC WEB COMPANY: KEY STRATERGIES
- TABLE 129. FRANZ INC.: KEY EXECUTIVES
- TABLE 130. FRANZ INC.: COMPANY SNAPSHOT
- TABLE 131. FRANZ INC.: SERVICE SEGMENTS
- TABLE 132. FRANZ INC.: PRODUCT PORTFOLIO
- TABLE 133. FRANZ INC.: KEY STRATERGIES
- TABLE 134. MICROSOFT CORPORATION: KEY EXECUTIVES
- TABLE 135. MICROSOFT CORPORATION: COMPANY SNAPSHOT
- TABLE 136. MICROSOFT CORPORATION: SERVICE SEGMENTS
- TABLE 137. MICROSOFT CORPORATION: PRODUCT PORTFOLIO
- TABLE 138. MICROSOFT CORPORATION: KEY STRATERGIES
- TABLE 139. CAMBRIDGE SEMANTICS: KEY EXECUTIVES
- TABLE 140. CAMBRIDGE SEMANTICS: COMPANY SNAPSHOT
- TABLE 141. CAMBRIDGE SEMANTICS: SERVICE SEGMENTS
- TABLE 142. CAMBRIDGE SEMANTICS: PRODUCT PORTFOLIO
- TABLE 143. CAMBRIDGE SEMANTICS: KEY STRATERGIES
- TABLE 144. ONTOTEXT: KEY EXECUTIVES
- TABLE 145. ONTOTEXT: COMPANY SNAPSHOT
- TABLE 146. ONTOTEXT: SERVICE SEGMENTS
- TABLE 147. ONTOTEXT: PRODUCT PORTFOLIO
- TABLE 148. ONTOTEXT: KEY STRATERGIES
- TABLE 149. TOPQUADRANT: KEY EXECUTIVES
- TABLE 150. TOPQUADRANT: COMPANY SNAPSHOT
- TABLE 151. TOPQUADRANT: SERVICE SEGMENTS
- TABLE 152. TOPQUADRANT: PRODUCT PORTFOLIO
- TABLE 153. TOPQUADRANT: KEY STRATERGIES
- TABLE 154. CYCORP INC.: KEY EXECUTIVES
- TABLE 155. CYCORP INC.: COMPANY SNAPSHOT
- TABLE 156. CYCORP INC.: SERVICE SEGMENTS
- TABLE 157. CYCORP INC.: PRODUCT PORTFOLIO
LIST OF FIGURES
- FIGURE 01. SEMANTIC WEB MARKET, 2022-2032
- FIGURE 02. SEGMENTATION OF SEMANTIC WEB MARKET,2022-2032
- FIGURE 03. TOP INVESTMENT POCKETS IN SEMANTIC WEB MARKET (2023-2032)
- FIGURE 04. MOERATE BARGAINING POWER OF SUPPLIERS
- FIGURE 05. LOW-TO-HIGH THREAT OF NEW ENTRANTS
- FIGURE 06. MODERATE THREAT OF SUBSTITUTES
- FIGURE 07. MODERATE INTENSITY OF RIVALRY
- FIGURE 08. MODERATE BARGAINING POWER OF BUYERS
- FIGURE 09. GLOBAL SEMANTIC WEB MARKET:DRIVERS, RESTRAINTS AND OPPORTUNITIES
- FIGURE 10. IMPACT OF KEY REGULATION: SEMANTIC WEB MARKET
- FIGURE 11. SEMANTIC WEB MARKET, BY COMPONENT, 2022(%)
- FIGURE 12. COMPARATIVE SHARE ANALYSIS OF SEMANTIC WEB MARKET FOR SOLUTION, BY COUNTRY 2022 AND 2032(%)
- FIGURE 13. COMPARATIVE SHARE ANALYSIS OF SEMANTIC WEB MARKET FOR SERVICE, BY COUNTRY 2022 AND 2032(%)
- FIGURE 14. SEMANTIC WEB MARKET, BY DEPLOYMENT TYPE, 2022(%)
- FIGURE 15. COMPARATIVE SHARE ANALYSIS OF SEMANTIC WEB MARKET FOR PUBLIC, BY COUNTRY 2022 AND 2032(%)
- FIGURE 16. COMPARATIVE SHARE ANALYSIS OF SEMANTIC WEB MARKET FOR PRIVATE, BY COUNTRY 2022 AND 2032(%)
- FIGURE 17. COMPARATIVE SHARE ANALYSIS OF SEMANTIC WEB MARKET FOR HYBRID, BY COUNTRY 2022 AND 2032(%)
- FIGURE 18. SEMANTIC WEB MARKET, BY ENTERPRISE SIZE, 2022(%)
- FIGURE 19. COMPARATIVE SHARE ANALYSIS OF SEMANTIC WEB MARKET FOR LARGE ENTERPRISES, BY COUNTRY 2022 AND 2032(%)
- FIGURE 20. COMPARATIVE SHARE ANALYSIS OF SEMANTIC WEB MARKET FOR SMALL AND MEDIUM-SIZED ENTERPRISES, BY COUNTRY 2022 AND 2032(%)
- FIGURE 21. SEMANTIC WEB MARKET, BY INDUSTRY VERTICAL, 2022(%)
- FIGURE 22. COMPARATIVE SHARE ANALYSIS OF SEMANTIC WEB MARKET FOR BFSI, BY COUNTRY 2022 AND 2032(%)
- FIGURE 23. COMPARATIVE SHARE ANALYSIS OF SEMANTIC WEB MARKET FOR IT AND TELECOM, BY COUNTRY 2022 AND 2032(%)
- FIGURE 24. COMPARATIVE SHARE ANALYSIS OF SEMANTIC WEB MARKET FOR RETAIL AND E-COMMERCE, BY COUNTRY 2022 AND 2032(%)
- FIGURE 25. COMPARATIVE SHARE ANALYSIS OF SEMANTIC WEB MARKET FOR HEALTHCARE AND LIFE SCIENCE, BY COUNTRY 2022 AND 2032(%)
- FIGURE 26. COMPARATIVE SHARE ANALYSIS OF SEMANTIC WEB MARKET FOR MEDIA AND PUBLISHING, BY COUNTRY 2022 AND 2032(%)
- FIGURE 27. COMPARATIVE SHARE ANALYSIS OF SEMANTIC WEB MARKET FOR GOVERNMENT AND PUBLIC SECTOR, BY COUNTRY 2022 AND 2032(%)
- FIGURE 28. COMPARATIVE SHARE ANALYSIS OF SEMANTIC WEB MARKET FOR EDUCATION, BY COUNTRY 2022 AND 2032(%)
- FIGURE 29. COMPARATIVE SHARE ANALYSIS OF SEMANTIC WEB MARKET FOR OTHERS, BY COUNTRY 2022 AND 2032(%)
- FIGURE 30. SEMANTIC WEB MARKET BY REGION, 2022(%)
- FIGURE 31. U.S. SEMANTIC WEB MARKET, 2022-2032 ($MILLION)
- FIGURE 32. CANADA SEMANTIC WEB MARKET, 2022-2032 ($MILLION)
- FIGURE 33. UK SEMANTIC WEB MARKET, 2022-2032 ($MILLION)
- FIGURE 34. GERMANY SEMANTIC WEB MARKET, 2022-2032 ($MILLION)
- FIGURE 35. FRANCE SEMANTIC WEB MARKET, 2022-2032 ($MILLION)
- FIGURE 36. ITALY SEMANTIC WEB MARKET, 2022-2032 ($MILLION)
- FIGURE 37. SPAIN SEMANTIC WEB MARKET, 2022-2032 ($MILLION)
- FIGURE 38. REST OF EUROPE SEMANTIC WEB MARKET, 2022-2032 ($MILLION)
- FIGURE 39. CHINA SEMANTIC WEB MARKET, 2022-2032 ($MILLION)
- FIGURE 40. JAPAN SEMANTIC WEB MARKET, 2022-2032 ($MILLION)
- FIGURE 41. INDIA SEMANTIC WEB MARKET, 2022-2032 ($MILLION)
- FIGURE 42. AUSTRALIA SEMANTIC WEB MARKET, 2022-2032 ($MILLION)
- FIGURE 43. SOUTH KOREA SEMANTIC WEB MARKET, 2022-2032 ($MILLION)
- FIGURE 44. REST OF ASIA-PACIFIC SEMANTIC WEB MARKET, 2022-2032 ($MILLION)
- FIGURE 45. LATIN AMERICA SEMANTIC WEB MARKET, 2022-2032 ($MILLION)
- FIGURE 46. MIDDLE EAST SEMANTIC WEB MARKET, 2022-2032 ($MILLION)
- FIGURE 47. AFRICA SEMANTIC WEB MARKET, 2022-2032 ($MILLION)
- FIGURE 48. TOP WINNING STRATEGIES, BY YEAR (2020-2023)
- FIGURE 49. TOP WINNING STRATEGIES, BY DEVELOPMENT (2020-2023)
- FIGURE 50. TOP WINNING STRATEGIES, BY COMPANY (2020-2023)
- FIGURE 51. PRODUCT MAPPING OF TOP 10 PLAYERS
- FIGURE 52. COMPETITIVE DASHBOARD
- FIGURE 53. COMPETITIVE HEATMAP: SEMANTIC WEB MARKET
- FIGURE 54. TOP PLAYER POSITIONING, 2022
- FIGURE 55. MICROSOFT CORPORATION: NET REVENUE, 2020-2022 ($MILLION)
- FIGURE 56. MICROSOFT CORPORATION: RESEARCH & DEVELOPMENT EXPENDITURE, 2020-2022 ($MILLION)
- FIGURE 57. MICROSOFT CORPORATION: REVENUE SHARE BY SEGMENT, 2022 (%)
- FIGURE 58. MICROSOFT CORPORATION: REVENUE SHARE BY REGION, 2022 (%)
 比價網站(PCW)市場:現況分析與預測(2023-2030)
 投資者網站建立軟體市場報告:2030 年趨勢、預測與競爭分析
 語意網市場報告:2030 年趨勢、預測與競爭分析
 網站創建工具市場、份額、規模、趨勢、行業分析報告:按類型、部署類型、應用程式、區域、細分市場進行預測,2023-2032 年
 2024 年網路內容、搜尋網站和社群媒體全球市場報告
 語意網全球市場規模、佔有率和行業趨勢分析報告:2023-2030 年按組件、部署類型、公司規模、行業和地區分類的展望和預測
 網站架設器的全球市場
 網站建立器市場:按類型(行動網站建立器、PC 網站建構器)、按部署(雲端基礎、本地)、最終用戶 - 2023-2030 年全球預測
 視覺內容的全球市場:2023年 - 客製化版
 視覺內容的全球市場 2022-2026