


 |
市場調查報告書
商品編碼
1365750
建築骨材市場:按類型、用途和運輸方式分類:2023-2032 年全球機會分析和產業預測Construction Aggregates Market By Type (Crushed Stone, Sand and Gravel), By Application (Non-Residential, Residential), By Transportation Mode (Truck, Train, Ship): Global Opportunity Analysis and Industry Forecast, 2023-2032 |
||||||
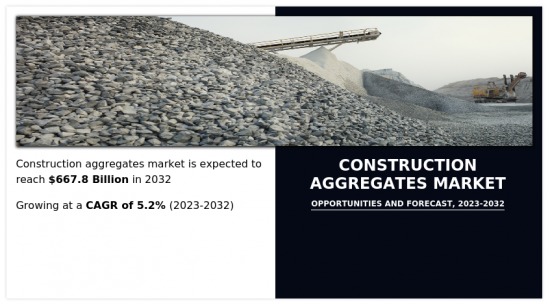
2021年建築骨材市場規模為3,753億美元,預估2023年至2032年年複合成長率為5.2%,2032年達6,678億美元。
建築骨材是一種廣泛使用的建築材料。它是通過將大石頭粉碎成小塊製成的。骨材主要含有碎石和沙子,用作混凝土的主要成分,也用作地基、道路建設等的填充材。
住宅、公寓和職場建設的增加增加了人們對產品的需求,從而導致市場成長。政府參與住宅開發以及旅遊和旅遊活動有助於增加建材的使用。骨材也用於混凝土中以減少裂縫,最重要的是用於結構加固。旅遊業的擴張,特別是旅遊項目開拓投資的增加,預計將支持建材市場的擴張。因此,建材市場預計將隨著旅遊的成長而擴大。
全球建材市場按類型、用途、運輸方式及地區細分。按類型分類,市場分為碎石和沙/礫石。依用途分為住宅用和非住宅用。依運輸方式分為汽車、火車、輪船。依地區分類,北美(美國、加拿大、墨西哥)、歐洲(英國、法國、德國、義大利等歐洲地區)、亞太地區(中國、日本、印度、韓國等亞太地區)、及拉丁美洲(拉丁美洲)、中東和非洲)並分析了全球建築骨材市場。
目錄
第1章 簡介
第2章 執行摘要
第3章 市場概況
- 市場定義和範圍
- 主要發現
- 影響要素
- 主要投資機會
- 波特五力分析
- 市場動態
- 促進因素
- 建築和基礎設施行業的成長
- 官民合作關係(PPP) 日益受到關注
- 施工機械技術進步
- 抑制因素
- 初期投資高
- 政府對建設產業的嚴格法規
- 機會
- 對永續性的配合措施不斷增強
- 促進因素
- COVID-19 市場影響分析
第4章 建築骨材市場:依類型
- 概述
- 碎石
- 沙子/礫石
第5章 建築骨材市場:依用途
- 概述
- 非住宅
- 住宅
第6章 建築碎石市場:依運輸方式
- 概述
- 卡車
- 火車
- 船
第7章 建築碎石市場:按地區
- 概述
- 北美洲
- 美國
- 加拿大
- 墨西哥
- 歐洲
- 德國
- 英國
- 法國
- 義大利
- 其他
- 亞太地區
- 中國
- 日本
- 韓國
- 印度
- 其他
- 拉丁美洲
- 拉丁美洲
- 中東
- 非洲
第8章 競爭形勢
- 介紹
- 關鍵成功策略
- 10家主要企業產品圖譜
- 競爭儀表板
- 競爭熱圖
- 2021年主要企業定位
第9章 公司簡介
- Holcim Ltd.
- Vicat SA
- Adelaide Brighton Ltd.
- Rogers Group Inc.
- CEMEX SAB de CV
- HeidelbergCement AG
- Sika AG
- Martin Marietta Materials Inc.
- Vulcan Materials Company
- CRH
According to a new report published by Allied Market Research, titled, "Construction Aggregates Market," The construction aggregates market was valued at $375.3 billion in 2021, and is estimated to reach $667.8 billion by 2032, growing at a CAGR of 5.2% from 2023 to 2032. Construction aggregate is a widely used construction material. It is made by crushing larger stones into small pieces or fine particles. Aggregates which primarily include crushed stones or sand are used as a primary ingredient in concrete and are also used as filler materials in foundations, road construction, and others.
The rise in the construction of houses, apartments, and workplaces led to the growth of the market, owing to the rise in product demand from the population. The involvement of governments in housing developments as well as travel and tourist activities help to increase building aggregate usage. They are also used in concrete to decrease cracks and, most significantly, to strengthen the structure. The expanding tourist industry is expected to boost expansion of the construction aggregate market, especially when combined with greater investments in the development of tourist projects. As a result, the building aggregate market is predicted to increase with growth in the travel and tourist industry.
The global construction aggregates market is segmented on the basis of type, application, transportation method, and region. On the basis of type, the market is segmented into crushed stone and sand & gravel. By application, it is segmented into residential and non-residential. As per transportation method, it is segmented into trucks, trains, and ships. Region wise, the global construction aggregates market analysis is conducted across North America (the U.S., Canada, and Mexico), Europe (the UK, France, Germany, Italy, and rest of Europe), Asia-Pacific (China, Japan, India, South Korea, and rest of Asia-Pacific), and LAMEA (Latin America, the Middle East, and Africa).
Competition Analysis
Key companies profiled in the construction aggregates market report include Adelaide Brighton Ltd., CEMEX S.A.B. de C.V., CRH plc, Heidelberg Cement AG, HOLCIM, Martin Marietta Materials Inc., ROGERS GROUP INC., SIKA Group, Vicat SA, and Vulcan Materials Company. The major players that operate in the global market have adopted key strategies such as acquisition, business expansion, product launch, and other strategies to strengthen their market outreach and sustain the stiff competition in the market.
Key benefits for stakeholders
- The report provides an extensive analysis of the current and emerging construction aggregates market trends and dynamics.
- In-depth market analysis is conducted by constructing market estimations for the key market segments between 2021 and 2032.
- Extensive analysis of the construction aggregates market is conducted by following key product positioning and monitoring of the top competitors within the market framework.
- A comprehensive analysis of all regions is provided to determine the prevailing opportunities.
- The global construction aggregates market forecast analysis from 2023 to 2032 is included in the report.
Additional benefits you will get with this purchase are:
- Quarterly Update and* (only available with a corporate license, on listed price)
- 5 additional Company Profile of client Choice pre- or Post-purchase, as a free update.
- Free Upcoming Version on the Purchase of Five and Enterprise User License.
- 16 analyst hours of support* (post-purchase, if you find additional data requirements upon review of the report, you may receive support amounting to 16 analyst hours to solve questions, and post-sale queries)
- 15% Free Customization* (in case the scope or segment of the report does not match your requirements, 20% is equivalent to 3 working days of free work, applicable once)
- Free data Pack on the Five and Enterprise User License. (Excel version of the report)
- Free Updated report if the report is 6-12 months old or older.
- 24-hour priority response*
- Free Industry updates and white papers.
Possible Customization with this report (with additional cost and timeline talk to the sales executive to know more)
- End user preferences and pain points
- Go To Market Strategy
- Market share analysis of players by products/segments
- Additional company profiles with specific to client's interest
- Additional country or region analysis- market size and forecast
- Average Selling Price Analysis / Price Point Analysis
- Brands Share Analysis
- Criss-cross segment analysis- market size and forecast
- Expanded list for Company Profiles
- Historic market data
- Market share analysis of players at global/region/country level
- SWOT Analysis
- Volume Market Size and Forecast
Key Market Segments
By Type
- Crushed Stone
- Sand and Gravel
By Application
- Non-Residential
- Residential
By Transportation Mode
- Truck
- Train
- Ship
By Region
- North America
- U.S.
- Canada
- Mexico
- Europe
- Germany
- UK
- France
- Italy
- Rest of Europe
- Asia-Pacific
- China
- Japan
- South Korea
- India
- Rest of Asia-Pacific
- LAMEA
- Latin America
- Middle East
- Africa
Key Market Players:
- Rogers Group Inc.
- Holcim Ltd.
- Adelaide Brighton Ltd.
- CEMEX S.A.B. de C.V.
- Sika AG
- Vulcan Materials Company
- CRH
- Vicat SA
- HeidelbergCement AG
- Martin Marietta Materials Inc.
TABLE OF CONTENTS
CHAPTER 1: INTRODUCTION
- 1.1. Report description
- 1.2. Key market segments
- 1.3. Key benefits to the stakeholders
- 1.4. Research Methodology
- 1.4.1. Primary research
- 1.4.2. Secondary research
- 1.4.3. Analyst tools and models
CHAPTER 2: EXECUTIVE SUMMARY
- 2.1. CXO Perspective
CHAPTER 3: MARKET OVERVIEW
- 3.1. Market definition and scope
- 3.2. Key findings
- 3.2.1. Top impacting factors
- 3.2.2. Top investment pockets
- 3.3. Porter's five forces analysis
- 3.3.1. Low bargaining power of suppliers
- 3.3.2. Low threat of new entrants
- 3.3.3. Low threat of substitutes
- 3.3.4. Low intensity of rivalry
- 3.3.5. Low bargaining power of buyers
- 3.4. Market dynamics
- 3.4.1. Drivers
- 3.4.1.1. Rise in construction & infrastructure industry
- 3.4.1.2. Growth in focus on public-private partnerships (PPP)
- 3.4.1.3. Technological advancements in construction machinery
- 3.4.1. Drivers
- 3.4.2. Restraints
- 3.4.2.1. High initial investments
- 3.4.2.2. Strict government regulations in construction industry
- 3.4.3. Opportunities
- 3.4.3.1. Rise in efforts toward sustainability
- 3.5. COVID-19 Impact Analysis on the market
CHAPTER 4: CONSTRUCTION AGGREGATES MARKET, BY TYPE
- 4.1. Overview
- 4.1.1. Market size and forecast
- 4.2. Crushed Stone
- 4.2.1. Key market trends, growth factors and opportunities
- 4.2.2. Market size and forecast, by region
- 4.2.3. Market share analysis by country
- 4.3. Sand and Gravel
- 4.3.1. Key market trends, growth factors and opportunities
- 4.3.2. Market size and forecast, by region
- 4.3.3. Market share analysis by country
CHAPTER 5: CONSTRUCTION AGGREGATES MARKET, BY APPLICATION
- 5.1. Overview
- 5.1.1. Market size and forecast
- 5.2. Non-Residential
- 5.2.1. Key market trends, growth factors and opportunities
- 5.2.2. Market size and forecast, by region
- 5.2.3. Market share analysis by country
- 5.3. Residential
- 5.3.1. Key market trends, growth factors and opportunities
- 5.3.2. Market size and forecast, by region
- 5.3.3. Market share analysis by country
CHAPTER 6: CONSTRUCTION AGGREGATES MARKET, BY TRANSPORTATION MODE
- 6.1. Overview
- 6.1.1. Market size and forecast
- 6.2. Truck
- 6.2.1. Key market trends, growth factors and opportunities
- 6.2.2. Market size and forecast, by region
- 6.2.3. Market share analysis by country
- 6.3. Train
- 6.3.1. Key market trends, growth factors and opportunities
- 6.3.2. Market size and forecast, by region
- 6.3.3. Market share analysis by country
- 6.4. Ship
- 6.4.1. Key market trends, growth factors and opportunities
- 6.4.2. Market size and forecast, by region
- 6.4.3. Market share analysis by country
CHAPTER 7: CONSTRUCTION AGGREGATES MARKET, BY REGION
- 7.1. Overview
- 7.1.1. Market size and forecast By Region
- 7.2. North America
- 7.2.1. Key market trends, growth factors and opportunities
- 7.2.2. Market size and forecast, by Type
- 7.2.3. Market size and forecast, by Application
- 7.2.4. Market size and forecast, by Transportation Mode
- 7.2.5. Market size and forecast, by country
- 7.2.5.1. U.S.
- 7.2.5.1.1. Market size and forecast, by Type
- 7.2.5.1.2. Market size and forecast, by Application
- 7.2.5.1.3. Market size and forecast, by Transportation Mode
- 7.2.5.2. Canada
- 7.2.5.2.1. Market size and forecast, by Type
- 7.2.5.2.2. Market size and forecast, by Application
- 7.2.5.2.3. Market size and forecast, by Transportation Mode
- 7.2.5.3. Mexico
- 7.2.5.3.1. Market size and forecast, by Type
- 7.2.5.3.2. Market size and forecast, by Application
- 7.2.5.3.3. Market size and forecast, by Transportation Mode
- 7.3. Europe
- 7.3.1. Key market trends, growth factors and opportunities
- 7.3.2. Market size and forecast, by Type
- 7.3.3. Market size and forecast, by Application
- 7.3.4. Market size and forecast, by Transportation Mode
- 7.3.5. Market size and forecast, by country
- 7.3.5.1. Germany
- 7.3.5.1.1. Market size and forecast, by Type
- 7.3.5.1.2. Market size and forecast, by Application
- 7.3.5.1.3. Market size and forecast, by Transportation Mode
- 7.3.5.2. UK
- 7.3.5.2.1. Market size and forecast, by Type
- 7.3.5.2.2. Market size and forecast, by Application
- 7.3.5.2.3. Market size and forecast, by Transportation Mode
- 7.3.5.3. France
- 7.3.5.3.1. Market size and forecast, by Type
- 7.3.5.3.2. Market size and forecast, by Application
- 7.3.5.3.3. Market size and forecast, by Transportation Mode
- 7.3.5.4. Italy
- 7.3.5.4.1. Market size and forecast, by Type
- 7.3.5.4.2. Market size and forecast, by Application
- 7.3.5.4.3. Market size and forecast, by Transportation Mode
- 7.3.5.5. Rest of Europe
- 7.3.5.5.1. Market size and forecast, by Type
- 7.3.5.5.2. Market size and forecast, by Application
- 7.3.5.5.3. Market size and forecast, by Transportation Mode
- 7.4. Asia-Pacific
- 7.4.1. Key market trends, growth factors and opportunities
- 7.4.2. Market size and forecast, by Type
- 7.4.3. Market size and forecast, by Application
- 7.4.4. Market size and forecast, by Transportation Mode
- 7.4.5. Market size and forecast, by country
- 7.4.5.1. China
- 7.4.5.1.1. Market size and forecast, by Type
- 7.4.5.1.2. Market size and forecast, by Application
- 7.4.5.1.3. Market size and forecast, by Transportation Mode
- 7.4.5.2. Japan
- 7.4.5.2.1. Market size and forecast, by Type
- 7.4.5.2.2. Market size and forecast, by Application
- 7.4.5.2.3. Market size and forecast, by Transportation Mode
- 7.4.5.3. South Korea
- 7.4.5.3.1. Market size and forecast, by Type
- 7.4.5.3.2. Market size and forecast, by Application
- 7.4.5.3.3. Market size and forecast, by Transportation Mode
- 7.4.5.4. India
- 7.4.5.4.1. Market size and forecast, by Type
- 7.4.5.4.2. Market size and forecast, by Application
- 7.4.5.4.3. Market size and forecast, by Transportation Mode
- 7.4.5.5. Rest of Asia-Pacific
- 7.4.5.5.1. Market size and forecast, by Type
- 7.4.5.5.2. Market size and forecast, by Application
- 7.4.5.5.3. Market size and forecast, by Transportation Mode
- 7.5. LAMEA
- 7.5.1. Key market trends, growth factors and opportunities
- 7.5.2. Market size and forecast, by Type
- 7.5.3. Market size and forecast, by Application
- 7.5.4. Market size and forecast, by Transportation Mode
- 7.5.5. Market size and forecast, by country
- 7.5.5.1. Latin America
- 7.5.5.1.1. Market size and forecast, by Type
- 7.5.5.1.2. Market size and forecast, by Application
- 7.5.5.1.3. Market size and forecast, by Transportation Mode
- 7.5.5.2. Middle East
- 7.5.5.2.1. Market size and forecast, by Type
- 7.5.5.2.2. Market size and forecast, by Application
- 7.5.5.2.3. Market size and forecast, by Transportation Mode
- 7.5.5.3. Africa
- 7.5.5.3.1. Market size and forecast, by Type
- 7.5.5.3.2. Market size and forecast, by Application
- 7.5.5.3.3. Market size and forecast, by Transportation Mode
CHAPTER 8: COMPETITIVE LANDSCAPE
- 8.1. Introduction
- 8.2. Top winning strategies
- 8.3. Product Mapping of Top 10 Player
- 8.4. Competitive Dashboard
- 8.5. Competitive Heatmap
- 8.6. Top player positioning, 2021
CHAPTER 9: COMPANY PROFILES
- 9.1. Holcim Ltd.
- 9.1.1. Company overview
- 9.1.2. Key Executives
- 9.1.3. Company snapshot
- 9.1.4. Operating business segments
- 9.1.5. Product portfolio
- 9.1.6. Business performance
- 9.1.7. Key strategic moves and developments
- 9.2. Vicat SA
- 9.2.1. Company overview
- 9.2.2. Key Executives
- 9.2.3. Company snapshot
- 9.2.4. Operating business segments
- 9.2.5. Product portfolio
- 9.2.6. Business performance
- 9.3. Adelaide Brighton Ltd.
- 9.3.1. Company overview
- 9.3.2. Key Executives
- 9.3.3. Company snapshot
- 9.3.4. Operating business segments
- 9.3.5. Product portfolio
- 9.3.6. Business performance
- 9.4. Rogers Group Inc.
- 9.4.1. Company overview
- 9.4.2. Key Executives
- 9.4.3. Company snapshot
- 9.4.4. Operating business segments
- 9.4.5. Product portfolio
- 9.5. CEMEX S.A.B. de C.V.
- 9.5.1. Company overview
- 9.5.2. Key Executives
- 9.5.3. Company snapshot
- 9.5.4. Operating business segments
- 9.5.5. Product portfolio
- 9.5.6. Business performance
- 9.5.7. Key strategic moves and developments
- 9.6. HeidelbergCement AG
- 9.6.1. Company overview
- 9.6.2. Key Executives
- 9.6.3. Company snapshot
- 9.6.4. Operating business segments
- 9.6.5. Product portfolio
- 9.6.6. Business performance
- 9.7. Sika AG
- 9.7.1. Company overview
- 9.7.2. Key Executives
- 9.7.3. Company snapshot
- 9.7.4. Operating business segments
- 9.7.5. Product portfolio
- 9.7.6. Business performance
- 9.8. Martin Marietta Materials Inc.
- 9.8.1. Company overview
- 9.8.2. Key Executives
- 9.8.3. Company snapshot
- 9.8.4. Operating business segments
- 9.8.5. Product portfolio
- 9.8.6. Business performance
- 9.8.7. Key strategic moves and developments
- 9.9. Vulcan Materials Company
- 9.9.1. Company overview
- 9.9.2. Key Executives
- 9.9.3. Company snapshot
- 9.9.4. Operating business segments
- 9.9.5. Product portfolio
- 9.9.6. Business performance
- 9.10. CRH
- 9.10.1. Company overview
- 9.10.2. Key Executives
- 9.10.3. Company snapshot
- 9.10.4. Operating business segments
- 9.10.5. Product portfolio
- 9.10.6. Business performance
LIST OF TABLES
- TABLE 01. GLOBAL CONSTRUCTION AGGREGATES MARKET, BY TYPE, 2021-2032 ($MILLION)
- TABLE 02. CONSTRUCTION AGGREGATES MARKET FOR CRUSHED STONE, BY REGION, 2021-2032 ($MILLION)
- TABLE 03. CONSTRUCTION AGGREGATES MARKET FOR SAND AND GRAVEL, BY REGION, 2021-2032 ($MILLION)
- TABLE 04. GLOBAL CONSTRUCTION AGGREGATES MARKET, BY APPLICATION, 2021-2032 ($MILLION)
- TABLE 05. CONSTRUCTION AGGREGATES MARKET FOR NON-RESIDENTIAL, BY REGION, 2021-2032 ($MILLION)
- TABLE 06. CONSTRUCTION AGGREGATES MARKET FOR RESIDENTIAL, BY REGION, 2021-2032 ($MILLION)
- TABLE 07. GLOBAL CONSTRUCTION AGGREGATES MARKET, BY TRANSPORTATION MODE, 2021-2032 ($MILLION)
- TABLE 08. CONSTRUCTION AGGREGATES MARKET FOR TRUCK, BY REGION, 2021-2032 ($MILLION)
- TABLE 09. CONSTRUCTION AGGREGATES MARKET FOR TRAIN, BY REGION, 2021-2032 ($MILLION)
- TABLE 10. CONSTRUCTION AGGREGATES MARKET FOR SHIP, BY REGION, 2021-2032 ($MILLION)
- TABLE 11. CONSTRUCTION AGGREGATES MARKET, BY REGION, 2021-2032 ($MILLION)
- TABLE 12. NORTH AMERICA CONSTRUCTION AGGREGATES MARKET, BY TYPE, 2021-2032 ($MILLION)
- TABLE 13. NORTH AMERICA CONSTRUCTION AGGREGATES MARKET, BY APPLICATION, 2021-2032 ($MILLION)
- TABLE 14. NORTH AMERICA CONSTRUCTION AGGREGATES MARKET, BY TRANSPORTATION MODE, 2021-2032 ($MILLION)
- TABLE 15. NORTH AMERICA CONSTRUCTION AGGREGATES MARKET, BY COUNTRY, 2021-2032 ($MILLION)
- TABLE 16. U.S. CONSTRUCTION AGGREGATES MARKET, BY TYPE, 2021-2032 ($MILLION)
- TABLE 17. U.S. CONSTRUCTION AGGREGATES MARKET, BY APPLICATION, 2021-2032 ($MILLION)
- TABLE 18. U.S. CONSTRUCTION AGGREGATES MARKET, BY TRANSPORTATION MODE, 2021-2032 ($MILLION)
- TABLE 19. CANADA CONSTRUCTION AGGREGATES MARKET, BY TYPE, 2021-2032 ($MILLION)
- TABLE 20. CANADA CONSTRUCTION AGGREGATES MARKET, BY APPLICATION, 2021-2032 ($MILLION)
- TABLE 21. CANADA CONSTRUCTION AGGREGATES MARKET, BY TRANSPORTATION MODE, 2021-2032 ($MILLION)
- TABLE 22. MEXICO CONSTRUCTION AGGREGATES MARKET, BY TYPE, 2021-2032 ($MILLION)
- TABLE 23. MEXICO CONSTRUCTION AGGREGATES MARKET, BY APPLICATION, 2021-2032 ($MILLION)
- TABLE 24. MEXICO CONSTRUCTION AGGREGATES MARKET, BY TRANSPORTATION MODE, 2021-2032 ($MILLION)
- TABLE 25. EUROPE CONSTRUCTION AGGREGATES MARKET, BY TYPE, 2021-2032 ($MILLION)
- TABLE 26. EUROPE CONSTRUCTION AGGREGATES MARKET, BY APPLICATION, 2021-2032 ($MILLION)
- TABLE 27. EUROPE CONSTRUCTION AGGREGATES MARKET, BY TRANSPORTATION MODE, 2021-2032 ($MILLION)
- TABLE 28. EUROPE CONSTRUCTION AGGREGATES MARKET, BY COUNTRY, 2021-2032 ($MILLION)
- TABLE 29. GERMANY CONSTRUCTION AGGREGATES MARKET, BY TYPE, 2021-2032 ($MILLION)
- TABLE 30. GERMANY CONSTRUCTION AGGREGATES MARKET, BY APPLICATION, 2021-2032 ($MILLION)
- TABLE 31. GERMANY CONSTRUCTION AGGREGATES MARKET, BY TRANSPORTATION MODE, 2021-2032 ($MILLION)
- TABLE 32. UK CONSTRUCTION AGGREGATES MARKET, BY TYPE, 2021-2032 ($MILLION)
- TABLE 33. UK CONSTRUCTION AGGREGATES MARKET, BY APPLICATION, 2021-2032 ($MILLION)
- TABLE 34. UK CONSTRUCTION AGGREGATES MARKET, BY TRANSPORTATION MODE, 2021-2032 ($MILLION)
- TABLE 35. FRANCE CONSTRUCTION AGGREGATES MARKET, BY TYPE, 2021-2032 ($MILLION)
- TABLE 36. FRANCE CONSTRUCTION AGGREGATES MARKET, BY APPLICATION, 2021-2032 ($MILLION)
- TABLE 37. FRANCE CONSTRUCTION AGGREGATES MARKET, BY TRANSPORTATION MODE, 2021-2032 ($MILLION)
- TABLE 38. ITALY CONSTRUCTION AGGREGATES MARKET, BY TYPE, 2021-2032 ($MILLION)
- TABLE 39. ITALY CONSTRUCTION AGGREGATES MARKET, BY APPLICATION, 2021-2032 ($MILLION)
- TABLE 40. ITALY CONSTRUCTION AGGREGATES MARKET, BY TRANSPORTATION MODE, 2021-2032 ($MILLION)
- TABLE 41. REST OF EUROPE CONSTRUCTION AGGREGATES MARKET, BY TYPE, 2021-2032 ($MILLION)
- TABLE 42. REST OF EUROPE CONSTRUCTION AGGREGATES MARKET, BY APPLICATION, 2021-2032 ($MILLION)
- TABLE 43. REST OF EUROPE CONSTRUCTION AGGREGATES MARKET, BY TRANSPORTATION MODE, 2021-2032 ($MILLION)
- TABLE 44. ASIA-PACIFIC CONSTRUCTION AGGREGATES MARKET, BY TYPE, 2021-2032 ($MILLION)
- TABLE 45. ASIA-PACIFIC CONSTRUCTION AGGREGATES MARKET, BY APPLICATION, 2021-2032 ($MILLION)
- TABLE 46. ASIA-PACIFIC CONSTRUCTION AGGREGATES MARKET, BY TRANSPORTATION MODE, 2021-2032 ($MILLION)
- TABLE 47. ASIA-PACIFIC CONSTRUCTION AGGREGATES MARKET, BY COUNTRY, 2021-2032 ($MILLION)
- TABLE 48. CHINA CONSTRUCTION AGGREGATES MARKET, BY TYPE, 2021-2032 ($MILLION)
- TABLE 49. CHINA CONSTRUCTION AGGREGATES MARKET, BY APPLICATION, 2021-2032 ($MILLION)
- TABLE 50. CHINA CONSTRUCTION AGGREGATES MARKET, BY TRANSPORTATION MODE, 2021-2032 ($MILLION)
- TABLE 51. JAPAN CONSTRUCTION AGGREGATES MARKET, BY TYPE, 2021-2032 ($MILLION)
- TABLE 52. JAPAN CONSTRUCTION AGGREGATES MARKET, BY APPLICATION, 2021-2032 ($MILLION)
- TABLE 53. JAPAN CONSTRUCTION AGGREGATES MARKET, BY TRANSPORTATION MODE, 2021-2032 ($MILLION)
- TABLE 54. SOUTH KOREA CONSTRUCTION AGGREGATES MARKET, BY TYPE, 2021-2032 ($MILLION)
- TABLE 55. SOUTH KOREA CONSTRUCTION AGGREGATES MARKET, BY APPLICATION, 2021-2032 ($MILLION)
- TABLE 56. SOUTH KOREA CONSTRUCTION AGGREGATES MARKET, BY TRANSPORTATION MODE, 2021-2032 ($MILLION)
- TABLE 57. INDIA CONSTRUCTION AGGREGATES MARKET, BY TYPE, 2021-2032 ($MILLION)
- TABLE 58. INDIA CONSTRUCTION AGGREGATES MARKET, BY APPLICATION, 2021-2032 ($MILLION)
- TABLE 59. INDIA CONSTRUCTION AGGREGATES MARKET, BY TRANSPORTATION MODE, 2021-2032 ($MILLION)
- TABLE 60. REST OF ASIA-PACIFIC CONSTRUCTION AGGREGATES MARKET, BY TYPE, 2021-2032 ($MILLION)
- TABLE 61. REST OF ASIA-PACIFIC CONSTRUCTION AGGREGATES MARKET, BY APPLICATION, 2021-2032 ($MILLION)
- TABLE 62. REST OF ASIA-PACIFIC CONSTRUCTION AGGREGATES MARKET, BY TRANSPORTATION MODE, 2021-2032 ($MILLION)
- TABLE 63. LAMEA CONSTRUCTION AGGREGATES MARKET, BY TYPE, 2021-2032 ($MILLION)
- TABLE 64. LAMEA CONSTRUCTION AGGREGATES MARKET, BY APPLICATION, 2021-2032 ($MILLION)
- TABLE 65. LAMEA CONSTRUCTION AGGREGATES MARKET, BY TRANSPORTATION MODE, 2021-2032 ($MILLION)
- TABLE 66. LAMEA CONSTRUCTION AGGREGATES MARKET, BY COUNTRY, 2021-2032 ($MILLION)
- TABLE 67. LATIN AMERICA CONSTRUCTION AGGREGATES MARKET, BY TYPE, 2021-2032 ($MILLION)
- TABLE 68. LATIN AMERICA CONSTRUCTION AGGREGATES MARKET, BY APPLICATION, 2021-2032 ($MILLION)
- TABLE 69. LATIN AMERICA CONSTRUCTION AGGREGATES MARKET, BY TRANSPORTATION MODE, 2021-2032 ($MILLION)
- TABLE 70. MIDDLE EAST CONSTRUCTION AGGREGATES MARKET, BY TYPE, 2021-2032 ($MILLION)
- TABLE 71. MIDDLE EAST CONSTRUCTION AGGREGATES MARKET, BY APPLICATION, 2021-2032 ($MILLION)
- TABLE 72. MIDDLE EAST CONSTRUCTION AGGREGATES MARKET, BY TRANSPORTATION MODE, 2021-2032 ($MILLION)
- TABLE 73. AFRICA CONSTRUCTION AGGREGATES MARKET, BY TYPE, 2021-2032 ($MILLION)
- TABLE 74. AFRICA CONSTRUCTION AGGREGATES MARKET, BY APPLICATION, 2021-2032 ($MILLION)
- TABLE 75. AFRICA CONSTRUCTION AGGREGATES MARKET, BY TRANSPORTATION MODE, 2021-2032 ($MILLION)
- TABLE 76. HOLCIM LTD.: KEY EXECUTIVES
- TABLE 77. HOLCIM LTD.: COMPANY SNAPSHOT
- TABLE 78. HOLCIM LTD.: PRODUCT SEGMENTS
- TABLE 79. HOLCIM LTD.: PRODUCT PORTFOLIO
- TABLE 80. HOLCIM LTD.: KEY STRATERGIES
- TABLE 81. VICAT SA: KEY EXECUTIVES
- TABLE 82. VICAT SA: COMPANY SNAPSHOT
- TABLE 83. VICAT SA: PRODUCT SEGMENTS
- TABLE 84. VICAT SA: PRODUCT PORTFOLIO
- TABLE 85. ADELAIDE BRIGHTON LTD.: KEY EXECUTIVES
- TABLE 86. ADELAIDE BRIGHTON LTD.: COMPANY SNAPSHOT
- TABLE 87. ADELAIDE BRIGHTON LTD.: PRODUCT SEGMENTS
- TABLE 88. ADELAIDE BRIGHTON LTD.: PRODUCT PORTFOLIO
- TABLE 89. ROGERS GROUP INC.: KEY EXECUTIVES
- TABLE 90. ROGERS GROUP INC.: COMPANY SNAPSHOT
- TABLE 91. ROGERS GROUP INC.: PRODUCT SEGMENTS
- TABLE 92. ROGERS GROUP INC.: PRODUCT PORTFOLIO
- TABLE 93. CEMEX S.A.B. DE C.V.: KEY EXECUTIVES
- TABLE 94. CEMEX S.A.B. DE C.V.: COMPANY SNAPSHOT
- TABLE 95. CEMEX S.A.B. DE C.V.: PRODUCT SEGMENTS
- TABLE 96. CEMEX S.A.B. DE C.V.: PRODUCT PORTFOLIO
- TABLE 97. CEMEX S.A.B. DE C.V.: KEY STRATERGIES
- TABLE 98. HEIDELBERGCEMENT AG: KEY EXECUTIVES
- TABLE 99. HEIDELBERGCEMENT AG: COMPANY SNAPSHOT
- TABLE 100. HEIDELBERGCEMENT AG: PRODUCT SEGMENTS
- TABLE 101. HEIDELBERGCEMENT AG: PRODUCT PORTFOLIO
- TABLE 102. SIKA AG: KEY EXECUTIVES
- TABLE 103. SIKA AG: COMPANY SNAPSHOT
- TABLE 104. SIKA AG: PRODUCT SEGMENTS
- TABLE 105. SIKA AG: PRODUCT PORTFOLIO
- TABLE 106. MARTIN MARIETTA MATERIALS INC.: KEY EXECUTIVES
- TABLE 107. MARTIN MARIETTA MATERIALS INC.: COMPANY SNAPSHOT
- TABLE 108. MARTIN MARIETTA MATERIALS INC.: PRODUCT SEGMENTS
- TABLE 109. MARTIN MARIETTA MATERIALS INC.: PRODUCT PORTFOLIO
- TABLE 110. MARTIN MARIETTA MATERIALS INC.: KEY STRATERGIES
- TABLE 111. VULCAN MATERIALS COMPANY: KEY EXECUTIVES
- TABLE 112. VULCAN MATERIALS COMPANY: COMPANY SNAPSHOT
- TABLE 113. VULCAN MATERIALS COMPANY: SERVICE SEGMENTS
- TABLE 114. VULCAN MATERIALS COMPANY: PRODUCT PORTFOLIO
- TABLE 115. CRH: KEY EXECUTIVES
- TABLE 116. CRH: COMPANY SNAPSHOT
- TABLE 117. CRH: PRODUCT SEGMENTS
- TABLE 118. CRH: PRODUCT PORTFOLIO
LIST OF FIGURES
- FIGURE 01. CONSTRUCTION AGGREGATES MARKET, 2021-2032
- FIGURE 02. SEGMENTATION OF CONSTRUCTION AGGREGATES MARKET,2021-2032
- FIGURE 03. TOP INVESTMENT POCKETS IN CONSTRUCTION AGGREGATES MARKET (2023-2032)
- FIGURE 04. LOW BARGAINING POWER OF SUPPLIERS
- FIGURE 05. LOW THREAT OF NEW ENTRANTS
- FIGURE 06. LOW THREAT OF SUBSTITUTES
- FIGURE 07. LOW INTENSITY OF RIVALRY
- FIGURE 08. LOW BARGAINING POWER OF BUYERS
- FIGURE 09. GLOBAL CONSTRUCTION AGGREGATES MARKET:DRIVERS, RESTRAINTS AND OPPORTUNITIES
- FIGURE 10. CONSTRUCTION AGGREGATES MARKET, BY TYPE, 2021(%)
- FIGURE 11. COMPARATIVE SHARE ANALYSIS OF CONSTRUCTION AGGREGATES MARKET FOR CRUSHED STONE, BY COUNTRY 2021 AND 2032(%)
- FIGURE 12. COMPARATIVE SHARE ANALYSIS OF CONSTRUCTION AGGREGATES MARKET FOR SAND AND GRAVEL, BY COUNTRY 2021 AND 2032(%)
- FIGURE 13. CONSTRUCTION AGGREGATES MARKET, BY APPLICATION, 2021(%)
- FIGURE 14. COMPARATIVE SHARE ANALYSIS OF CONSTRUCTION AGGREGATES MARKET FOR NON-RESIDENTIAL, BY COUNTRY 2021 AND 2032(%)
- FIGURE 15. COMPARATIVE SHARE ANALYSIS OF CONSTRUCTION AGGREGATES MARKET FOR RESIDENTIAL, BY COUNTRY 2021 AND 2032(%)
- FIGURE 16. CONSTRUCTION AGGREGATES MARKET, BY TRANSPORTATION MODE, 2021(%)
- FIGURE 17. COMPARATIVE SHARE ANALYSIS OF CONSTRUCTION AGGREGATES MARKET FOR TRUCK, BY COUNTRY 2021 AND 2032(%)
- FIGURE 18. COMPARATIVE SHARE ANALYSIS OF CONSTRUCTION AGGREGATES MARKET FOR TRAIN, BY COUNTRY 2021 AND 2032(%)
- FIGURE 19. COMPARATIVE SHARE ANALYSIS OF CONSTRUCTION AGGREGATES MARKET FOR SHIP, BY COUNTRY 2021 AND 2032(%)
- FIGURE 20. CONSTRUCTION AGGREGATES MARKET BY REGION, 2021(%)
- FIGURE 21. U.S. CONSTRUCTION AGGREGATES MARKET, 2021-2032 ($MILLION)
- FIGURE 22. CANADA CONSTRUCTION AGGREGATES MARKET, 2021-2032 ($MILLION)
- FIGURE 23. MEXICO CONSTRUCTION AGGREGATES MARKET, 2021-2032 ($MILLION)
- FIGURE 24. GERMANY CONSTRUCTION AGGREGATES MARKET, 2021-2032 ($MILLION)
- FIGURE 25. UK CONSTRUCTION AGGREGATES MARKET, 2021-2032 ($MILLION)
- FIGURE 26. FRANCE CONSTRUCTION AGGREGATES MARKET, 2021-2032 ($MILLION)
- FIGURE 27. ITALY CONSTRUCTION AGGREGATES MARKET, 2021-2032 ($MILLION)
- FIGURE 28. REST OF EUROPE CONSTRUCTION AGGREGATES MARKET, 2021-2032 ($MILLION)
- FIGURE 29. CHINA CONSTRUCTION AGGREGATES MARKET, 2021-2032 ($MILLION)
- FIGURE 30. JAPAN CONSTRUCTION AGGREGATES MARKET, 2021-2032 ($MILLION)
- FIGURE 31. SOUTH KOREA CONSTRUCTION AGGREGATES MARKET, 2021-2032 ($MILLION)
- FIGURE 32. INDIA CONSTRUCTION AGGREGATES MARKET, 2021-2032 ($MILLION)
- FIGURE 33. REST OF ASIA-PACIFIC CONSTRUCTION AGGREGATES MARKET, 2021-2032 ($MILLION)
- FIGURE 34. LATIN AMERICA CONSTRUCTION AGGREGATES MARKET, 2021-2032 ($MILLION)
- FIGURE 35. MIDDLE EAST CONSTRUCTION AGGREGATES MARKET, 2021-2032 ($MILLION)
- FIGURE 36. AFRICA CONSTRUCTION AGGREGATES MARKET, 2021-2032 ($MILLION)
- FIGURE 37. TOP WINNING STRATEGIES, BY YEAR (2021-2023)
- FIGURE 38. TOP WINNING STRATEGIES, BY DEVELOPMENT (2021-2023)
- FIGURE 39. TOP WINNING STRATEGIES, BY COMPANY (2021-2023)
- FIGURE 40. PRODUCT MAPPING OF TOP 10 PLAYERS
- FIGURE 41. COMPETITIVE DASHBOARD
- FIGURE 42. COMPETITIVE HEATMAP: CONSTRUCTION AGGREGATES MARKET
- FIGURE 43. TOP PLAYER POSITIONING, 2021
- FIGURE 44. HOLCIM LTD.: NET REVENUE, 2020-2022 ($MILLION)
- FIGURE 45. HOLCIM LTD.: REVENUE SHARE BY SEGMENT, 2022 (%)
- FIGURE 46. HOLCIM LTD.: REVENUE SHARE BY REGION, 2022 (%)
- FIGURE 47. VICAT SA: NET REVENUE, 2020-2022 ($MILLION)
- FIGURE 48. VICAT SA: REVENUE SHARE BY SEGMENT, 2022 (%)
- FIGURE 49. VICAT SA: REVENUE SHARE BY REGION, 2022 (%)
- FIGURE 50. ADELAIDE BRIGHTON LTD.: NET REVENUE, 2020-2022 ($MILLION)
- FIGURE 51. ADELAIDE BRIGHTON LTD.: REVENUE SHARE BY SEGMENT, 2022 (%)
- FIGURE 52. CEMEX S.A.B. DE C.V.: NET REVENUE, 2020-2022 ($MILLION)
- FIGURE 53. CEMEX S.A.B. DE C.V.: REVENUE SHARE BY SEGMENT, 2022 (%)
- FIGURE 54. CEMEX S.A.B. DE C.V.: REVENUE SHARE BY REGION, 2022 (%)
- FIGURE 55. HEIDELBERGCEMENT AG: NET SALES, 2020-2022 ($MILLION)
- FIGURE 56. HEIDELBERGCEMENT AG: RESEARCH & DEVELOPMENT EXPENDITURE, 2020-2022 ($MILLION)
- FIGURE 57. HEIDELBERGCEMENT AG: REVENUE SHARE BY SEGMENT, 2022 (%)
- FIGURE 58. HEIDELBERGCEMENT AG: REVENUE SHARE BY REGION, 2022 (%)
- FIGURE 59. SIKA AG: RESEARCH & DEVELOPMENT EXPENDITURE, 2020-2022 ($MILLION)
- FIGURE 60. SIKA AG: NET REVENUE, 2020-2022 ($MILLION)
- FIGURE 61. SIKA AG: REVENUE SHARE BY SEGMENT, 2022 (%)
- FIGURE 62. SIKA AG: REVENUE SHARE BY REGION, 2022 (%)
- FIGURE 63. MARTIN MARIETTA MATERIALS INC.: NET REVENUE, 2020-2022 ($MILLION)
- FIGURE 64. MARTIN MARIETTA MATERIALS INC.: REVENUE SHARE BY SEGMENT, 2022 (%)
- FIGURE 65. MARTIN MARIETTA MATERIALS INC.: REVENUE SHARE BY REGION, 2022 (%)
- FIGURE 66. VULCAN MATERIALS COMPANY: SALES REVENUE, 2020-2022 ($MILLION)
- FIGURE 67. VULCAN MATERIALS COMPANY: REVENUE SHARE BY SEGMENT, 2022 (%)
- FIGURE 68. CRH: NET REVENUE, 2020-2022 ($MILLION)
- FIGURE 69. CRH: REVENUE SHARE BY SEGMENT, 2022 (%)
 全球骨料市場 2024-2028
 建築骨料市場:按產品類型、原產地、應用和最終用戶 - 2023-2030 年全球預測
 建築骨材市場研究:碎石需求成長速度快於其他產品類型
 建設用骨材的全球市場
 高鋁骨料市場:按等級、按產品、按應用、按地區 - 規模、份額、展望、機會分析,2023-2030 年
 綜合市場 - COVID-19 的增長、趨勢、影響和預測 (2023-2028)
 骨材的全球市場:各產品類型,各用途,各最終用途,產業預測(2022年~2028年)
 再生建設用骨材的世界市場規模,佔有率,成長分析:各產品類型,各最終用途 - 產業預測(2022年~2028年)
 建設用骨材市場:各產品類型,各用途,各地區- 規模,佔有率,展望,機會分析,2022年~2030年
 全球再製造骨料市場:按產品類型、按應用、按區域規模、份額、前景、機會分析(2022-2028 年)