


 |
市場調查報告書
商品編碼
1365723
雲端零售市場:按解決方案、部署模型、公司規模和服務模式分類:2023-2032 年全球機會分析和產業預測Cloud Retail Market By Solution, By Deployment Model, By Enterprise Size, By Service Model (Software as a Service, Platform as Service, Infrastructure as a Service ): Global Opportunity Analysis and Industry Forecast, 2023-2032 |
||||||
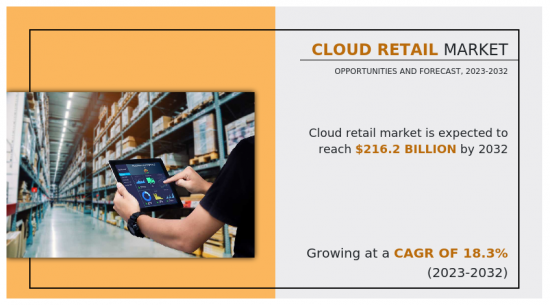
由於市場對軟體即服務(SaaS)模式的需求不斷增加,2023年至2032年雲端零售市場可能會出現18.3%的大幅成長。
推動雲端零售市場成長的關鍵要素包括對全通路體驗的日益關注以及零售中雲端產品的成本效益。全通路是一種允許客戶與多個銷售管道和媒體管道互動的溝通模型。全通路將企業與其客戶之間的所有溝通管道連結成單一、統一的體驗。根據 Salesforce 的研究,73% 的消費者在購物時使用多種管道。因此,零售商專注於增強全通路體驗。多重雲端架構的日益採用也被認為是推動雲端零售市場的關鍵要素。然而,日益增加的複雜性和資料安全問題預計將阻礙市場成長。整合雲端解決方案與現有的本地系統和遺留軟體整合通常是複雜且勞力密集的。零售公司面臨相容性問題、資料遷移挑戰以及客製化整合方案的需求。相反,透過利用綠色雲端解決方案,優先考慮永續性的零售商可以提高其品牌形象和聲譽。具有環保意識的客戶應該支持並維持對那些致力於永續性的品牌的忠誠度。此外,永續的雲端解決方案通常可以提高能源效率和資源最佳化,從而為零售商節省成本。減少能源消費量和有效配置資源可以降低營運成本。
目錄
第1章 簡介
第2章 執行摘要
第3章 市場概況
- 市場定義和範圍
- 主要發現
- 影響要素
- 主要投資機會
- 波特五力分析
- 市場動態
- 促進因素
- 多重雲端架構的採用增加
- 越來越關注全通路體驗
- 雲端產品在零售業的成本效益
- 抑制因素
- 日益增加的複雜性和資料安全問題
- 機會
- 顛覆性技術的快速提升
- 永續雲端解決方案的成長
- 促進因素
- COVID-19 市場影響分析
第4章 雲端零售市場:按解決方案
- 概述
- 供應鏈管理
- 使用者管理
- 員工管理
- 報告和分析
- 資料安全
- 其他
第5章 雲端零售市場:依部署模型
- 概述
- 公共雲端
- 私有雲端
- 混合雲端
第6章 雲端零售市場:依公司規模分類
- 概述
- 主要企業
- 中小企業
第7章 雲端零售市場:依服務模式
- 概述
- SaaS(Software-as-a-Service)
- PaaS(Platform-as-a-Service)
- IaaS(Infrastructure-as-a-Service)
第8章 雲端零售市場:按地區
- 概述
- 北美洲
- 美國
- 加拿大
- 歐洲
- 英國
- 德國
- 法國
- 義大利
- 西班牙
- 其他
- 亞太地區
- 中國
- 日本
- 印度
- 澳洲
- 韓國
- 其他
- 拉丁美洲
- 拉丁美洲
- 中東
- 非洲
第9章 競爭形勢
- 介紹
- 關鍵成功策略
- 10家主要企業產品圖譜
- 競爭儀表板
- 競爭熱圖
- 2022年主要企業定位
第10章 公司簡介
- SAP SE
- Fujitsu
- Oracle Corporation
- Infor Inc.
- Amazon Web Services, Inc.
- Cisco Systems, Inc.
- IBM Corporation
- EPICOR SOFTWARE CORPORATION
- Microsoft Corporation
- Google LLC
The Cloud Retail Market is likely to experience a significant growth rate of 18.3 % from 2023-2032 owing to increasing market demand for Software as a Service (SaaS) model- Allied Market Research
The key factors that drive the growth of the cloud retail market include increase in focus on the omni-channel experience and cost-effective benefits of cloud products in retail. Omni-channel retailing describes a communication model that enables customers to interact with multiple sales and media channels. Omni-channel links all communication channels between the enterprise and the customers to create a single unified experience. According to a sales force study, 73% of shoppers opt for multiple channels during their shopping journeys. This drives the retailers to focus on enhancing the omni-channel experience. In addition, increase in adoption of multi-cloud architecture is considered as an important factor to boost the cloud retail market. However, increase in complexity and data security concerns are expected to hamper market growth. Integrating cloud solutions with existing on-premises systems and legacy software is often complex and requires significant effort. Retailers encounter compatibility issues, data migration challenges, and the need for custom integration solutions. Contrarily, retailers that prioritize sustainability by using green cloud solutions can improve their brand image and reputation. Environmentally conscious customers are expected to support and remain loyal to brands that demonstrate a commitment to sustainability. Moreover, sustainable cloud solutions often lead to improved energy efficiency and resource optimization, resulting in potential cost savings for retailers. Lower energy consumption and efficient resource allocation can translate into reduced operational expenses.
The cloud retail market is segmented on the basis of solution, deployment model, enterprise size, service model, and region. On the basis of solution, the market is categorized into supply chain management, customer management, workforce management, reporting and analytics, data security, and others. On the basis of deployment model, the market is divided into public cloud, private cloud, and hybrid cloud. On the basis of enterprise size, the market is bifurcated into large enterprises and small and medium-sized enterprises. On the basis of service model, it is divided into software as a service (SaaS), platform as service (PaaS), and infrastructure as a service (IaaS). On the basis of region, it is analyzed across North America, Europe, Asia-Pacific, and LAMEA.
The report analyzes the profiles of key players operating in the cloud retail market such as SAP SE, Fujitsu, Oracle, Infor Inc., Amazon Web Services, Inc., Cisco Systems, Inc., IBM, Epicor Software Corporation, Microsoft, and Google LLC. These players have adopted various strategies such as collaboration, acquisition, and product launch to increase their market penetration and strengthen their position in the cloud retail market.
Key Benefits for Stakeholders
- The study provides in-depth analysis of the global cloud retail market along with the current & future trends to illustrate the imminent investment pockets.
- Information about key drivers, restrains, & opportunities and their impact analysis on the global cloud retail market size is provided in the report.
- Porter's five forces analysis illustrates the potency of buyers and suppliers operating in the industry.
- The quantitative analysis of the global cloud retail market from 2022 to 2032 is provided to determine the market potential.
Additional benefits you will get with this purchase are:
- Quarterly Update and* (only available with a corporate license, on listed price)
- 5 additional Company Profile of client Choice pre- or Post-purchase, as a free update.
- Free Upcoming Version on the Purchase of Five and Enterprise User License.
- 16 analyst hours of support* (post-purchase, if you find additional data requirements upon review of the report, you may receive support amounting to 16 analyst hours to solve questions, and post-sale queries)
- 15% Free Customization* (in case the scope or segment of the report does not match your requirements, 20% is equivalent to 3 working days of free work, applicable once)
- Free data Pack on the Five and Enterprise User License. (Excel version of the report)
- Free Updated report if the report is 6-12 months old or older.
- 24-hour priority response*
- Free Industry updates and white papers.
Possible Customization with this report (with additional cost and timeline talk to the sales executive to know more)
- Investment Opportunities
- New Product Development/ Product Matrix of Key Players
- Regulatory Guidelines
- Additional company profiles with specific to client's interest
- Additional country or region analysis- market size and forecast
- Key player details (including location, contact details, supplier/vendor network etc. in excel format)
- SWOT Analysis
Key Market Segments
By Service Model
- Software as a Service (SaaS)
- Platform as Service (PaaS)
- Infrastructure as a Service (IaaS)
By Solution
- Supply Chain Management
- Customer Management
- Workforce Management
- Reporting and Analytics
- Data Security
- Others
By Deployment Model
- Public Cloud
- Private Cloud
- Hybrid Cloud
By Enterprise Size
- Large Enterprises
- Small and Medium-Sized Enterprises
By Region
- North America
- U.S.
- Canada
- Europe
- UK
- Germany
- France
- Italy
- Spain
- Rest of Europe
- Asia-Pacific
- China
- Japan
- India
- Australia
- South Korea
- Rest of Asia-Pacific
- LAMEA
- Latin America
- Middle East
- Africa
Key Market Players:
- SAP SE
- Oracle Corporation
- Cisco Systems, Inc.
- IBM Corporation
- Google LLC
- Fujitsu
- EPICOR SOFTWARE CORPORATION
- Amazon Web Services, Inc.
- Microsoft Corporation
- Infor Inc.
TABLE OF CONTENTS
CHAPTER 1: INTRODUCTION
- 1.1. Report description
- 1.2. Key market segments
- 1.3. Key benefits to the stakeholders
- 1.4. Research Methodology
- 1.4.1. Primary research
- 1.4.2. Secondary research
- 1.4.3. Analyst tools and models
CHAPTER 2: EXECUTIVE SUMMARY
- 2.1. CXO Perspective
CHAPTER 3: MARKET OVERVIEW
- 3.1. Market definition and scope
- 3.2. Key findings
- 3.2.1. Top impacting factors
- 3.2.2. Top investment pockets
- 3.3. Porter's five forces analysis
- 3.3.1. Low bargaining power of suppliers
- 3.3.2. Low threat of new entrants
- 3.3.3. Low threat of substitutes
- 3.3.4. Low intensity of rivalry
- 3.3.5. Low bargaining power of buyers
- 3.4. Market dynamics
- 3.4.1. Drivers
- 3.4.1.1. Increase in adoption of multi-cloud architecture
- 3.4.1.2. Increase in focus on the omni-channel experience
- 3.4.1.3. Cost-effective benefits of cloud products in retail
- 3.4.1. Drivers
- 3.4.2. Restraints
- 3.4.2.1. Increase in complexity and data security concerns
- 3.4.3. Opportunities
- 3.4.3.1. Rapid improvements in disruptive technologies
- 3.4.3.2. Growth in sustainable cloud solutions
- 3.5. COVID-19 Impact Analysis on the market
CHAPTER 4: CLOUD RETAIL MARKET, BY SOLUTION
- 4.1. Overview
- 4.1.1. Market size and forecast
- 4.2. Supply Chain Management
- 4.2.1. Key market trends, growth factors and opportunities
- 4.2.2. Market size and forecast, by region
- 4.2.3. Market share analysis by country
- 4.3. Customer Management
- 4.3.1. Key market trends, growth factors and opportunities
- 4.3.2. Market size and forecast, by region
- 4.3.3. Market share analysis by country
- 4.4. Workforce Management
- 4.4.1. Key market trends, growth factors and opportunities
- 4.4.2. Market size and forecast, by region
- 4.4.3. Market share analysis by country
- 4.5. Reporting and Analytics
- 4.5.1. Key market trends, growth factors and opportunities
- 4.5.2. Market size and forecast, by region
- 4.5.3. Market share analysis by country
- 4.6. Data Security
- 4.6.1. Key market trends, growth factors and opportunities
- 4.6.2. Market size and forecast, by region
- 4.6.3. Market share analysis by country
- 4.7. Others
- 4.7.1. Key market trends, growth factors and opportunities
- 4.7.2. Market size and forecast, by region
- 4.7.3. Market share analysis by country
CHAPTER 5: CLOUD RETAIL MARKET, BY DEPLOYMENT MODEL
- 5.1. Overview
- 5.1.1. Market size and forecast
- 5.2. Public Cloud
- 5.2.1. Key market trends, growth factors and opportunities
- 5.2.2. Market size and forecast, by region
- 5.2.3. Market share analysis by country
- 5.3. Private Cloud
- 5.3.1. Key market trends, growth factors and opportunities
- 5.3.2. Market size and forecast, by region
- 5.3.3. Market share analysis by country
- 5.4. Hybrid Cloud
- 5.4.1. Key market trends, growth factors and opportunities
- 5.4.2. Market size and forecast, by region
- 5.4.3. Market share analysis by country
CHAPTER 6: CLOUD RETAIL MARKET, BY ENTERPRISE SIZE
- 6.1. Overview
- 6.1.1. Market size and forecast
- 6.2. Large Enterprises
- 6.2.1. Key market trends, growth factors and opportunities
- 6.2.2. Market size and forecast, by region
- 6.2.3. Market share analysis by country
- 6.3. Small and Medium-Sized Enterprises
- 6.3.1. Key market trends, growth factors and opportunities
- 6.3.2. Market size and forecast, by region
- 6.3.3. Market share analysis by country
CHAPTER 7: CLOUD RETAIL MARKET, BY SERVICE MODEL
- 7.1. Overview
- 7.1.1. Market size and forecast
- 7.2. Software as a Service (SaaS)
- 7.2.1. Key market trends, growth factors and opportunities
- 7.2.2. Market size and forecast, by region
- 7.2.3. Market share analysis by country
- 7.3. Platform as Service (PaaS)
- 7.3.1. Key market trends, growth factors and opportunities
- 7.3.2. Market size and forecast, by region
- 7.3.3. Market share analysis by country
- 7.4. Infrastructure as a Service (IaaS)
- 7.4.1. Key market trends, growth factors and opportunities
- 7.4.2. Market size and forecast, by region
- 7.4.3. Market share analysis by country
CHAPTER 8: CLOUD RETAIL MARKET, BY REGION
- 8.1. Overview
- 8.1.1. Market size and forecast By Region
- 8.2. North America
- 8.2.1. Key market trends, growth factors and opportunities
- 8.2.2. Market size and forecast, by Solution
- 8.2.3. Market size and forecast, by Deployment Model
- 8.2.4. Market size and forecast, by Enterprise Size
- 8.2.5. Market size and forecast, by Service Model
- 8.2.6. Market size and forecast, by country
- 8.2.6.1. U.S.
- 8.2.6.1.1. Market size and forecast, by Solution
- 8.2.6.1.2. Market size and forecast, by Deployment Model
- 8.2.6.1.3. Market size and forecast, by Enterprise Size
- 8.2.6.1.4. Market size and forecast, by Service Model
- 8.2.6.2. Canada
- 8.2.6.2.1. Market size and forecast, by Solution
- 8.2.6.2.2. Market size and forecast, by Deployment Model
- 8.2.6.2.3. Market size and forecast, by Enterprise Size
- 8.2.6.2.4. Market size and forecast, by Service Model
- 8.3. Europe
- 8.3.1. Key market trends, growth factors and opportunities
- 8.3.2. Market size and forecast, by Solution
- 8.3.3. Market size and forecast, by Deployment Model
- 8.3.4. Market size and forecast, by Enterprise Size
- 8.3.5. Market size and forecast, by Service Model
- 8.3.6. Market size and forecast, by country
- 8.3.6.1. UK
- 8.3.6.1.1. Market size and forecast, by Solution
- 8.3.6.1.2. Market size and forecast, by Deployment Model
- 8.3.6.1.3. Market size and forecast, by Enterprise Size
- 8.3.6.1.4. Market size and forecast, by Service Model
- 8.3.6.2. Germany
- 8.3.6.2.1. Market size and forecast, by Solution
- 8.3.6.2.2. Market size and forecast, by Deployment Model
- 8.3.6.2.3. Market size and forecast, by Enterprise Size
- 8.3.6.2.4. Market size and forecast, by Service Model
- 8.3.6.3. France
- 8.3.6.3.1. Market size and forecast, by Solution
- 8.3.6.3.2. Market size and forecast, by Deployment Model
- 8.3.6.3.3. Market size and forecast, by Enterprise Size
- 8.3.6.3.4. Market size and forecast, by Service Model
- 8.3.6.4. Italy
- 8.3.6.4.1. Market size and forecast, by Solution
- 8.3.6.4.2. Market size and forecast, by Deployment Model
- 8.3.6.4.3. Market size and forecast, by Enterprise Size
- 8.3.6.4.4. Market size and forecast, by Service Model
- 8.3.6.5. Spain
- 8.3.6.5.1. Market size and forecast, by Solution
- 8.3.6.5.2. Market size and forecast, by Deployment Model
- 8.3.6.5.3. Market size and forecast, by Enterprise Size
- 8.3.6.5.4. Market size and forecast, by Service Model
- 8.3.6.6. Rest of Europe
- 8.3.6.6.1. Market size and forecast, by Solution
- 8.3.6.6.2. Market size and forecast, by Deployment Model
- 8.3.6.6.3. Market size and forecast, by Enterprise Size
- 8.3.6.6.4. Market size and forecast, by Service Model
- 8.4. Asia-Pacific
- 8.4.1. Key market trends, growth factors and opportunities
- 8.4.2. Market size and forecast, by Solution
- 8.4.3. Market size and forecast, by Deployment Model
- 8.4.4. Market size and forecast, by Enterprise Size
- 8.4.5. Market size and forecast, by Service Model
- 8.4.6. Market size and forecast, by country
- 8.4.6.1. China
- 8.4.6.1.1. Market size and forecast, by Solution
- 8.4.6.1.2. Market size and forecast, by Deployment Model
- 8.4.6.1.3. Market size and forecast, by Enterprise Size
- 8.4.6.1.4. Market size and forecast, by Service Model
- 8.4.6.2. Japan
- 8.4.6.2.1. Market size and forecast, by Solution
- 8.4.6.2.2. Market size and forecast, by Deployment Model
- 8.4.6.2.3. Market size and forecast, by Enterprise Size
- 8.4.6.2.4. Market size and forecast, by Service Model
- 8.4.6.3. India
- 8.4.6.3.1. Market size and forecast, by Solution
- 8.4.6.3.2. Market size and forecast, by Deployment Model
- 8.4.6.3.3. Market size and forecast, by Enterprise Size
- 8.4.6.3.4. Market size and forecast, by Service Model
- 8.4.6.4. Australia
- 8.4.6.4.1. Market size and forecast, by Solution
- 8.4.6.4.2. Market size and forecast, by Deployment Model
- 8.4.6.4.3. Market size and forecast, by Enterprise Size
- 8.4.6.4.4. Market size and forecast, by Service Model
- 8.4.6.5. South Korea
- 8.4.6.5.1. Market size and forecast, by Solution
- 8.4.6.5.2. Market size and forecast, by Deployment Model
- 8.4.6.5.3. Market size and forecast, by Enterprise Size
- 8.4.6.5.4. Market size and forecast, by Service Model
- 8.4.6.6. Rest of Asia-Pacific
- 8.4.6.6.1. Market size and forecast, by Solution
- 8.4.6.6.2. Market size and forecast, by Deployment Model
- 8.4.6.6.3. Market size and forecast, by Enterprise Size
- 8.4.6.6.4. Market size and forecast, by Service Model
- 8.5. LAMEA
- 8.5.1. Key market trends, growth factors and opportunities
- 8.5.2. Market size and forecast, by Solution
- 8.5.3. Market size and forecast, by Deployment Model
- 8.5.4. Market size and forecast, by Enterprise Size
- 8.5.5. Market size and forecast, by Service Model
- 8.5.6. Market size and forecast, by country
- 8.5.6.1. Latin America
- 8.5.6.1.1. Market size and forecast, by Solution
- 8.5.6.1.2. Market size and forecast, by Deployment Model
- 8.5.6.1.3. Market size and forecast, by Enterprise Size
- 8.5.6.1.4. Market size and forecast, by Service Model
- 8.5.6.2. Middle East
- 8.5.6.2.1. Market size and forecast, by Solution
- 8.5.6.2.2. Market size and forecast, by Deployment Model
- 8.5.6.2.3. Market size and forecast, by Enterprise Size
- 8.5.6.2.4. Market size and forecast, by Service Model
- 8.5.6.3. Africa
- 8.5.6.3.1. Market size and forecast, by Solution
- 8.5.6.3.2. Market size and forecast, by Deployment Model
- 8.5.6.3.3. Market size and forecast, by Enterprise Size
- 8.5.6.3.4. Market size and forecast, by Service Model
CHAPTER 9: COMPETITIVE LANDSCAPE
- 9.1. Introduction
- 9.2. Top winning strategies
- 9.3. Product Mapping of Top 10 Player
- 9.4. Competitive Dashboard
- 9.5. Competitive Heatmap
- 9.6. Top player positioning, 2022
CHAPTER 10: COMPANY PROFILES
- 10.1. SAP SE
- 10.1.1. Company overview
- 10.1.2. Key Executives
- 10.1.3. Company snapshot
- 10.1.4. Operating business segments
- 10.1.5. Product portfolio
- 10.1.6. Business performance
- 10.1.7. Key strategic moves and developments
- 10.2. Fujitsu
- 10.2.1. Company overview
- 10.2.2. Key Executives
- 10.2.3. Company snapshot
- 10.2.4. Operating business segments
- 10.2.5. Product portfolio
- 10.2.6. Business performance
- 10.2.7. Key strategic moves and developments
- 10.3. Oracle Corporation
- 10.3.1. Company overview
- 10.3.2. Key Executives
- 10.3.3. Company snapshot
- 10.3.4. Operating business segments
- 10.3.5. Product portfolio
- 10.3.6. Business performance
- 10.3.7. Key strategic moves and developments
- 10.4. Infor Inc.
- 10.4.1. Company overview
- 10.4.2. Key Executives
- 10.4.3. Company snapshot
- 10.4.4. Operating business segments
- 10.4.5. Product portfolio
- 10.4.6. Key strategic moves and developments
- 10.5. Amazon Web Services, Inc.
- 10.5.1. Company overview
- 10.5.2. Key Executives
- 10.5.3. Company snapshot
- 10.5.4. Operating business segments
- 10.5.5. Product portfolio
- 10.5.6. Business performance
- 10.5.7. Key strategic moves and developments
- 10.6. Cisco Systems, Inc.
- 10.6.1. Company overview
- 10.6.2. Key Executives
- 10.6.3. Company snapshot
- 10.6.4. Operating business segments
- 10.6.5. Product portfolio
- 10.6.6. Business performance
- 10.6.7. Key strategic moves and developments
- 10.7. IBM Corporation
- 10.7.1. Company overview
- 10.7.2. Key Executives
- 10.7.3. Company snapshot
- 10.7.4. Operating business segments
- 10.7.5. Product portfolio
- 10.7.6. Business performance
- 10.7.7. Key strategic moves and developments
- 10.8. EPICOR SOFTWARE CORPORATION
- 10.8.1. Company overview
- 10.8.2. Key Executives
- 10.8.3. Company snapshot
- 10.8.4. Operating business segments
- 10.8.5. Product portfolio
- 10.8.6. Key strategic moves and developments
- 10.9. Microsoft Corporation
- 10.9.1. Company overview
- 10.9.2. Key Executives
- 10.9.3. Company snapshot
- 10.9.4. Operating business segments
- 10.9.5. Product portfolio
- 10.9.6. Business performance
- 10.9.7. Key strategic moves and developments
- 10.10. Google LLC
- 10.10.1. Company overview
- 10.10.2. Key Executives
- 10.10.3. Company snapshot
- 10.10.4. Operating business segments
- 10.10.5. Product portfolio
- 10.10.6. Business performance
- 10.10.7. Key strategic moves and developments
LIST OF TABLES
- TABLE 01. GLOBAL CLOUD RETAIL MARKET, BY SOLUTION, 2022-2032 ($MILLION)
- TABLE 02. CLOUD RETAIL MARKET FOR SUPPLY CHAIN MANAGEMENT, BY REGION, 2022-2032 ($MILLION)
- TABLE 03. CLOUD RETAIL MARKET FOR CUSTOMER MANAGEMENT, BY REGION, 2022-2032 ($MILLION)
- TABLE 04. CLOUD RETAIL MARKET FOR WORKFORCE MANAGEMENT, BY REGION, 2022-2032 ($MILLION)
- TABLE 05. CLOUD RETAIL MARKET FOR REPORTING AND ANALYTICS, BY REGION, 2022-2032 ($MILLION)
- TABLE 06. CLOUD RETAIL MARKET FOR DATA SECURITY, BY REGION, 2022-2032 ($MILLION)
- TABLE 07. CLOUD RETAIL MARKET FOR OTHERS, BY REGION, 2022-2032 ($MILLION)
- TABLE 08. GLOBAL CLOUD RETAIL MARKET, BY DEPLOYMENT MODEL, 2022-2032 ($MILLION)
- TABLE 09. CLOUD RETAIL MARKET FOR PUBLIC CLOUD, BY REGION, 2022-2032 ($MILLION)
- TABLE 10. CLOUD RETAIL MARKET FOR PRIVATE CLOUD, BY REGION, 2022-2032 ($MILLION)
- TABLE 11. CLOUD RETAIL MARKET FOR HYBRID CLOUD, BY REGION, 2022-2032 ($MILLION)
- TABLE 12. GLOBAL CLOUD RETAIL MARKET, BY ENTERPRISE SIZE, 2022-2032 ($MILLION)
- TABLE 13. CLOUD RETAIL MARKET FOR LARGE ENTERPRISES, BY REGION, 2022-2032 ($MILLION)
- TABLE 14. CLOUD RETAIL MARKET FOR SMALL AND MEDIUM-SIZED ENTERPRISES, BY REGION, 2022-2032 ($MILLION)
- TABLE 15. GLOBAL CLOUD RETAIL MARKET, BY SERVICE MODEL, 2022-2032 ($MILLION)
- TABLE 16. CLOUD RETAIL MARKET FOR SOFTWARE AS A SERVICE (SAAS), BY REGION, 2022-2032 ($MILLION)
- TABLE 17. CLOUD RETAIL MARKET FOR PLATFORM AS SERVICE (PAAS), BY REGION, 2022-2032 ($MILLION)
- TABLE 18. CLOUD RETAIL MARKET FOR INFRASTRUCTURE AS A SERVICE (IAAS), BY REGION, 2022-2032 ($MILLION)
- TABLE 19. CLOUD RETAIL MARKET, BY REGION, 2022-2032 ($MILLION)
- TABLE 20. NORTH AMERICA CLOUD RETAIL MARKET, BY SOLUTION, 2022-2032 ($MILLION)
- TABLE 21. NORTH AMERICA CLOUD RETAIL MARKET, BY DEPLOYMENT MODEL, 2022-2032 ($MILLION)
- TABLE 22. NORTH AMERICA CLOUD RETAIL MARKET, BY ENTERPRISE SIZE, 2022-2032 ($MILLION)
- TABLE 23. NORTH AMERICA CLOUD RETAIL MARKET, BY SERVICE MODEL, 2022-2032 ($MILLION)
- TABLE 24. NORTH AMERICA CLOUD RETAIL MARKET, BY COUNTRY, 2022-2032 ($MILLION)
- TABLE 25. U.S. CLOUD RETAIL MARKET, BY SOLUTION, 2022-2032 ($MILLION)
- TABLE 26. U.S. CLOUD RETAIL MARKET, BY DEPLOYMENT MODEL, 2022-2032 ($MILLION)
- TABLE 27. U.S. CLOUD RETAIL MARKET, BY ENTERPRISE SIZE, 2022-2032 ($MILLION)
- TABLE 28. U.S. CLOUD RETAIL MARKET, BY SERVICE MODEL, 2022-2032 ($MILLION)
- TABLE 29. CANADA CLOUD RETAIL MARKET, BY SOLUTION, 2022-2032 ($MILLION)
- TABLE 30. CANADA CLOUD RETAIL MARKET, BY DEPLOYMENT MODEL, 2022-2032 ($MILLION)
- TABLE 31. CANADA CLOUD RETAIL MARKET, BY ENTERPRISE SIZE, 2022-2032 ($MILLION)
- TABLE 32. CANADA CLOUD RETAIL MARKET, BY SERVICE MODEL, 2022-2032 ($MILLION)
- TABLE 33. EUROPE CLOUD RETAIL MARKET, BY SOLUTION, 2022-2032 ($MILLION)
- TABLE 34. EUROPE CLOUD RETAIL MARKET, BY DEPLOYMENT MODEL, 2022-2032 ($MILLION)
- TABLE 35. EUROPE CLOUD RETAIL MARKET, BY ENTERPRISE SIZE, 2022-2032 ($MILLION)
- TABLE 36. EUROPE CLOUD RETAIL MARKET, BY SERVICE MODEL, 2022-2032 ($MILLION)
- TABLE 37. EUROPE CLOUD RETAIL MARKET, BY COUNTRY, 2022-2032 ($MILLION)
- TABLE 38. UK CLOUD RETAIL MARKET, BY SOLUTION, 2022-2032 ($MILLION)
- TABLE 39. UK CLOUD RETAIL MARKET, BY DEPLOYMENT MODEL, 2022-2032 ($MILLION)
- TABLE 40. UK CLOUD RETAIL MARKET, BY ENTERPRISE SIZE, 2022-2032 ($MILLION)
- TABLE 41. UK CLOUD RETAIL MARKET, BY SERVICE MODEL, 2022-2032 ($MILLION)
- TABLE 42. GERMANY CLOUD RETAIL MARKET, BY SOLUTION, 2022-2032 ($MILLION)
- TABLE 43. GERMANY CLOUD RETAIL MARKET, BY DEPLOYMENT MODEL, 2022-2032 ($MILLION)
- TABLE 44. GERMANY CLOUD RETAIL MARKET, BY ENTERPRISE SIZE, 2022-2032 ($MILLION)
- TABLE 45. GERMANY CLOUD RETAIL MARKET, BY SERVICE MODEL, 2022-2032 ($MILLION)
- TABLE 46. FRANCE CLOUD RETAIL MARKET, BY SOLUTION, 2022-2032 ($MILLION)
- TABLE 47. FRANCE CLOUD RETAIL MARKET, BY DEPLOYMENT MODEL, 2022-2032 ($MILLION)
- TABLE 48. FRANCE CLOUD RETAIL MARKET, BY ENTERPRISE SIZE, 2022-2032 ($MILLION)
- TABLE 49. FRANCE CLOUD RETAIL MARKET, BY SERVICE MODEL, 2022-2032 ($MILLION)
- TABLE 50. ITALY CLOUD RETAIL MARKET, BY SOLUTION, 2022-2032 ($MILLION)
- TABLE 51. ITALY CLOUD RETAIL MARKET, BY DEPLOYMENT MODEL, 2022-2032 ($MILLION)
- TABLE 52. ITALY CLOUD RETAIL MARKET, BY ENTERPRISE SIZE, 2022-2032 ($MILLION)
- TABLE 53. ITALY CLOUD RETAIL MARKET, BY SERVICE MODEL, 2022-2032 ($MILLION)
- TABLE 54. SPAIN CLOUD RETAIL MARKET, BY SOLUTION, 2022-2032 ($MILLION)
- TABLE 55. SPAIN CLOUD RETAIL MARKET, BY DEPLOYMENT MODEL, 2022-2032 ($MILLION)
- TABLE 56. SPAIN CLOUD RETAIL MARKET, BY ENTERPRISE SIZE, 2022-2032 ($MILLION)
- TABLE 57. SPAIN CLOUD RETAIL MARKET, BY SERVICE MODEL, 2022-2032 ($MILLION)
- TABLE 58. REST OF EUROPE CLOUD RETAIL MARKET, BY SOLUTION, 2022-2032 ($MILLION)
- TABLE 59. REST OF EUROPE CLOUD RETAIL MARKET, BY DEPLOYMENT MODEL, 2022-2032 ($MILLION)
- TABLE 60. REST OF EUROPE CLOUD RETAIL MARKET, BY ENTERPRISE SIZE, 2022-2032 ($MILLION)
- TABLE 61. REST OF EUROPE CLOUD RETAIL MARKET, BY SERVICE MODEL, 2022-2032 ($MILLION)
- TABLE 62. ASIA-PACIFIC CLOUD RETAIL MARKET, BY SOLUTION, 2022-2032 ($MILLION)
- TABLE 63. ASIA-PACIFIC CLOUD RETAIL MARKET, BY DEPLOYMENT MODEL, 2022-2032 ($MILLION)
- TABLE 64. ASIA-PACIFIC CLOUD RETAIL MARKET, BY ENTERPRISE SIZE, 2022-2032 ($MILLION)
- TABLE 65. ASIA-PACIFIC CLOUD RETAIL MARKET, BY SERVICE MODEL, 2022-2032 ($MILLION)
- TABLE 66. ASIA-PACIFIC CLOUD RETAIL MARKET, BY COUNTRY, 2022-2032 ($MILLION)
- TABLE 67. CHINA CLOUD RETAIL MARKET, BY SOLUTION, 2022-2032 ($MILLION)
- TABLE 68. CHINA CLOUD RETAIL MARKET, BY DEPLOYMENT MODEL, 2022-2032 ($MILLION)
- TABLE 69. CHINA CLOUD RETAIL MARKET, BY ENTERPRISE SIZE, 2022-2032 ($MILLION)
- TABLE 70. CHINA CLOUD RETAIL MARKET, BY SERVICE MODEL, 2022-2032 ($MILLION)
- TABLE 71. JAPAN CLOUD RETAIL MARKET, BY SOLUTION, 2022-2032 ($MILLION)
- TABLE 72. JAPAN CLOUD RETAIL MARKET, BY DEPLOYMENT MODEL, 2022-2032 ($MILLION)
- TABLE 73. JAPAN CLOUD RETAIL MARKET, BY ENTERPRISE SIZE, 2022-2032 ($MILLION)
- TABLE 74. JAPAN CLOUD RETAIL MARKET, BY SERVICE MODEL, 2022-2032 ($MILLION)
- TABLE 75. INDIA CLOUD RETAIL MARKET, BY SOLUTION, 2022-2032 ($MILLION)
- TABLE 76. INDIA CLOUD RETAIL MARKET, BY DEPLOYMENT MODEL, 2022-2032 ($MILLION)
- TABLE 77. INDIA CLOUD RETAIL MARKET, BY ENTERPRISE SIZE, 2022-2032 ($MILLION)
- TABLE 78. INDIA CLOUD RETAIL MARKET, BY SERVICE MODEL, 2022-2032 ($MILLION)
- TABLE 79. AUSTRALIA CLOUD RETAIL MARKET, BY SOLUTION, 2022-2032 ($MILLION)
- TABLE 80. AUSTRALIA CLOUD RETAIL MARKET, BY DEPLOYMENT MODEL, 2022-2032 ($MILLION)
- TABLE 81. AUSTRALIA CLOUD RETAIL MARKET, BY ENTERPRISE SIZE, 2022-2032 ($MILLION)
- TABLE 82. AUSTRALIA CLOUD RETAIL MARKET, BY SERVICE MODEL, 2022-2032 ($MILLION)
- TABLE 83. SOUTH KOREA CLOUD RETAIL MARKET, BY SOLUTION, 2022-2032 ($MILLION)
- TABLE 84. SOUTH KOREA CLOUD RETAIL MARKET, BY DEPLOYMENT MODEL, 2022-2032 ($MILLION)
- TABLE 85. SOUTH KOREA CLOUD RETAIL MARKET, BY ENTERPRISE SIZE, 2022-2032 ($MILLION)
- TABLE 86. SOUTH KOREA CLOUD RETAIL MARKET, BY SERVICE MODEL, 2022-2032 ($MILLION)
- TABLE 87. REST OF ASIA-PACIFIC CLOUD RETAIL MARKET, BY SOLUTION, 2022-2032 ($MILLION)
- TABLE 88. REST OF ASIA-PACIFIC CLOUD RETAIL MARKET, BY DEPLOYMENT MODEL, 2022-2032 ($MILLION)
- TABLE 89. REST OF ASIA-PACIFIC CLOUD RETAIL MARKET, BY ENTERPRISE SIZE, 2022-2032 ($MILLION)
- TABLE 90. REST OF ASIA-PACIFIC CLOUD RETAIL MARKET, BY SERVICE MODEL, 2022-2032 ($MILLION)
- TABLE 91. LAMEA CLOUD RETAIL MARKET, BY SOLUTION, 2022-2032 ($MILLION)
- TABLE 92. LAMEA CLOUD RETAIL MARKET, BY DEPLOYMENT MODEL, 2022-2032 ($MILLION)
- TABLE 93. LAMEA CLOUD RETAIL MARKET, BY ENTERPRISE SIZE, 2022-2032 ($MILLION)
- TABLE 94. LAMEA CLOUD RETAIL MARKET, BY SERVICE MODEL, 2022-2032 ($MILLION)
- TABLE 95. LAMEA CLOUD RETAIL MARKET, BY COUNTRY, 2022-2032 ($MILLION)
- TABLE 96. LATIN AMERICA CLOUD RETAIL MARKET, BY SOLUTION, 2022-2032 ($MILLION)
- TABLE 97. LATIN AMERICA CLOUD RETAIL MARKET, BY DEPLOYMENT MODEL, 2022-2032 ($MILLION)
- TABLE 98. LATIN AMERICA CLOUD RETAIL MARKET, BY ENTERPRISE SIZE, 2022-2032 ($MILLION)
- TABLE 99. LATIN AMERICA CLOUD RETAIL MARKET, BY SERVICE MODEL, 2022-2032 ($MILLION)
- TABLE 100. MIDDLE EAST CLOUD RETAIL MARKET, BY SOLUTION, 2022-2032 ($MILLION)
- TABLE 101. MIDDLE EAST CLOUD RETAIL MARKET, BY DEPLOYMENT MODEL, 2022-2032 ($MILLION)
- TABLE 102. MIDDLE EAST CLOUD RETAIL MARKET, BY ENTERPRISE SIZE, 2022-2032 ($MILLION)
- TABLE 103. MIDDLE EAST CLOUD RETAIL MARKET, BY SERVICE MODEL, 2022-2032 ($MILLION)
- TABLE 104. AFRICA CLOUD RETAIL MARKET, BY SOLUTION, 2022-2032 ($MILLION)
- TABLE 105. AFRICA CLOUD RETAIL MARKET, BY DEPLOYMENT MODEL, 2022-2032 ($MILLION)
- TABLE 106. AFRICA CLOUD RETAIL MARKET, BY ENTERPRISE SIZE, 2022-2032 ($MILLION)
- TABLE 107. AFRICA CLOUD RETAIL MARKET, BY SERVICE MODEL, 2022-2032 ($MILLION)
- TABLE 108. SAP SE: KEY EXECUTIVES
- TABLE 109. SAP SE: COMPANY SNAPSHOT
- TABLE 110. SAP SE: SERVICE SEGMENTS
- TABLE 111. SAP SE: PRODUCT PORTFOLIO
- TABLE 112. SAP SE: KEY STRATERGIES
- TABLE 113. FUJITSU: KEY EXECUTIVES
- TABLE 114. FUJITSU: COMPANY SNAPSHOT
- TABLE 115. FUJITSU: SERVICE SEGMENTS
- TABLE 116. FUJITSU: PRODUCT PORTFOLIO
- TABLE 117. FUJITSU: KEY STRATERGIES
- TABLE 118. ORACLE CORPORATION: KEY EXECUTIVES
- TABLE 119. ORACLE CORPORATION: COMPANY SNAPSHOT
- TABLE 120. ORACLE CORPORATION: SERVICE SEGMENTS
- TABLE 121. ORACLE CORPORATION: PRODUCT PORTFOLIO
- TABLE 122. ORACLE CORPORATION: KEY STRATERGIES
- TABLE 123. INFOR INC.: KEY EXECUTIVES
- TABLE 124. INFOR INC.: COMPANY SNAPSHOT
- TABLE 125. INFOR INC.: SERVICE SEGMENTS
- TABLE 126. INFOR INC.: PRODUCT PORTFOLIO
- TABLE 127. INFOR INC.: KEY STRATERGIES
- TABLE 128. AMAZON WEB SERVICES, INC.: KEY EXECUTIVES
- TABLE 129. AMAZON WEB SERVICES, INC.: COMPANY SNAPSHOT
- TABLE 130. AMAZON WEB SERVICES, INC.: SERVICE SEGMENTS
- TABLE 131. AMAZON WEB SERVICES, INC.: PRODUCT PORTFOLIO
- TABLE 132. AMAZON WEB SERVICES, INC.: KEY STRATERGIES
- TABLE 133. CISCO SYSTEMS, INC.: KEY EXECUTIVES
- TABLE 134. CISCO SYSTEMS, INC.: COMPANY SNAPSHOT
- TABLE 135. CISCO SYSTEMS, INC.: SERVICE SEGMENTS
- TABLE 136. CISCO SYSTEMS, INC.: PRODUCT PORTFOLIO
- TABLE 137. CISCO SYSTEMS, INC.: KEY STRATERGIES
- TABLE 138. IBM CORPORATION: KEY EXECUTIVES
- TABLE 139. IBM CORPORATION: COMPANY SNAPSHOT
- TABLE 140. IBM CORPORATION: SERVICE SEGMENTS
- TABLE 141. IBM CORPORATION: PRODUCT PORTFOLIO
- TABLE 142. IBM CORPORATION: KEY STRATERGIES
- TABLE 143. EPICOR SOFTWARE CORPORATION: KEY EXECUTIVES
- TABLE 144. EPICOR SOFTWARE CORPORATION: COMPANY SNAPSHOT
- TABLE 145. EPICOR SOFTWARE CORPORATION: PRODUCT SEGMENTS
- TABLE 146. EPICOR SOFTWARE CORPORATION: PRODUCT PORTFOLIO
- TABLE 147. EPICOR SOFTWARE CORPORATION: KEY STRATERGIES
- TABLE 148. MICROSOFT CORPORATION: KEY EXECUTIVES
- TABLE 149. MICROSOFT CORPORATION: COMPANY SNAPSHOT
- TABLE 150. MICROSOFT CORPORATION: SERVICE SEGMENTS
- TABLE 151. MICROSOFT CORPORATION: PRODUCT PORTFOLIO
- TABLE 152. MICROSOFT CORPORATION: KEY STRATERGIES
- TABLE 153. GOOGLE LLC: KEY EXECUTIVES
- TABLE 154. GOOGLE LLC: COMPANY SNAPSHOT
- TABLE 155. GOOGLE LLC: SERVICE SEGMENTS
- TABLE 156. GOOGLE LLC: PRODUCT PORTFOLIO
- TABLE 157. GOOGLE LLC: KEY STRATERGIES
LIST OF FIGURES
- FIGURE 01. CLOUD RETAIL MARKET, 2022-2032
- FIGURE 02. SEGMENTATION OF CLOUD RETAIL MARKET,2022-2032
- FIGURE 03. TOP INVESTMENT POCKETS IN CLOUD RETAIL MARKET (2023-2032)
- FIGURE 04. LOW BARGAINING POWER OF SUPPLIERS
- FIGURE 05. LOW THREAT OF NEW ENTRANTS
- FIGURE 06. LOW THREAT OF SUBSTITUTES
- FIGURE 07. LOW INTENSITY OF RIVALRY
- FIGURE 08. LOW BARGAINING POWER OF BUYERS
- FIGURE 09. GLOBAL CLOUD RETAIL MARKET:DRIVERS, RESTRAINTS AND OPPORTUNITIES
- FIGURE 10. CLOUD RETAIL MARKET, BY SOLUTION, 2022(%)
- FIGURE 11. COMPARATIVE SHARE ANALYSIS OF CLOUD RETAIL MARKET FOR SUPPLY CHAIN MANAGEMENT, BY COUNTRY 2022 AND 2032(%)
- FIGURE 12. COMPARATIVE SHARE ANALYSIS OF CLOUD RETAIL MARKET FOR CUSTOMER MANAGEMENT, BY COUNTRY 2022 AND 2032(%)
- FIGURE 13. COMPARATIVE SHARE ANALYSIS OF CLOUD RETAIL MARKET FOR WORKFORCE MANAGEMENT, BY COUNTRY 2022 AND 2032(%)
- FIGURE 14. COMPARATIVE SHARE ANALYSIS OF CLOUD RETAIL MARKET FOR REPORTING AND ANALYTICS, BY COUNTRY 2022 AND 2032(%)
- FIGURE 15. COMPARATIVE SHARE ANALYSIS OF CLOUD RETAIL MARKET FOR DATA SECURITY, BY COUNTRY 2022 AND 2032(%)
- FIGURE 16. COMPARATIVE SHARE ANALYSIS OF CLOUD RETAIL MARKET FOR OTHERS, BY COUNTRY 2022 AND 2032(%)
- FIGURE 17. CLOUD RETAIL MARKET, BY DEPLOYMENT MODEL, 2022(%)
- FIGURE 18. COMPARATIVE SHARE ANALYSIS OF CLOUD RETAIL MARKET FOR PUBLIC CLOUD, BY COUNTRY 2022 AND 2032(%)
- FIGURE 19. COMPARATIVE SHARE ANALYSIS OF CLOUD RETAIL MARKET FOR PRIVATE CLOUD, BY COUNTRY 2022 AND 2032(%)
- FIGURE 20. COMPARATIVE SHARE ANALYSIS OF CLOUD RETAIL MARKET FOR HYBRID CLOUD, BY COUNTRY 2022 AND 2032(%)
- FIGURE 21. CLOUD RETAIL MARKET, BY ENTERPRISE SIZE, 2022(%)
- FIGURE 22. COMPARATIVE SHARE ANALYSIS OF CLOUD RETAIL MARKET FOR LARGE ENTERPRISES, BY COUNTRY 2022 AND 2032(%)
- FIGURE 23. COMPARATIVE SHARE ANALYSIS OF CLOUD RETAIL MARKET FOR SMALL AND MEDIUM-SIZED ENTERPRISES, BY COUNTRY 2022 AND 2032(%)
- FIGURE 24. CLOUD RETAIL MARKET, BY SERVICE MODEL, 2022(%)
- FIGURE 25. COMPARATIVE SHARE ANALYSIS OF CLOUD RETAIL MARKET FOR SOFTWARE AS A SERVICE (SAAS), BY COUNTRY 2022 AND 2032(%)
- FIGURE 26. COMPARATIVE SHARE ANALYSIS OF CLOUD RETAIL MARKET FOR PLATFORM AS SERVICE (PAAS), BY COUNTRY 2022 AND 2032(%)
- FIGURE 27. COMPARATIVE SHARE ANALYSIS OF CLOUD RETAIL MARKET FOR INFRASTRUCTURE AS A SERVICE (IAAS), BY COUNTRY 2022 AND 2032(%)
- FIGURE 28. CLOUD RETAIL MARKET BY REGION, 2022(%)
- FIGURE 29. U.S. CLOUD RETAIL MARKET, 2022-2032 ($MILLION)
- FIGURE 30. CANADA CLOUD RETAIL MARKET, 2022-2032 ($MILLION)
- FIGURE 31. UK CLOUD RETAIL MARKET, 2022-2032 ($MILLION)
- FIGURE 32. GERMANY CLOUD RETAIL MARKET, 2022-2032 ($MILLION)
- FIGURE 33. FRANCE CLOUD RETAIL MARKET, 2022-2032 ($MILLION)
- FIGURE 34. ITALY CLOUD RETAIL MARKET, 2022-2032 ($MILLION)
- FIGURE 35. SPAIN CLOUD RETAIL MARKET, 2022-2032 ($MILLION)
- FIGURE 36. REST OF EUROPE CLOUD RETAIL MARKET, 2022-2032 ($MILLION)
- FIGURE 37. CHINA CLOUD RETAIL MARKET, 2022-2032 ($MILLION)
- FIGURE 38. JAPAN CLOUD RETAIL MARKET, 2022-2032 ($MILLION)
- FIGURE 39. INDIA CLOUD RETAIL MARKET, 2022-2032 ($MILLION)
- FIGURE 40. AUSTRALIA CLOUD RETAIL MARKET, 2022-2032 ($MILLION)
- FIGURE 41. SOUTH KOREA CLOUD RETAIL MARKET, 2022-2032 ($MILLION)
- FIGURE 42. REST OF ASIA-PACIFIC CLOUD RETAIL MARKET, 2022-2032 ($MILLION)
- FIGURE 43. LATIN AMERICA CLOUD RETAIL MARKET, 2022-2032 ($MILLION)
- FIGURE 44. MIDDLE EAST CLOUD RETAIL MARKET, 2022-2032 ($MILLION)
- FIGURE 45. AFRICA CLOUD RETAIL MARKET, 2022-2032 ($MILLION)
- FIGURE 46. TOP WINNING STRATEGIES, BY YEAR (2020-2023)
- FIGURE 47. TOP WINNING STRATEGIES, BY DEVELOPMENT (2020-2023)
- FIGURE 48. TOP WINNING STRATEGIES, BY COMPANY (2020-2023)
- FIGURE 49. PRODUCT MAPPING OF TOP 10 PLAYERS
- FIGURE 50. COMPETITIVE DASHBOARD
- FIGURE 51. COMPETITIVE HEATMAP: CLOUD RETAIL MARKET
- FIGURE 52. TOP PLAYER POSITIONING, 2022
- FIGURE 53. SAP SE: NET REVENUE, 2020-2022 ($MILLION)
- FIGURE 54. SAP SE: RESEARCH & DEVELOPMENT EXPENDITURE, 2020-2022 ($MILLION)
- FIGURE 55. SAP SE: REVENUE SHARE BY SEGMENT, 2022 (%)
- FIGURE 56. SAP SE: REVENUE SHARE BY REGION, 2022 (%)
- FIGURE 57. FUJITSU: NET REVENUE, 2020-2022 ($MILLION)
- FIGURE 58. FUJITSU: RESEARCH & DEVELOPMENT EXPENDITURE, 2020-2022 ($MILLION)
- FIGURE 59. FUJITSU: REVENUE SHARE BY SEGMENT, 2022 (%)
- FIGURE 60. FUJITSU: REVENUE SHARE BY REGION, 2022 (%)
- FIGURE 61. ORACLE CORPORATION: NET REVENUE, 2020-2022 ($MILLION)
- FIGURE 62. ORACLE CORPORATION: RESEARCH & DEVELOPMENT EXPENDITURE, 2020-2022 ($MILLION)
- FIGURE 63. ORACLE CORPORATION: REVENUE SHARE BY SEGMENT, 2022 (%)
- FIGURE 64. ORACLE CORPORATION: REVENUE SHARE BY REGION, 2022 (%)
- FIGURE 65. AMAZON WEB SERVICES, INC.: NET REVENUE, 2020-2022 ($MILLION)
- FIGURE 66. AMAZON WEB SERVICES, INC.: REVENUE SHARE BY SEGMENT, 2022 (%)
- FIGURE 67. AMAZON WEB SERVICES, INC.: REVENUE SHARE BY REGION, 2022 (%)
- FIGURE 68. CISCO SYSTEMS, INC.: NET REVENUE, 2020-2022 ($MILLION)
- FIGURE 69. CISCO SYSTEMS, INC.: RESEARCH & DEVELOPMENT EXPENDITURE, 2020-2022 ($MILLION)
- FIGURE 70. CISCO SYSTEMS, INC.: REVENUE SHARE BY SEGMENT, 2022 (%)
- FIGURE 71. IBM CORPORATION: NET REVENUE, 2020-2022 ($MILLION)
- FIGURE 72. IBM CORPORATION: RESEARCH & DEVELOPMENT EXPENDITURE, 2020-2022 ($MILLION)
- FIGURE 73. IBM CORPORATION: REVENUE SHARE BY SEGMENT, 2022 (%)
- FIGURE 74. IBM CORPORATION: REVENUE SHARE BY REGION, 2022 (%)
- FIGURE 75. MICROSOFT CORPORATION: NET REVENUE, 2020-2022 ($MILLION)
- FIGURE 76. MICROSOFT CORPORATION: RESEARCH & DEVELOPMENT EXPENDITURE, 2020-2022 ($MILLION)
- FIGURE 77. MICROSOFT CORPORATION: REVENUE SHARE BY SEGMENT, 2022 (%)
- FIGURE 78. MICROSOFT CORPORATION: REVENUE SHARE BY REGION, 2022 (%)
- FIGURE 79. GOOGLE LLC: NET REVENUE, 2020-2022 ($MILLION)
- FIGURE 80. GOOGLE LLC: RESEARCH & DEVELOPMENT EXPENDITURE, 2020-2022 ($MILLION)
- FIGURE 81. GOOGLE LLC: REVENUE SHARE BY SEGMENT, 2022 (%)
- FIGURE 82. GOOGLE LLC: REVENUE SHARE BY REGION, 2022 (%)
 工業物聯網人工智慧中的雲端運算 2024 年全球市場報告
 雲端運算 -市場佔有率分析、產業趨勢與統計、2024-2029 年成長預測
 全球雲端運算市場:按服務模型、部署模型、組織規模、產業、地區分類 - 到 2028 年的預測
 軍事雲端運算市場:按部署、範圍、應用程式和最終用戶分類 - 2023-2030 年全球預測
 中東和非洲雲端運算市場:按 IaaS、按 PaaS、按 SaaS、按產品、按部署模式、按行業、按地區 - 到 2028 年的預測
 全球軍事雲端運算市場:依部署類型(公共雲端端私有雲端、混合雲端)、服務模式(基礎設施即服務、平台即服務、軟體即服務)、用途、最終用戶和區域
 2023-2030 年全球軍事雲端運算市場
 雲端運算市場規模、佔有率、趨勢分析報告:按服務、部署、公司規模、最終用途、地區和細分市場進行預測,2023-2030 年
 雲端計算市場:按類型、按服務、按最終用戶、按地區、機會、預測,2016-2030 年
 全球教育雲端運算市場