


 |
市場調查報告書
商品編碼
1365677
乙太網路供電 (POE) 照明市場:按產品供應、按瓦數、按用途:2023-2032 年全球機會分析和產業預測Power Over Ethernet (Poe) Lighting Market By Offering (Hardware, Software, Services), By Wattage (Upto 25 Watt, Above 25 Watt), By Application (Commercial, Residential, Industrial): Global Opportunity Analysis and Industry Forecast, 2023-2032 |
||||||
2022 年 PoE(乙太網路供電)照明市場價值為 7 億美元,預計 2023 年至 2032 年年複合成長率為 31.6%,到 2032 年將達到 113 億美元。
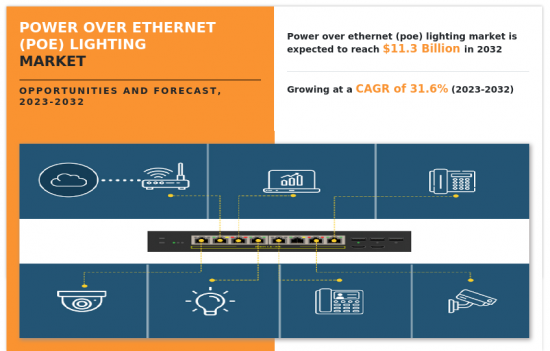
PoE照明包括供電設備(PSE)和受電設備(PD)。電源供應器向乙太網路電纜發送電力,LED 燈等電源設備接收電力並在沒有專用電氣連接的情況下運作。 PoE 照明系統還包括網路交換器、電纜和控制軟體,以實現高級功能並與其他建築系統整合。
LED 照明因其能源效率高、使用壽命長且光輸出可控而成為 PoE 照明系統的熱門選擇。 LED 照明比傳統照明消耗更少的電量,並提供色溫和調光功能的彈性。它與 PoE 技術相容,可輕鬆整合到 PoE 照明系統中,從而形成高效且可自訂的照明解決方案。
PoE 照明的最終用戶涵蓋各個領域。在商業領域,最終用戶包括辦公室、零售店、飯店和餐廳。製造工廠和倉庫等工業設施也是主要的最終用戶。機場、火車站和政府大樓等公共場所依靠 PoE 照明來提高安全性和效率。住宅用戶受益於 PoE 照明的便利性和能源效率。
由於全球連接需求、政府配合措施和投資的增加,預計乙太網路供電照明市場將在預測期內大幅擴張。此外,在預測期內,乙太網路供電照明市場預計將見證智慧工作場所需求的成長。相反,PoE 設備、配件和服務的高昂初始成本預計將成為預測期內乙太網路供電照明市場成長的限制要素。
乙太網路供電照明市場格局按產品、功率、用途和地區細分。在提供的基礎上,乙太網路供電照明市場分析分為硬體、軟體和服務。到 2022 年,硬體領域預計將在收益方面佔據市場主導地位,並在 2032 年之前佔據主要市場佔有率。依瓦數分類,乙太網路供電照明市場佔有率分為 25 瓦以下和 25 瓦以上。 25W及以上細分市場預計將在2022年佔據最大佔有率,並在2023年至2032年期間以大幅年複合成長率成長。按應用分類,乙太網路供電照明市場規模分為商業、住宅和工業。工業領域預計將在 2022 年獲得最大佔有率,商業領域預計從 2023 年至 2032 年將以複合年複合成長率大幅成長。
依地區分類,北美(美國、加拿大、墨西哥)、歐洲(英國、德國、法國、其他歐洲國家地區)、亞太地區(中國、日本、印度、韓國、其他亞太地區)、拉丁美洲(拉丁美洲) 、中東、非洲乙太網路供電照明市場趨勢)進行了分析。
本報告提供的全球乙太網路供電照明市場主要企業的競爭分析和概況包括 ALLNet GmbH、Axis Lighting、CISCO SYSTEMS、HE Williams、Herbert Waldmann GmbH &Co.Kg(Waldmann Lighting)、Hubbell Inc.、Molex(Koch) Industries)、Signify Holding(飛利浦照明)、Ubiquiti Networks Inc. 和Wipro Lighting。乙太網路供電照明市場主要企業採取的主要策略是產品推出和合作。
目錄
第1章 簡介
第2章 執行摘要
第3章 市場概況
- 市場定義和範圍
- 主要發現
- 影響要素
- 主要投資機會
- 波特五力分析
- 市場動態
- 促進因素
- 全球連結需求不斷成長
- 政府措施和投資
- 抑制因素
- PoE 設備、配件和服務的初始成本較高
- 機會
- 對智慧職場的需求不斷增加
- 促進因素
- COVID-19 市場影響分析
第4章 POE(乙太網路供電)照明市場:依按產品分類
- 概述
- 硬體
- 軟體
- 服務
第5章 POE照明市場:按電量
- 概述
- 高達 25 瓦
- 25瓦或以上
第6章 POE 照明市場:依用途
- 概述
- 商業的
- 住宅
- 工業的
第7章 POE 照明市場 POE(乙太網路供電)照明市場:按地區
- 概述
- 北美洲
- 美國
- 加拿大
- 墨西哥
- 歐洲
- 英國
- 德國
- 法國
- 其他
- 亞太地區
- 中國
- 日本
- 印度
- 韓國
- 其他
- 拉丁美洲
- 拉丁美洲
- 中東
- 非洲
第8章 競爭形勢
- 介紹
- 關鍵成功策略
- 10家主要企業產品圖譜
- 競爭儀表板
- 競爭熱圖
- 2022年主要企業定位
第9章 公司簡介
- ALLNet GmbH
- Axis Lighting
- Cisco Systems, Inc.
- HE Williams Inc.
- Herbert Waldmann GmbH & Co. KG
- Hubbell.Inc
- Molex LLC.
- Philips Lighting(Signify Holding)
- Ubiquiti Networks Inc.
- Wipro Lighting
According to a new report published by Allied Market Research, titled, "Power Over Ethernet (Poe) Lighting Market," The power over ethernet (poe) lighting market was valued at $0.7 billion in 2022, and is estimated to reach $11.3 billion by 2032, growing at a CAGR of 31.6% from 2023 to 2032.
The offerings of PoE lighting include Power Sourcing Equipment (PSE) and Powered Devices (PD). The power source equipment sends the power onto the Ethernet cable, while the power devices, such as LED lights, receives power and operates without a dedicated electrical connection. PoE lighting systems can also include network switches, cables, and control software for advanced functionality and integration with other building systems.
LED lights are a popular choice for PoE lighting systems due to their energy efficiency, long lifespan, and controllable lighting output. LED lights consume less energy than traditional lighting sources and offer flexibility in color temperature and dimming capabilities. They are compatible with PoE technology and can be easily integrated into PoE lighting systems for efficient and customizable lighting solutions.
The end users of PoE lighting span across different sectors. In the commercial sector, end users include offices, retail stores, hotels, and restaurants. Industrial facilities, such as manufacturing plants and warehouses, are also key end users. Public spaces like airports, railway stations, and government buildings utilize PoE lighting for enhanced safety and efficiency. Residential users benefit from the convenience and energy efficiency of PoE lighting in their homes.
The power over ethernet lighting market is anticipated to expand significantly during the forecast period owing to increase in global connectivity demand, and government initiatives and investments. In addition, during the forecast period, the power over ethernet lighting market is expected to witness an , increase in demand for intelligent workplaces. On the contrary, high initial costs of PoE equipment, accessories and services are the factors expected to restrain the growth of the power over ethernet lighting market during the forecast period.
The power over ethernet lighting market outlook is segmented on the basis of offering, wattage, application, and region. On the basis of offering, the power over ethernet lighting market analysis is divided into hardware, software, and services. In 2022, the hardware segment dominated the market, in terms of revenue, and it is expected to acquire major market share till 2032. On the basis of wattage, the power over ethernet lighting market share is segregated into upto 25 Watt, and above 25 Watt. The above 25 Watt segment acquired the largest share in 2022 and is is expected to grow at a significant CAGR from 2023 to 2032. On the basis of application, the power over ethernet lighting market size is segregated into commercial, residential, and industrial. The industrial segment acquired the largest share in 2022 and commercial segment is expected to grow at a significant CAGR from 2023 to 2032.
Region-wise, the power over ethernet lighting market trends are analyzed across North America (the U.S., Canada, and Mexico), Europe (UK, Germany, France, and rest of Europe), Asia-Pacific (China, Japan, India, South Korea, and rest of Asia-Pacific), and LAMEA (Latin America, Middle East, and Africa).
Competitive analysis and profiles of the major global power over ethernet lighting market players that have been provided in the report include ALLNet GmbH, Axis Lighting, CISCO SYSTEMS, H.E. Williams, Herbert Waldmann GmbH & Co. Kg (Waldmann Lighting), Hubbell Inc., Molex (Koch Industries), Signify Holding (Philips Lighting), Ubiquiti Networks Inc., and Wipro Lighting. The key strategies adopted by the major players of the power over ethernet lighting market are product launch, and collaboration.
Key Benefits For Stakeholders
- This report provides a quantitative analysis of the market segments, current trends, estimations, and dynamics of the power over ethernet (poe) lighting market analysis from 2022 to 2032 to identify the prevailing power over ethernet (poe) lighting market opportunities.
- The market research is offered along with information related to key drivers, restraints, and opportunities.
- Porter's five forces analysis highlights the potency of buyers and suppliers to enable stakeholders make profit-oriented business decisions and strengthen their supplier-buyer network.
- In-depth analysis of the power over ethernet (poe) lighting market segmentation assists to determine the prevailing market opportunities.
- Major countries in each region are mapped according to their revenue contribution to the global market.
- Market player positioning facilitates benchmarking and provides a clear understanding of the present position of the market players.
- The report includes the analysis of the regional as well as global power over ethernet (poe) lighting market trends, key players, market segments, application areas, and market growth strategies.
Additional benefits you will get with this purchase are:
- Quarterly Update and* (only available with a corporate license, on listed price)
- 5 additional Company Profile of client Choice pre- or Post-purchase, as a free update.
- Free Upcoming Version on the Purchase of Five and Enterprise User License.
- 16 analyst hours of support* (post-purchase, if you find additional data requirements upon review of the report, you may receive support amounting to 16 analyst hours to solve questions, and post-sale queries)
- 15% Free Customization* (in case the scope or segment of the report does not match your requirements, 20% is equivalent to 3 working days of free work, applicable once)
- Free data Pack on the Five and Enterprise User License. (Excel version of the report)
- Free Updated report if the report is 6-12 months old or older.
- 24-hour priority response*
- Free Industry updates and white papers.
Possible Customization with this report (with additional cost and timeline talk to the sales executive to know more)
- Product Benchmarking / Product specification and applications
- Market share analysis of players by products/segments
- New Product Development/ Product Matrix of Key Players
- Additional company profiles with specific to client's interest
- Key player details (including location, contact details, supplier/vendor network etc. in excel format)
Key Market Segments
By Offering
- Hardware
- Software
- Services
By Wattage
- Upto 25 Watt
- Above 25 Watt
By Application
- Commercial
- Residential
- Industrial
By Region
- North America
- U.S.
- Canada
- Mexico
- Europe
- UK
- Germany
- France
- Rest of Europe
- Asia-Pacific
- China
- Japan
- India
- South Korea
- Rest of Asia-Pacific
- LAMEA
- Latin America
- Middle East
- Africa
Key Market Players:
- ALLNet GmbH
- Axis Lighting
- Cisco Systems, Inc.
- Herbert Waldmann GmbH & Co. KG
- H.E. Williams Inc.
- Hubbell.Inc
- Molex LLC.
- Philips Lighting (Signify Holding)
- Ubiquiti Networks Inc.
- Wipro Lighting
TABLE OF CONTENTS
CHAPTER 1: INTRODUCTION
- 1.1. Report description
- 1.2. Key market segments
- 1.3. Key benefits to the stakeholders
- 1.4. Research Methodology
- 1.4.1. Primary research
- 1.4.2. Secondary research
- 1.4.3. Analyst tools and models
CHAPTER 2: EXECUTIVE SUMMARY
- 2.1. CXO Perspective
CHAPTER 3: MARKET OVERVIEW
- 3.1. Market definition and scope
- 3.2. Key findings
- 3.2.1. Top impacting factors
- 3.2.2. Top investment pockets
- 3.3. Porter's five forces analysis
- 3.3.1. Moderate to high bargaining power of suppliers
- 3.3.2. Moderate to high threat of new entrants
- 3.3.3. Moderate to high threat of substitutes
- 3.3.4. Low to high intensity of rivalry
- 3.3.5. Moderate to high bargaining power of buyers
- 3.4. Market dynamics
- 3.4.1. Drivers
- 3.4.1.1. Increase in global connectivity demand
- 3.4.1.2. Government initiatives and investments
- 3.4.1. Drivers
- 3.4.2. Restraints
- 3.4.2.1. High initial costs of PoE equipment, accessories and services
- 3.4.3. Opportunities
- 3.4.3.1. Increase in demand for intelligent workplaces
- 3.5. COVID-19 Impact Analysis on the market
CHAPTER 4: POWER OVER ETHERNET (POE) LIGHTING MARKET, BY OFFERING
- 4.1. Overview
- 4.1.1. Market size and forecast
- 4.2. Hardware
- 4.2.1. Key market trends, growth factors and opportunities
- 4.2.2. Market size and forecast, by region
- 4.2.3. Market share analysis by country
- 4.3. Software
- 4.3.1. Key market trends, growth factors and opportunities
- 4.3.2. Market size and forecast, by region
- 4.3.3. Market share analysis by country
- 4.4. Services
- 4.4.1. Key market trends, growth factors and opportunities
- 4.4.2. Market size and forecast, by region
- 4.4.3. Market share analysis by country
CHAPTER 5: POWER OVER ETHERNET (POE) LIGHTING MARKET, BY WATTAGE
- 5.1. Overview
- 5.1.1. Market size and forecast
- 5.2. Upto 25 Watt
- 5.2.1. Key market trends, growth factors and opportunities
- 5.2.2. Market size and forecast, by region
- 5.2.3. Market share analysis by country
- 5.3. Above 25 Watt
- 5.3.1. Key market trends, growth factors and opportunities
- 5.3.2. Market size and forecast, by region
- 5.3.3. Market share analysis by country
CHAPTER 6: POWER OVER ETHERNET (POE) LIGHTING MARKET, BY APPLICATION
- 6.1. Overview
- 6.1.1. Market size and forecast
- 6.2. Commercial
- 6.2.1. Key market trends, growth factors and opportunities
- 6.2.2. Market size and forecast, by region
- 6.2.3. Market share analysis by country
- 6.3. Residential
- 6.3.1. Key market trends, growth factors and opportunities
- 6.3.2. Market size and forecast, by region
- 6.3.3. Market share analysis by country
- 6.4. Industrial
- 6.4.1. Key market trends, growth factors and opportunities
- 6.4.2. Market size and forecast, by region
- 6.4.3. Market share analysis by country
CHAPTER 7: POWER OVER ETHERNET (POE) LIGHTING MARKET, BY REGION
- 7.1. Overview
- 7.1.1. Market size and forecast By Region
- 7.2. North America
- 7.2.1. Key trends and opportunities
- 7.2.2. Market size and forecast, by Offering
- 7.2.3. Market size and forecast, by Wattage
- 7.2.4. Market size and forecast, by Application
- 7.2.5. Market size and forecast, by country
- 7.2.5.1. U.S.
- 7.2.5.1.1. Key market trends, growth factors and opportunities
- 7.2.5.1.2. Market size and forecast, by Offering
- 7.2.5.1.3. Market size and forecast, by Wattage
- 7.2.5.1.4. Market size and forecast, by Application
- 7.2.5.2. Canada
- 7.2.5.2.1. Key market trends, growth factors and opportunities
- 7.2.5.2.2. Market size and forecast, by Offering
- 7.2.5.2.3. Market size and forecast, by Wattage
- 7.2.5.2.4. Market size and forecast, by Application
- 7.2.5.3. Mexico
- 7.2.5.3.1. Key market trends, growth factors and opportunities
- 7.2.5.3.2. Market size and forecast, by Offering
- 7.2.5.3.3. Market size and forecast, by Wattage
- 7.2.5.3.4. Market size and forecast, by Application
- 7.3. Europe
- 7.3.1. Key trends and opportunities
- 7.3.2. Market size and forecast, by Offering
- 7.3.3. Market size and forecast, by Wattage
- 7.3.4. Market size and forecast, by Application
- 7.3.5. Market size and forecast, by country
- 7.3.5.1. UK
- 7.3.5.1.1. Key market trends, growth factors and opportunities
- 7.3.5.1.2. Market size and forecast, by Offering
- 7.3.5.1.3. Market size and forecast, by Wattage
- 7.3.5.1.4. Market size and forecast, by Application
- 7.3.5.2. Germany
- 7.3.5.2.1. Key market trends, growth factors and opportunities
- 7.3.5.2.2. Market size and forecast, by Offering
- 7.3.5.2.3. Market size and forecast, by Wattage
- 7.3.5.2.4. Market size and forecast, by Application
- 7.3.5.3. France
- 7.3.5.3.1. Key market trends, growth factors and opportunities
- 7.3.5.3.2. Market size and forecast, by Offering
- 7.3.5.3.3. Market size and forecast, by Wattage
- 7.3.5.3.4. Market size and forecast, by Application
- 7.3.5.4. Rest of Europe
- 7.3.5.4.1. Key market trends, growth factors and opportunities
- 7.3.5.4.2. Market size and forecast, by Offering
- 7.3.5.4.3. Market size and forecast, by Wattage
- 7.3.5.4.4. Market size and forecast, by Application
- 7.4. Asia-Pacific
- 7.4.1. Key trends and opportunities
- 7.4.2. Market size and forecast, by Offering
- 7.4.3. Market size and forecast, by Wattage
- 7.4.4. Market size and forecast, by Application
- 7.4.5. Market size and forecast, by country
- 7.4.5.1. China
- 7.4.5.1.1. Key market trends, growth factors and opportunities
- 7.4.5.1.2. Market size and forecast, by Offering
- 7.4.5.1.3. Market size and forecast, by Wattage
- 7.4.5.1.4. Market size and forecast, by Application
- 7.4.5.2. Japan
- 7.4.5.2.1. Key market trends, growth factors and opportunities
- 7.4.5.2.2. Market size and forecast, by Offering
- 7.4.5.2.3. Market size and forecast, by Wattage
- 7.4.5.2.4. Market size and forecast, by Application
- 7.4.5.3. India
- 7.4.5.3.1. Key market trends, growth factors and opportunities
- 7.4.5.3.2. Market size and forecast, by Offering
- 7.4.5.3.3. Market size and forecast, by Wattage
- 7.4.5.3.4. Market size and forecast, by Application
- 7.4.5.4. South Korea
- 7.4.5.4.1. Key market trends, growth factors and opportunities
- 7.4.5.4.2. Market size and forecast, by Offering
- 7.4.5.4.3. Market size and forecast, by Wattage
- 7.4.5.4.4. Market size and forecast, by Application
- 7.4.5.5. Rest of Asia-Pacific
- 7.4.5.5.1. Key market trends, growth factors and opportunities
- 7.4.5.5.2. Market size and forecast, by Offering
- 7.4.5.5.3. Market size and forecast, by Wattage
- 7.4.5.5.4. Market size and forecast, by Application
- 7.5. LAMEA
- 7.5.1. Key trends and opportunities
- 7.5.2. Market size and forecast, by Offering
- 7.5.3. Market size and forecast, by Wattage
- 7.5.4. Market size and forecast, by Application
- 7.5.5. Market size and forecast, by country
- 7.5.5.1. Latin America
- 7.5.5.1.1. Key market trends, growth factors and opportunities
- 7.5.5.1.2. Market size and forecast, by Offering
- 7.5.5.1.3. Market size and forecast, by Wattage
- 7.5.5.1.4. Market size and forecast, by Application
- 7.5.5.2. Middle East
- 7.5.5.2.1. Key market trends, growth factors and opportunities
- 7.5.5.2.2. Market size and forecast, by Offering
- 7.5.5.2.3. Market size and forecast, by Wattage
- 7.5.5.2.4. Market size and forecast, by Application
- 7.5.5.3. Africa
- 7.5.5.3.1. Key market trends, growth factors and opportunities
- 7.5.5.3.2. Market size and forecast, by Offering
- 7.5.5.3.3. Market size and forecast, by Wattage
- 7.5.5.3.4. Market size and forecast, by Application
CHAPTER 8: COMPETITIVE LANDSCAPE
- 8.1. Introduction
- 8.2. Top winning strategies
- 8.3. Product Mapping of Top 10 Player
- 8.4. Competitive Dashboard
- 8.5. Competitive Heatmap
- 8.6. Top player positioning, 2022
CHAPTER 9: COMPANY PROFILES
- 9.1. ALLNet GmbH
- 9.1.1. Company overview
- 9.1.2. Key Executives
- 9.1.3. Company snapshot
- 9.1.4. Operating business segments
- 9.1.5. Product portfolio
- 9.2. Axis Lighting
- 9.2.1. Company overview
- 9.2.2. Key Executives
- 9.2.3. Company snapshot
- 9.2.4. Operating business segments
- 9.2.5. Product portfolio
- 9.3. Cisco Systems, Inc.
- 9.3.1. Company overview
- 9.3.2. Key Executives
- 9.3.3. Company snapshot
- 9.3.4. Operating business segments
- 9.3.5. Product portfolio
- 9.3.6. Business performance
- 9.3.7. Key strategic moves and developments
- 9.4. H.E. Williams Inc.
- 9.4.1. Company overview
- 9.4.2. Key Executives
- 9.4.3. Company snapshot
- 9.4.4. Operating business segments
- 9.4.5. Product portfolio
- 9.5. Herbert Waldmann GmbH & Co. KG
- 9.5.1. Company overview
- 9.5.2. Key Executives
- 9.5.3. Company snapshot
- 9.5.4. Operating business segments
- 9.5.5. Product portfolio
- 9.5.6. Key strategic moves and developments
- 9.6. Hubbell.Inc
- 9.6.1. Company overview
- 9.6.2. Key Executives
- 9.6.3. Company snapshot
- 9.6.4. Operating business segments
- 9.6.5. Product portfolio
- 9.6.6. Business performance
- 9.6.7. Key strategic moves and developments
- 9.7. Molex LLC.
- 9.7.1. Company overview
- 9.7.2. Key Executives
- 9.7.3. Company snapshot
- 9.7.4. Operating business segments
- 9.7.5. Product portfolio
- 9.7.6. Key strategic moves and developments
- 9.8. Philips Lighting (Signify Holding)
- 9.8.1. Company overview
- 9.8.2. Key Executives
- 9.8.3. Company snapshot
- 9.8.4. Operating business segments
- 9.8.5. Product portfolio
- 9.8.6. Business performance
- 9.9. Ubiquiti Networks Inc.
- 9.9.1. Company overview
- 9.9.2. Key Executives
- 9.9.3. Company snapshot
- 9.9.4. Operating business segments
- 9.9.5. Product portfolio
- 9.9.6. Business performance
- 9.10. Wipro Lighting
- 9.10.1. Company overview
- 9.10.2. Key Executives
- 9.10.3. Company snapshot
- 9.10.4. Operating business segments
- 9.10.5. Product portfolio
- 9.10.6. Business performance
- 9.10.7. Key strategic moves and developments
LIST OF TABLES
- TABLE 01. GLOBAL POWER OVER ETHERNET (POE) LIGHTING MARKET, BY OFFERING, 2022-2032 ($MILLION)
- TABLE 02. POWER OVER ETHERNET (POE) LIGHTING MARKET FOR HARDWARE, BY REGION, 2022-2032 ($MILLION)
- TABLE 03. POWER OVER ETHERNET (POE) LIGHTING MARKET FOR SOFTWARE, BY REGION, 2022-2032 ($MILLION)
- TABLE 04. POWER OVER ETHERNET (POE) LIGHTING MARKET FOR SERVICES, BY REGION, 2022-2032 ($MILLION)
- TABLE 05. GLOBAL POWER OVER ETHERNET (POE) LIGHTING MARKET, BY WATTAGE, 2022-2032 ($MILLION)
- TABLE 06. POWER OVER ETHERNET (POE) LIGHTING MARKET FOR UPTO 25 WATT, BY REGION, 2022-2032 ($MILLION)
- TABLE 07. POWER OVER ETHERNET (POE) LIGHTING MARKET FOR ABOVE 25 WATT, BY REGION, 2022-2032 ($MILLION)
- TABLE 08. GLOBAL POWER OVER ETHERNET (POE) LIGHTING MARKET, BY APPLICATION, 2022-2032 ($MILLION)
- TABLE 09. POWER OVER ETHERNET (POE) LIGHTING MARKET FOR COMMERCIAL, BY REGION, 2022-2032 ($MILLION)
- TABLE 10. POWER OVER ETHERNET (POE) LIGHTING MARKET FOR RESIDENTIAL, BY REGION, 2022-2032 ($MILLION)
- TABLE 11. POWER OVER ETHERNET (POE) LIGHTING MARKET FOR INDUSTRIAL, BY REGION, 2022-2032 ($MILLION)
- TABLE 12. POWER OVER ETHERNET (POE) LIGHTING MARKET, BY REGION, 2022-2032 ($MILLION)
- TABLE 13. NORTH AMERICA POWER OVER ETHERNET (POE) LIGHTING MARKET, BY OFFERING, 2022-2032 ($MILLION)
- TABLE 14. NORTH AMERICA POWER OVER ETHERNET (POE) LIGHTING MARKET, BY WATTAGE, 2022-2032 ($MILLION)
- TABLE 15. NORTH AMERICA POWER OVER ETHERNET (POE) LIGHTING MARKET, BY APPLICATION, 2022-2032 ($MILLION)
- TABLE 16. NORTH AMERICA POWER OVER ETHERNET (POE) LIGHTING MARKET, BY COUNTRY, 2022-2032 ($MILLION)
- TABLE 17. U.S. POWER OVER ETHERNET (POE) LIGHTING MARKET, BY OFFERING, 2022-2032 ($MILLION)
- TABLE 18. U.S. POWER OVER ETHERNET (POE) LIGHTING MARKET, BY WATTAGE, 2022-2032 ($MILLION)
- TABLE 19. U.S. POWER OVER ETHERNET (POE) LIGHTING MARKET, BY APPLICATION, 2022-2032 ($MILLION)
- TABLE 20. CANADA POWER OVER ETHERNET (POE) LIGHTING MARKET, BY OFFERING, 2022-2032 ($MILLION)
- TABLE 21. CANADA POWER OVER ETHERNET (POE) LIGHTING MARKET, BY WATTAGE, 2022-2032 ($MILLION)
- TABLE 22. CANADA POWER OVER ETHERNET (POE) LIGHTING MARKET, BY APPLICATION, 2022-2032 ($MILLION)
- TABLE 23. MEXICO POWER OVER ETHERNET (POE) LIGHTING MARKET, BY OFFERING, 2022-2032 ($MILLION)
- TABLE 24. MEXICO POWER OVER ETHERNET (POE) LIGHTING MARKET, BY WATTAGE, 2022-2032 ($MILLION)
- TABLE 25. MEXICO POWER OVER ETHERNET (POE) LIGHTING MARKET, BY APPLICATION, 2022-2032 ($MILLION)
- TABLE 26. EUROPE POWER OVER ETHERNET (POE) LIGHTING MARKET, BY OFFERING, 2022-2032 ($MILLION)
- TABLE 27. EUROPE POWER OVER ETHERNET (POE) LIGHTING MARKET, BY WATTAGE, 2022-2032 ($MILLION)
- TABLE 28. EUROPE POWER OVER ETHERNET (POE) LIGHTING MARKET, BY APPLICATION, 2022-2032 ($MILLION)
- TABLE 29. EUROPE POWER OVER ETHERNET (POE) LIGHTING MARKET, BY COUNTRY, 2022-2032 ($MILLION)
- TABLE 30. UK POWER OVER ETHERNET (POE) LIGHTING MARKET, BY OFFERING, 2022-2032 ($MILLION)
- TABLE 31. UK POWER OVER ETHERNET (POE) LIGHTING MARKET, BY WATTAGE, 2022-2032 ($MILLION)
- TABLE 32. UK POWER OVER ETHERNET (POE) LIGHTING MARKET, BY APPLICATION, 2022-2032 ($MILLION)
- TABLE 33. GERMANY POWER OVER ETHERNET (POE) LIGHTING MARKET, BY OFFERING, 2022-2032 ($MILLION)
- TABLE 34. GERMANY POWER OVER ETHERNET (POE) LIGHTING MARKET, BY WATTAGE, 2022-2032 ($MILLION)
- TABLE 35. GERMANY POWER OVER ETHERNET (POE) LIGHTING MARKET, BY APPLICATION, 2022-2032 ($MILLION)
- TABLE 36. FRANCE POWER OVER ETHERNET (POE) LIGHTING MARKET, BY OFFERING, 2022-2032 ($MILLION)
- TABLE 37. FRANCE POWER OVER ETHERNET (POE) LIGHTING MARKET, BY WATTAGE, 2022-2032 ($MILLION)
- TABLE 38. FRANCE POWER OVER ETHERNET (POE) LIGHTING MARKET, BY APPLICATION, 2022-2032 ($MILLION)
- TABLE 39. REST OF EUROPE POWER OVER ETHERNET (POE) LIGHTING MARKET, BY OFFERING, 2022-2032 ($MILLION)
- TABLE 40. REST OF EUROPE POWER OVER ETHERNET (POE) LIGHTING MARKET, BY WATTAGE, 2022-2032 ($MILLION)
- TABLE 41. REST OF EUROPE POWER OVER ETHERNET (POE) LIGHTING MARKET, BY APPLICATION, 2022-2032 ($MILLION)
- TABLE 42. ASIA-PACIFIC POWER OVER ETHERNET (POE) LIGHTING MARKET, BY OFFERING, 2022-2032 ($MILLION)
- TABLE 43. ASIA-PACIFIC POWER OVER ETHERNET (POE) LIGHTING MARKET, BY WATTAGE, 2022-2032 ($MILLION)
- TABLE 44. ASIA-PACIFIC POWER OVER ETHERNET (POE) LIGHTING MARKET, BY APPLICATION, 2022-2032 ($MILLION)
- TABLE 45. ASIA-PACIFIC POWER OVER ETHERNET (POE) LIGHTING MARKET, BY COUNTRY, 2022-2032 ($MILLION)
- TABLE 46. CHINA POWER OVER ETHERNET (POE) LIGHTING MARKET, BY OFFERING, 2022-2032 ($MILLION)
- TABLE 47. CHINA POWER OVER ETHERNET (POE) LIGHTING MARKET, BY WATTAGE, 2022-2032 ($MILLION)
- TABLE 48. CHINA POWER OVER ETHERNET (POE) LIGHTING MARKET, BY APPLICATION, 2022-2032 ($MILLION)
- TABLE 49. JAPAN POWER OVER ETHERNET (POE) LIGHTING MARKET, BY OFFERING, 2022-2032 ($MILLION)
- TABLE 50. JAPAN POWER OVER ETHERNET (POE) LIGHTING MARKET, BY WATTAGE, 2022-2032 ($MILLION)
- TABLE 51. JAPAN POWER OVER ETHERNET (POE) LIGHTING MARKET, BY APPLICATION, 2022-2032 ($MILLION)
- TABLE 52. INDIA POWER OVER ETHERNET (POE) LIGHTING MARKET, BY OFFERING, 2022-2032 ($MILLION)
- TABLE 53. INDIA POWER OVER ETHERNET (POE) LIGHTING MARKET, BY WATTAGE, 2022-2032 ($MILLION)
- TABLE 54. INDIA POWER OVER ETHERNET (POE) LIGHTING MARKET, BY APPLICATION, 2022-2032 ($MILLION)
- TABLE 55. SOUTH KOREA POWER OVER ETHERNET (POE) LIGHTING MARKET, BY OFFERING, 2022-2032 ($MILLION)
- TABLE 56. SOUTH KOREA POWER OVER ETHERNET (POE) LIGHTING MARKET, BY WATTAGE, 2022-2032 ($MILLION)
- TABLE 57. SOUTH KOREA POWER OVER ETHERNET (POE) LIGHTING MARKET, BY APPLICATION, 2022-2032 ($MILLION)
- TABLE 58. REST OF ASIA-PACIFIC POWER OVER ETHERNET (POE) LIGHTING MARKET, BY OFFERING, 2022-2032 ($MILLION)
- TABLE 59. REST OF ASIA-PACIFIC POWER OVER ETHERNET (POE) LIGHTING MARKET, BY WATTAGE, 2022-2032 ($MILLION)
- TABLE 60. REST OF ASIA-PACIFIC POWER OVER ETHERNET (POE) LIGHTING MARKET, BY APPLICATION, 2022-2032 ($MILLION)
- TABLE 61. LAMEA POWER OVER ETHERNET (POE) LIGHTING MARKET, BY OFFERING, 2022-2032 ($MILLION)
- TABLE 62. LAMEA POWER OVER ETHERNET (POE) LIGHTING MARKET, BY WATTAGE, 2022-2032 ($MILLION)
- TABLE 63. LAMEA POWER OVER ETHERNET (POE) LIGHTING MARKET, BY APPLICATION, 2022-2032 ($MILLION)
- TABLE 64. LAMEA POWER OVER ETHERNET (POE) LIGHTING MARKET, BY COUNTRY, 2022-2032 ($MILLION)
- TABLE 65. LATIN AMERICA POWER OVER ETHERNET (POE) LIGHTING MARKET, BY OFFERING, 2022-2032 ($MILLION)
- TABLE 66. LATIN AMERICA POWER OVER ETHERNET (POE) LIGHTING MARKET, BY WATTAGE, 2022-2032 ($MILLION)
- TABLE 67. LATIN AMERICA POWER OVER ETHERNET (POE) LIGHTING MARKET, BY APPLICATION, 2022-2032 ($MILLION)
- TABLE 68. MIDDLE EAST POWER OVER ETHERNET (POE) LIGHTING MARKET, BY OFFERING, 2022-2032 ($MILLION)
- TABLE 69. MIDDLE EAST POWER OVER ETHERNET (POE) LIGHTING MARKET, BY WATTAGE, 2022-2032 ($MILLION)
- TABLE 70. MIDDLE EAST POWER OVER ETHERNET (POE) LIGHTING MARKET, BY APPLICATION, 2022-2032 ($MILLION)
- TABLE 71. AFRICA POWER OVER ETHERNET (POE) LIGHTING MARKET, BY OFFERING, 2022-2032 ($MILLION)
- TABLE 72. AFRICA POWER OVER ETHERNET (POE) LIGHTING MARKET, BY WATTAGE, 2022-2032 ($MILLION)
- TABLE 73. AFRICA POWER OVER ETHERNET (POE) LIGHTING MARKET, BY APPLICATION, 2022-2032 ($MILLION)
- TABLE 74. ALLNET GMBH: KEY EXECUTIVES
- TABLE 75. ALLNET GMBH: COMPANY SNAPSHOT
- TABLE 76. ALLNET GMBH: SERVICE SEGMENTS
- TABLE 77. ALLNET GMBH: PRODUCT PORTFOLIO
- TABLE 78. AXIS LIGHTING: KEY EXECUTIVES
- TABLE 79. AXIS LIGHTING: COMPANY SNAPSHOT
- TABLE 80. AXIS LIGHTING: PRODUCT SEGMENTS
- TABLE 81. AXIS LIGHTING: PRODUCT PORTFOLIO
- TABLE 82. CISCO SYSTEMS, INC.: KEY EXECUTIVES
- TABLE 83. CISCO SYSTEMS, INC.: COMPANY SNAPSHOT
- TABLE 84. CISCO SYSTEMS, INC.: SERVICE SEGMENTS
- TABLE 85. CISCO SYSTEMS, INC.: PRODUCT PORTFOLIO
- TABLE 86. CISCO SYSTEMS, INC.: KEY STRATERGIES
- TABLE 87. H.E. WILLIAMS INC.: KEY EXECUTIVES
- TABLE 88. H.E. WILLIAMS INC.: COMPANY SNAPSHOT
- TABLE 89. H.E. WILLIAMS INC.: PRODUCT SEGMENTS
- TABLE 90. H.E. WILLIAMS INC.: PRODUCT PORTFOLIO
- TABLE 91. HERBERT WALDMANN GMBH & CO. KG: KEY EXECUTIVES
- TABLE 92. HERBERT WALDMANN GMBH & CO. KG: COMPANY SNAPSHOT
- TABLE 93. HERBERT WALDMANN GMBH & CO. KG: PRODUCT SEGMENTS
- TABLE 94. HERBERT WALDMANN GMBH & CO. KG: PRODUCT PORTFOLIO
- TABLE 95. HERBERT WALDMANN GMBH & CO. KG: KEY STRATERGIES
- TABLE 96. HUBBELL.INC: KEY EXECUTIVES
- TABLE 97. HUBBELL.INC: COMPANY SNAPSHOT
- TABLE 98. HUBBELL.INC: PRODUCT SEGMENTS
- TABLE 99. HUBBELL.INC: PRODUCT PORTFOLIO
- TABLE 100. HUBBELL.INC: KEY STRATERGIES
- TABLE 101. MOLEX LLC.: KEY EXECUTIVES
- TABLE 102. MOLEX LLC.: COMPANY SNAPSHOT
- TABLE 103. MOLEX LLC.: SERVICE SEGMENTS
- TABLE 104. MOLEX LLC.: PRODUCT PORTFOLIO
- TABLE 105. MOLEX LLC.: KEY STRATERGIES
- TABLE 106. PHILIPS LIGHTING (SIGNIFY HOLDING): KEY EXECUTIVES
- TABLE 107. PHILIPS LIGHTING (SIGNIFY HOLDING): COMPANY SNAPSHOT
- TABLE 108. PHILIPS LIGHTING (SIGNIFY HOLDING): SERVICE SEGMENTS
- TABLE 109. PHILIPS LIGHTING (SIGNIFY HOLDING): PRODUCT PORTFOLIO
- TABLE 110. UBIQUITI NETWORKS INC.: KEY EXECUTIVES
- TABLE 111. UBIQUITI NETWORKS INC.: COMPANY SNAPSHOT
- TABLE 112. UBIQUITI NETWORKS INC.: SERVICE SEGMENTS
- TABLE 113. UBIQUITI NETWORKS INC.: PRODUCT PORTFOLIO
- TABLE 114. WIPRO LIGHTING: KEY EXECUTIVES
- TABLE 115. WIPRO LIGHTING: COMPANY SNAPSHOT
- TABLE 116. WIPRO LIGHTING: PRODUCT SEGMENTS
- TABLE 117. WIPRO LIGHTING: PRODUCT PORTFOLIO
- TABLE 118. WIPRO LIGHTING: KEY STRATERGIES
LIST OF FIGURES
- FIGURE 01. POWER OVER ETHERNET (POE) LIGHTING MARKET, 2022-2032
- FIGURE 02. SEGMENTATION OF POWER OVER ETHERNET (POE) LIGHTING MARKET, 2022-2032
- FIGURE 03. POWER OVER ETHERNET (POE) LIGHTING MARKET,2022-2032
- FIGURE 04. TOP INVESTMENT POCKETS IN POWER OVER ETHERNET (POE) LIGHTING MARKET (2023-2032)
- FIGURE 05. MODERATE TO HIGH BARGAINING POWER OF SUPPLIERS
- FIGURE 06. MODERATE TO HIGH THREAT OF NEW ENTRANTS
- FIGURE 07. MODERATE TO HIGH THREAT OF SUBSTITUTES
- FIGURE 08. LOW TO HIGH INTENSITY OF RIVALRY
- FIGURE 09. MODERATE TO HIGH BARGAINING POWER OF BUYERS
- FIGURE 10. GLOBAL POWER OVER ETHERNET (POE) LIGHTING MARKET:DRIVERS, RESTRAINTS AND OPPORTUNITIES
- FIGURE 11. POWER OVER ETHERNET (POE) LIGHTING MARKET, BY OFFERING, 2022(%)
- FIGURE 12. COMPARATIVE SHARE ANALYSIS OF POWER OVER ETHERNET (POE) LIGHTING MARKET FOR HARDWARE, BY COUNTRY 2022-2032(%)
- FIGURE 13. COMPARATIVE SHARE ANALYSIS OF POWER OVER ETHERNET (POE) LIGHTING MARKET FOR SOFTWARE, BY COUNTRY 2022-2032(%)
- FIGURE 14. COMPARATIVE SHARE ANALYSIS OF POWER OVER ETHERNET (POE) LIGHTING MARKET FOR SERVICES, BY COUNTRY 2022-2032(%)
- FIGURE 15. POWER OVER ETHERNET (POE) LIGHTING MARKET, BY WATTAGE, 2022(%)
- FIGURE 16. COMPARATIVE SHARE ANALYSIS OF POWER OVER ETHERNET (POE) LIGHTING MARKET FOR UPTO 25 WATT, BY COUNTRY 2022-2032(%)
- FIGURE 17. COMPARATIVE SHARE ANALYSIS OF POWER OVER ETHERNET (POE) LIGHTING MARKET FOR ABOVE 25 WATT, BY COUNTRY 2022-2032(%)
- FIGURE 18. POWER OVER ETHERNET (POE) LIGHTING MARKET, BY APPLICATION, 2022(%)
- FIGURE 19. COMPARATIVE SHARE ANALYSIS OF POWER OVER ETHERNET (POE) LIGHTING MARKET FOR COMMERCIAL, BY COUNTRY 2022-2032(%)
- FIGURE 20. COMPARATIVE SHARE ANALYSIS OF POWER OVER ETHERNET (POE) LIGHTING MARKET FOR RESIDENTIAL, BY COUNTRY 2022-2032(%)
- FIGURE 21. COMPARATIVE SHARE ANALYSIS OF POWER OVER ETHERNET (POE) LIGHTING MARKET FOR INDUSTRIAL, BY COUNTRY 2022-2032(%)
- FIGURE 22. POWER OVER ETHERNET (POE) LIGHTING MARKET BY REGION, 2022
- FIGURE 23. U.S. POWER OVER ETHERNET (POE) LIGHTING MARKET, 2022-2032 ($MILLION)
- FIGURE 24. CANADA POWER OVER ETHERNET (POE) LIGHTING MARKET, 2022-2032 ($MILLION)
- FIGURE 25. MEXICO POWER OVER ETHERNET (POE) LIGHTING MARKET, 2022-2032 ($MILLION)
- FIGURE 26. UK POWER OVER ETHERNET (POE) LIGHTING MARKET, 2022-2032 ($MILLION)
- FIGURE 27. GERMANY POWER OVER ETHERNET (POE) LIGHTING MARKET, 2022-2032 ($MILLION)
- FIGURE 28. FRANCE POWER OVER ETHERNET (POE) LIGHTING MARKET, 2022-2032 ($MILLION)
- FIGURE 29. REST OF EUROPE POWER OVER ETHERNET (POE) LIGHTING MARKET, 2022-2032 ($MILLION)
- FIGURE 30. CHINA POWER OVER ETHERNET (POE) LIGHTING MARKET, 2022-2032 ($MILLION)
- FIGURE 31. JAPAN POWER OVER ETHERNET (POE) LIGHTING MARKET, 2022-2032 ($MILLION)
- FIGURE 32. INDIA POWER OVER ETHERNET (POE) LIGHTING MARKET, 2022-2032 ($MILLION)
- FIGURE 33. SOUTH KOREA POWER OVER ETHERNET (POE) LIGHTING MARKET, 2022-2032 ($MILLION)
- FIGURE 34. REST OF ASIA-PACIFIC POWER OVER ETHERNET (POE) LIGHTING MARKET, 2022-2032 ($MILLION)
- FIGURE 35. LATIN AMERICA POWER OVER ETHERNET (POE) LIGHTING MARKET, 2022-2032 ($MILLION)
- FIGURE 36. MIDDLE EAST POWER OVER ETHERNET (POE) LIGHTING MARKET, 2022-2032 ($MILLION)
- FIGURE 37. AFRICA POWER OVER ETHERNET (POE) LIGHTING MARKET, 2022-2032 ($MILLION)
- FIGURE 38. TOP WINNING STRATEGIES, BY YEAR
- FIGURE 39. TOP WINNING STRATEGIES, BY DEVELOPMENT
- FIGURE 40. TOP WINNING STRATEGIES, BY COMPANY
- FIGURE 41. PRODUCT MAPPING OF TOP 10 PLAYERS
- FIGURE 42. COMPETITIVE DASHBOARD
- FIGURE 43. COMPETITIVE HEATMAP: POWER OVER ETHERNET (POE) LIGHTING MARKET
- FIGURE 44. TOP PLAYER POSITIONING, 2022
- FIGURE 45. CISCO SYSTEMS, INC.: NET REVENUE, 2020-2022 ($MILLION)
- FIGURE 46. CISCO SYSTEMS, INC.: RESEARCH & DEVELOPMENT EXPENDITURE, 2020-2022 ($MILLION)
- FIGURE 47. CISCO SYSTEMS, INC.: REVENUE SHARE BY SEGMENT, 2022 (%)
- FIGURE 48. HUBBELL.INC: NET SALES, 2020-2022 ($MILLION)
- FIGURE 49. HUBBELL.INC: RESEARCH & DEVELOPMENT EXPENDITURE, 2020-2022 ($MILLION)
- FIGURE 50. HUBBELL.INC: REVENUE SHARE BY SEGMENT, 2021 (%)
- FIGURE 51. HUBBELL.INC: REVENUE SHARE BY REGION, 2021 (%)
- FIGURE 52. PHILIPS LIGHTING (SIGNIFY HOLDING): NET REVENUE, 2020-2022 ($MILLION)
- FIGURE 53. PHILIPS LIGHTING (SIGNIFY HOLDING): RESEARCH & DEVELOPMENT EXPENDITURE, 2020-2022 ($MILLION)
- FIGURE 54. PHILIPS LIGHTING (SIGNIFY HOLDING): REVENUE SHARE BY SEGMENT, 2022 (%)
- FIGURE 55. PHILIPS LIGHTING (SIGNIFY HOLDING): REVENUE SHARE BY REGION, 2022 (%)
- FIGURE 56. UBIQUITI NETWORKS INC.: NET REVENUE, 2020-2022 ($MILLION)
- FIGURE 57. UBIQUITI NETWORKS INC.: RESEARCH & DEVELOPMENT EXPENDITURE, 2020-2022 ($MILLION)
- FIGURE 58. UBIQUITI NETWORKS INC.: REVENUE SHARE BY REGION, 2022 (%)
- FIGURE 59. WIPRO LIGHTING: NET REVENUE, 2020-2022 ($MILLION)
 乙太網路供電照明市場 - 全球產業規模、佔有率、趨勢、機會和預測,按產品(硬體、軟體和服務)、按應用(商業、工業、住宅)、地區、競爭進行細分,2018-2028 年。
 乙太網路供電 (PoE) 晶片組市場:2023-2028 年全球產業趨勢、佔有率、規模、成長、機會與預測
 乙太網路供電照明全球市場規模、佔有率、產業趨勢分析報告:2023-2030 年按按產品供應、功率、用途、地區分類的展望與預測
 乙太網路供電照明市場:按產品(硬體、軟體和服務)、按瓦數(25 瓦以上、25 瓦以下)、用途分類 - 2023-2030 年全球預測
 以太網供電(PoE)芯片組市場規模,份額和趨勢分析報告:按類型(PoE供電設備(PSE)芯片組),標準,最終用途,設備,地區,細分市場2023-2030預測
 PoE (Power Over Ethernet) 照明的全球市場:各提供區分、瓦特數、用途的規模、各地區的展望、競爭策略、各種區分的預測 (~2032年)
 PoE(Power-Over-Ethernet)晶片組的全球市場
 產業用使用乙太網路供電的全球市場
 乙太網路供電解決方案市場:趨勢,機會,競爭分析