


 |
市場調查報告書
商品編碼
1344530
工作燈市場:按類型、照明技術、電源、最終用途分類:2023-2032 年全球機會分析與產業預測Work Lights Market By Type, By Light Technology, By Power Source, By End-Use : Global Opportunity Analysis and Industry Forecast, 2023-2032 |
||||||
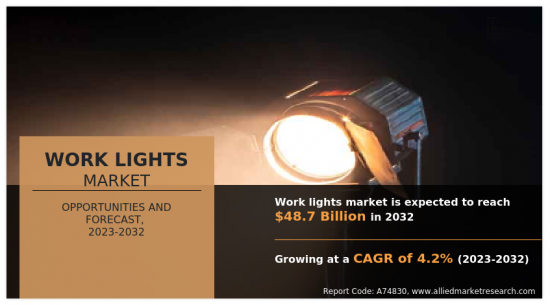
2022 年工作照明市場價值為 324 億美元,預計 2023 年至 2032 年複合年增長率為 4.2%,到 2032 年達到 487 億美元。
工作照明市場是指生產和供應專為工作環境設計的照明解決方案的產業。 工作燈是各種行業和環境中使用的必備工具,包括建築、製造、汽車維修、維護、緊急應變和戶外活動。 工作燈在自然光或環境光不足或不可用的區域提供照明,使工人能夠安全且有效率地工作。
工作照明市場擁有廣泛的照明產品和解決方案,以滿足不同工作環境的需求。 這包括手持燈、泛光燈、工作燈、聚光燈、頭燈、工作區照明系統等。 工作燈的尺寸、亮度、電源、耐用性和功能各不相同,具體取決於其用途。
推動工作照明市場的主要因素包括提高工作環境可見性和安全性的需求、對能源效率和永續性的日益重視、照明技術的進步以及不斷發展的工作場所法規和標準。例如, 工作燈旨在提供明亮、集中的照明,通常包括可調節角度、多種照明模式以及能夠承受惡劣條件的耐用性等功能。 工作照明市場受到建築、製造、汽車、石油和天然氣、公用事業、緊急服務和娛樂等各行業的影響。 對工作燈的需求是由正在進行的基礎設施開發項目、工業活動、維護和維修操作以及緊急和災難響應情況下對有效照明解決方案的需求所推動的。
工作燈可由多種能源供電,包括電網電力、電池和可充電電源。 最近,將太陽能技術整合到工作燈中以提供可持續且環保的照明選擇的趨勢日益明顯。 太陽能工作燈利用光伏電池將陽光轉化為電能,具有再生能源、節省成本和減少環境影響的優點。
工作照明市場的特點是擁有眾多在本地、區域和國際層面運營的製造商、供應商和分銷商。 市場主要參與者專注於開拓創新照明解決方案、提高能源效率、提高耐用性和便攜性,並融入無線連接和智慧控制等先進功能。
然而,替代品的存在限制了工作燈市場的發展。 與白熾燈和螢光燈等傳統照明解決方案相比,工作燈具有多種優勢。 這些替代品可能比工作燈節能、耐用且便宜。 在某些情況下,客戶可能會因為熟悉、較低的初始成本或更容易取得而選擇這些替代方案。 此外,市場上存在的假冒偽劣工作燈也可能充當替代品,損害原始製造商的聲譽。
目錄
第一章簡介
第 2 章執行摘要
第三章市場概述
- 市場定義和範圍
- 主要發現
- 影響因素
- 主要投資機會
- 波特五力分析
- 供應商的議價能力
- 買方的議價能力
- 替代品的威脅
- 新進入者的威脅
- 競爭強度
- 市場動態
- 促進因素
- 工業快速成長
- 增加戶外活動和活動
- 汽車工業的成長
- 抑制因素
- 競爭激烈
- 存在替代產品
- 機會
- 能源效率與永續發展
- 新興市場的發展
- 促進因素
- 新冠肺炎 (COVID-19) 市場影響分析
- 主要監理分析
- 價值鏈分析
第 4 章工作燈市場:按類型
- 摘要
- 便攜式
- 三腳架類型
- 手持式和伸縮式
第 5 章工作燈市場:照明技術
- 摘要
- 整合 LED
- 鹵素
- 螢光燈
第 6 章工作燈市場:依電源劃分
- 摘要
- 插件
- 電池
第 7 章工作燈市場:按應用
- 摘要
- 建築
- 倉庫
- 製造業
- 採礦
- 其他
第 8 章工作燈市場:按地區
- 摘要
- 北美
- 美國
- 加拿大
- 墨西哥
- 歐洲
- 德國
- 法國
- 英國
- 義大利
- 西班牙
- 歐洲其他地區
- 亞太地區
- 中國
- 日本
- 印度
- 韓國
- 澳大利亞
- 其他亞太地區
- 拉丁美洲/中東/非洲
- 巴西
- 沙烏地阿拉伯
- 南非
- 阿聯酋
- 阿根廷
- 其他領域
第九章競爭態勢
- 簡介
- 關鍵成功策略
- 10家主要公司的產品圖譜
- 競爭對手儀表板
- 競爭熱圖
- 2022 年主要公司的定位
第十章公司簡介
- Horpol J.I.A.T. Horeczy SP. K.
- STE
- Peterson Manufacturing
- AIS LED
- Scangrip North America Inc.
- KIRA Leuchten GmbH
- Hugo Brennenstuhl GmbH & Co Kommanditgesellschaft
- LEDLENSER
- Gentos Co., Ltd.
- Luxgend Electronics Co., Ltd.
According to a new report published by Allied Market Research, titled, "Work Lights Market," The work lights market was valued at $32.4 billion in 2022, and is estimated to reach $48.7 billion by 2032, growing at a CAGR of 4.2% from 2023 to 2032.
The work lights market refers to the industry that produces and supplies lighting solutions specifically designed for work environments. Work lights are essential tools used in a variety of industries and settings, including construction, manufacturing, automotive repair, maintenance, emergency response, and outdoor events. They provide illumination in areas where natural or ambient lighting is insufficient or unavailable, enabling workers to perform their tasks safely and efficiently.
The work lights market encompasses a wide range of lighting products and solutions tailored to meet the specific needs of different work environments. These include portable handheld lights, floodlights, task lights, spotlights, headlamps, and work area lighting systems. Work lights can vary in size, brightness, power source, durability, and features, depending on the intended application.
Key factors driving the work lights market include the need for improved visibility and safety in work environments, increasing emphasis on energy efficiency and sustainability, advancements in lighting technology, and evolving workplace regulations and standards. Work lights are designed to provide bright and focused illumination, often with features like adjustable angles, multiple lighting modes, and durability to withstand harsh conditions. The market for work lights is influenced by various industry sectors, including construction, manufacturing, automotive, oil and gas, utilities, emergency services, and entertainment. The demand for work lights is driven by ongoing infrastructure development projects, industrial activities, maintenance and repair operations, and the need for effective lighting solutions in emergency and disaster response situations.
Work lights can be powered by different energy sources, including electricity from the grid, batteries, or rechargeable power sources. More recently, there has been a growing trend toward integrating solar technology into work lights, providing sustainable and environmentally friendly lighting options. Solar-powered work lights utilize photovoltaic cells to convert sunlight into electrical energy, offering the advantages of renewable energy, cost savings, and reduced environmental impact.
The work lights market is characterized by a diverse range of manufacturers, suppliers, and distributors operating at local, regional, and international levels. Key players in the market often focus on developing innovative lighting solutions, improving energy efficiency, enhancing durability and portability, and incorporating advanced features like wireless connectivity and smart controls.
However, the availability of substitutes is restricting the development of the work lights market. Work lights offer several advantages compared to traditional lighting solutions such as incandescent bulbs and fluorescent lights which are still available and widely used in certain applications. These substitutes may be cheaper, although less energy-efficient and durable compared to work lights. In some cases, customers may opt for these alternatives due to familiarity, lower upfront costs, or ease of availability. Moreover, the presence of counterfeit or low-quality work lights in the market can also act as substitutes that undermine the reputation of genuine manufacturers.
For the purpose of analysis, the work lights market scope covers segmentation based on type, light technology, power source, end-use, and region. The report provides information on various types including portable, tripod, and handheld and retractable. Furthermore, the light technologies covered in the study include integrated LED, halogen, and fluorescent. In addition, it outlines the details of the power sources such as plug-in and battery. Moreover, it analyzes the current market trends across different end-uses such as construction, warehouses, manufacturing, mining, and others. In addition, it analyzes the current market trends across different regions such as North America, Europe, Asia-Pacific, and LAMEA and suggests future growth opportunities.
Impact of Russia-Ukraine War on Global Work Lights Market
The ongoing Russia-Ukraine war has had a significant impact on the global work lights market. As Ukraine is a major manufacturer and exporter of work lights, the conflict has disrupted production and supply chains, leading to a scarcity of these products in the global market. The war has resulted in infrastructure damage, power outages, and logistical challenges, further hampering manufacturing and distribution processes.
With Ukraine being a key player in the work lights industry, the decrease in its production capacity has created a supply-demand gap, driving up prices and causing delays in fulfilling orders worldwide. As a result, businesses and industries relying on work lights for construction, maintenance, and other operations have faced difficulties in acquiring the necessary equipment, leading to project delays and cost escalations.
In response to the uncertain situation, buyers have sought alternative suppliers, but the transition has not been seamless, as finding manufacturers with similar production capabilities and quality standards has proven challenging. This disruption in the global work lights market highlights the vulnerability of industries dependent on geopolitical stability and underscores the need for diversification of supply chains to mitigate such risks in the future.
Competitive Landscape
Steisone (STE), AIS LED, Scangrip North America Inc., KIRA Leuchten GmbH, Hugo Brennenstuhl GmbH & Co Kommanditgesellschaft, LEDlenser, Gentos Co., Ltd., Horpol J.I.A.T. Horeczy SP. K., Peterson Manufacturing, and Luxgend Electronics Co., Ltd. are some of the major players discussed in the report. Furthermore, the key strategies adopted by potential market leaders to facilitate effective planning have been discussed under the scope of the report.
Key Benefits For Stakeholders
- This report provides a quantitative analysis of the market segments, current trends, estimations, and dynamics of the work lights market analysis from 2022 to 2032 to identify the prevailing work lights market opportunities.
- The market research is offered along with information related to key drivers, restraints, and opportunities.
- Porter's five forces analysis highlights the potency of buyers and suppliers to enable stakeholders make profit-oriented business decisions and strengthen their supplier-buyer network.
- In-depth analysis of the work lights market segmentation assists to determine the prevailing market opportunities.
- Major countries in each region are mapped according to their revenue contribution to the global market.
- Market player positioning facilitates benchmarking and provides a clear understanding of the present position of the market players.
- The report includes the analysis of the regional as well as global work lights market trends, key players, market segments, application areas, and market growth strategies.
Key Market Segments
By Type
- Portable
- Tripod
- Handheld and Retractable
By Light Technology
- Integrated LED
- Halogen
- Fluorescent
By Power Source
- Plug-In
- Battery
By End-Use
- Construction
- Warehouses
- Manufacturing
- Mining
- Others
By Region
- North America
- U.S.
- Canada
- Mexico
- Europe
- Germany
- France
- UK
- Italy
- Spain
- Rest of Europe
- Asia-Pacific
- China
- Japan
- India
- South Korea
- Australia
- Rest of Asia-Pacific
- LAMEA
- Brazil
- Saudi Arabia
- South Africa
- UAE
- Argentina
- Rest of LAMEA
Key Market Players:
- Luxgend Electronics Co., Ltd.
- Horpol J.I.A.T. Horeczy SP. K.
- Peterson Manufacturing
- LEDLENSER
- STE
- Scangrip North America Inc.
- Gentos Co., Ltd.
- KIRA Leuchten GmbH
- AIS LED
- Hugo Brennenstuhl GmbH & Co Kommanditgesellschaft
TABLE OF CONTENTS
CHAPTER 1: INTRODUCTION
- 1.1. Report description
- 1.2. Key market segments
- 1.3. Key benefits to the stakeholders
- 1.4. Research Methodology
- 1.4.1. Primary research
- 1.4.2. Secondary research
- 1.4.3. Analyst tools and models
CHAPTER 2: EXECUTIVE SUMMARY
- 2.1. CXO Perspective
CHAPTER 3: MARKET OVERVIEW
- 3.1. Market definition and scope
- 3.2. Key findings
- 3.2.1. Top impacting factors
- 3.2.2. Top investment pockets
- 3.3. Porter's five forces analysis
- 3.3.1. Bargaining power of suppliers
- 3.3.2. Bargaining power of buyers
- 3.3.3. Threat of substitutes
- 3.3.4. Threat of new entrants
- 3.3.5. Intensity of rivalry
- 3.4. Market dynamics
- 3.4.1. Drivers
- 3.4.1.1. The surge in industrial growth
- 3.4.1.2. Increase in outdoor activities and events
- 3.4.1.3. Growing automotive industry
- 3.4.1. Drivers
- 3.4.2. Restraints
- 3.4.2.1. High competition
- 3.4.2.2. Availability of substitutes
- 3.4.3. Opportunities
- 3.4.3.1. Energy efficiency and sustainability
- 3.4.3.2. Development in emerging markets
- 3.5. COVID-19 Impact Analysis on the market
- 3.6. Key Regulation Analysis
- 3.7. Value Chain Analysis
CHAPTER 4: WORK LIGHTS MARKET, BY TYPE
- 4.1. Overview
- 4.1.1. Market size and forecast
- 4.2. Portable
- 4.2.1. Key market trends, growth factors and opportunities
- 4.2.2. Market size and forecast, by region
- 4.2.3. Market share analysis by country
- 4.3. Tripod
- 4.3.1. Key market trends, growth factors and opportunities
- 4.3.2. Market size and forecast, by region
- 4.3.3. Market share analysis by country
- 4.4. Handheld and Retractable
- 4.4.1. Key market trends, growth factors and opportunities
- 4.4.2. Market size and forecast, by region
- 4.4.3. Market share analysis by country
CHAPTER 5: WORK LIGHTS MARKET, BY LIGHT TECHNOLOGY
- 5.1. Overview
- 5.1.1. Market size and forecast
- 5.2. Integrated LED
- 5.2.1. Key market trends, growth factors and opportunities
- 5.2.2. Market size and forecast, by region
- 5.2.3. Market share analysis by country
- 5.3. Halogen
- 5.3.1. Key market trends, growth factors and opportunities
- 5.3.2. Market size and forecast, by region
- 5.3.3. Market share analysis by country
- 5.4. Fluorescent
- 5.4.1. Key market trends, growth factors and opportunities
- 5.4.2. Market size and forecast, by region
- 5.4.3. Market share analysis by country
CHAPTER 6: WORK LIGHTS MARKET, BY POWER SOURCE
- 6.1. Overview
- 6.1.1. Market size and forecast
- 6.2. Plug-In
- 6.2.1. Key market trends, growth factors and opportunities
- 6.2.2. Market size and forecast, by region
- 6.2.3. Market share analysis by country
- 6.3. Battery
- 6.3.1. Key market trends, growth factors and opportunities
- 6.3.2. Market size and forecast, by region
- 6.3.3. Market share analysis by country
CHAPTER 7: WORK LIGHTS MARKET, BY END-USE
- 7.1. Overview
- 7.1.1. Market size and forecast
- 7.2. Construction
- 7.2.1. Key market trends, growth factors and opportunities
- 7.2.2. Market size and forecast, by region
- 7.2.3. Market share analysis by country
- 7.3. Warehouses
- 7.3.1. Key market trends, growth factors and opportunities
- 7.3.2. Market size and forecast, by region
- 7.3.3. Market share analysis by country
- 7.4. Manufacturing
- 7.4.1. Key market trends, growth factors and opportunities
- 7.4.2. Market size and forecast, by region
- 7.4.3. Market share analysis by country
- 7.5. Mining
- 7.5.1. Key market trends, growth factors and opportunities
- 7.5.2. Market size and forecast, by region
- 7.5.3. Market share analysis by country
- 7.6. Others
- 7.6.1. Key market trends, growth factors and opportunities
- 7.6.2. Market size and forecast, by region
- 7.6.3. Market share analysis by country
CHAPTER 8: WORK LIGHTS MARKET, BY REGION
- 8.1. Overview
- 8.1.1. Market size and forecast By Region
- 8.2. North America
- 8.2.1. Key trends and opportunities
- 8.2.2. Market size and forecast, by Type
- 8.2.3. Market size and forecast, by Light Technology
- 8.2.4. Market size and forecast, by Power Source
- 8.2.5. Market size and forecast, by End-Use
- 8.2.6. Market size and forecast, by country
- 8.2.6.1. U.S.
- 8.2.6.1.1. Key market trends, growth factors and opportunities
- 8.2.6.1.2. Market size and forecast, by Type
- 8.2.6.1.3. Market size and forecast, by Light Technology
- 8.2.6.1.4. Market size and forecast, by Power Source
- 8.2.6.1.5. Market size and forecast, by End-Use
- 8.2.6.2. Canada
- 8.2.6.2.1. Key market trends, growth factors and opportunities
- 8.2.6.2.2. Market size and forecast, by Type
- 8.2.6.2.3. Market size and forecast, by Light Technology
- 8.2.6.2.4. Market size and forecast, by Power Source
- 8.2.6.2.5. Market size and forecast, by End-Use
- 8.2.6.3. Mexico
- 8.2.6.3.1. Key market trends, growth factors and opportunities
- 8.2.6.3.2. Market size and forecast, by Type
- 8.2.6.3.3. Market size and forecast, by Light Technology
- 8.2.6.3.4. Market size and forecast, by Power Source
- 8.2.6.3.5. Market size and forecast, by End-Use
- 8.3. Europe
- 8.3.1. Key trends and opportunities
- 8.3.2. Market size and forecast, by Type
- 8.3.3. Market size and forecast, by Light Technology
- 8.3.4. Market size and forecast, by Power Source
- 8.3.5. Market size and forecast, by End-Use
- 8.3.6. Market size and forecast, by country
- 8.3.6.1. Germany
- 8.3.6.1.1. Key market trends, growth factors and opportunities
- 8.3.6.1.2. Market size and forecast, by Type
- 8.3.6.1.3. Market size and forecast, by Light Technology
- 8.3.6.1.4. Market size and forecast, by Power Source
- 8.3.6.1.5. Market size and forecast, by End-Use
- 8.3.6.2. France
- 8.3.6.2.1. Key market trends, growth factors and opportunities
- 8.3.6.2.2. Market size and forecast, by Type
- 8.3.6.2.3. Market size and forecast, by Light Technology
- 8.3.6.2.4. Market size and forecast, by Power Source
- 8.3.6.2.5. Market size and forecast, by End-Use
- 8.3.6.3. UK
- 8.3.6.3.1. Key market trends, growth factors and opportunities
- 8.3.6.3.2. Market size and forecast, by Type
- 8.3.6.3.3. Market size and forecast, by Light Technology
- 8.3.6.3.4. Market size and forecast, by Power Source
- 8.3.6.3.5. Market size and forecast, by End-Use
- 8.3.6.4. Italy
- 8.3.6.4.1. Key market trends, growth factors and opportunities
- 8.3.6.4.2. Market size and forecast, by Type
- 8.3.6.4.3. Market size and forecast, by Light Technology
- 8.3.6.4.4. Market size and forecast, by Power Source
- 8.3.6.4.5. Market size and forecast, by End-Use
- 8.3.6.5. Spain
- 8.3.6.5.1. Key market trends, growth factors and opportunities
- 8.3.6.5.2. Market size and forecast, by Type
- 8.3.6.5.3. Market size and forecast, by Light Technology
- 8.3.6.5.4. Market size and forecast, by Power Source
- 8.3.6.5.5. Market size and forecast, by End-Use
- 8.3.6.6. Rest of Europe
- 8.3.6.6.1. Key market trends, growth factors and opportunities
- 8.3.6.6.2. Market size and forecast, by Type
- 8.3.6.6.3. Market size and forecast, by Light Technology
- 8.3.6.6.4. Market size and forecast, by Power Source
- 8.3.6.6.5. Market size and forecast, by End-Use
- 8.4. Asia-Pacific
- 8.4.1. Key trends and opportunities
- 8.4.2. Market size and forecast, by Type
- 8.4.3. Market size and forecast, by Light Technology
- 8.4.4. Market size and forecast, by Power Source
- 8.4.5. Market size and forecast, by End-Use
- 8.4.6. Market size and forecast, by country
- 8.4.6.1. China
- 8.4.6.1.1. Key market trends, growth factors and opportunities
- 8.4.6.1.2. Market size and forecast, by Type
- 8.4.6.1.3. Market size and forecast, by Light Technology
- 8.4.6.1.4. Market size and forecast, by Power Source
- 8.4.6.1.5. Market size and forecast, by End-Use
- 8.4.6.2. Japan
- 8.4.6.2.1. Key market trends, growth factors and opportunities
- 8.4.6.2.2. Market size and forecast, by Type
- 8.4.6.2.3. Market size and forecast, by Light Technology
- 8.4.6.2.4. Market size and forecast, by Power Source
- 8.4.6.2.5. Market size and forecast, by End-Use
- 8.4.6.3. India
- 8.4.6.3.1. Key market trends, growth factors and opportunities
- 8.4.6.3.2. Market size and forecast, by Type
- 8.4.6.3.3. Market size and forecast, by Light Technology
- 8.4.6.3.4. Market size and forecast, by Power Source
- 8.4.6.3.5. Market size and forecast, by End-Use
- 8.4.6.4. South Korea
- 8.4.6.4.1. Key market trends, growth factors and opportunities
- 8.4.6.4.2. Market size and forecast, by Type
- 8.4.6.4.3. Market size and forecast, by Light Technology
- 8.4.6.4.4. Market size and forecast, by Power Source
- 8.4.6.4.5. Market size and forecast, by End-Use
- 8.4.6.5. Australia
- 8.4.6.5.1. Key market trends, growth factors and opportunities
- 8.4.6.5.2. Market size and forecast, by Type
- 8.4.6.5.3. Market size and forecast, by Light Technology
- 8.4.6.5.4. Market size and forecast, by Power Source
- 8.4.6.5.5. Market size and forecast, by End-Use
- 8.4.6.6. Rest of Asia-Pacific
- 8.4.6.6.1. Key market trends, growth factors and opportunities
- 8.4.6.6.2. Market size and forecast, by Type
- 8.4.6.6.3. Market size and forecast, by Light Technology
- 8.4.6.6.4. Market size and forecast, by Power Source
- 8.4.6.6.5. Market size and forecast, by End-Use
- 8.5. LAMEA
- 8.5.1. Key trends and opportunities
- 8.5.2. Market size and forecast, by Type
- 8.5.3. Market size and forecast, by Light Technology
- 8.5.4. Market size and forecast, by Power Source
- 8.5.5. Market size and forecast, by End-Use
- 8.5.6. Market size and forecast, by country
- 8.5.6.1. Brazil
- 8.5.6.1.1. Key market trends, growth factors and opportunities
- 8.5.6.1.2. Market size and forecast, by Type
- 8.5.6.1.3. Market size and forecast, by Light Technology
- 8.5.6.1.4. Market size and forecast, by Power Source
- 8.5.6.1.5. Market size and forecast, by End-Use
- 8.5.6.2. Saudi Arabia
- 8.5.6.2.1. Key market trends, growth factors and opportunities
- 8.5.6.2.2. Market size and forecast, by Type
- 8.5.6.2.3. Market size and forecast, by Light Technology
- 8.5.6.2.4. Market size and forecast, by Power Source
- 8.5.6.2.5. Market size and forecast, by End-Use
- 8.5.6.3. South Africa
- 8.5.6.3.1. Key market trends, growth factors and opportunities
- 8.5.6.3.2. Market size and forecast, by Type
- 8.5.6.3.3. Market size and forecast, by Light Technology
- 8.5.6.3.4. Market size and forecast, by Power Source
- 8.5.6.3.5. Market size and forecast, by End-Use
- 8.5.6.4. UAE
- 8.5.6.4.1. Key market trends, growth factors and opportunities
- 8.5.6.4.2. Market size and forecast, by Type
- 8.5.6.4.3. Market size and forecast, by Light Technology
- 8.5.6.4.4. Market size and forecast, by Power Source
- 8.5.6.4.5. Market size and forecast, by End-Use
- 8.5.6.5. Argentina
- 8.5.6.5.1. Key market trends, growth factors and opportunities
- 8.5.6.5.2. Market size and forecast, by Type
- 8.5.6.5.3. Market size and forecast, by Light Technology
- 8.5.6.5.4. Market size and forecast, by Power Source
- 8.5.6.5.5. Market size and forecast, by End-Use
- 8.5.6.6. Rest of LAMEA
- 8.5.6.6.1. Key market trends, growth factors and opportunities
- 8.5.6.6.2. Market size and forecast, by Type
- 8.5.6.6.3. Market size and forecast, by Light Technology
- 8.5.6.6.4. Market size and forecast, by Power Source
- 8.5.6.6.5. Market size and forecast, by End-Use
CHAPTER 9: COMPETITIVE LANDSCAPE
- 9.1. Introduction
- 9.2. Top winning strategies
- 9.3. Product Mapping of Top 10 Player
- 9.4. Competitive Dashboard
- 9.5. Competitive Heatmap
- 9.6. Top player positioning, 2022
CHAPTER 10: COMPANY PROFILES
- 10.1. Horpol J.I.A.T. Horeczy SP. K.
- 10.1.1. Company overview
- 10.1.2. Key Executives
- 10.1.3. Company snapshot
- 10.1.4. Operating business segments
- 10.1.5. Product portfolio
- 10.2. STE
- 10.2.1. Company overview
- 10.2.2. Key Executives
- 10.2.3. Company snapshot
- 10.2.4. Operating business segments
- 10.2.5. Product portfolio
- 10.3. Peterson Manufacturing
- 10.3.1. Company overview
- 10.3.2. Key Executives
- 10.3.3. Company snapshot
- 10.3.4. Operating business segments
- 10.3.5. Product portfolio
- 10.4. AIS LED
- 10.4.1. Company overview
- 10.4.2. Key Executives
- 10.4.3. Company snapshot
- 10.4.4. Operating business segments
- 10.4.5. Product portfolio
- 10.5. Scangrip North America Inc.
- 10.5.1. Company overview
- 10.5.2. Key Executives
- 10.5.3. Company snapshot
- 10.5.4. Operating business segments
- 10.5.5. Product portfolio
- 10.5.6. Key strategic moves and developments
- 10.6. KIRA Leuchten GmbH
- 10.6.1. Company overview
- 10.6.2. Key Executives
- 10.6.3. Company snapshot
- 10.6.4. Operating business segments
- 10.6.5. Product portfolio
- 10.6.6. Key strategic moves and developments
- 10.7. Hugo Brennenstuhl GmbH & Co Kommanditgesellschaft
- 10.7.1. Company overview
- 10.7.2. Key Executives
- 10.7.3. Company snapshot
- 10.7.4. Operating business segments
- 10.7.5. Product portfolio
- 10.8. LEDLENSER
- 10.8.1. Company overview
- 10.8.2. Key Executives
- 10.8.3. Company snapshot
- 10.8.4. Operating business segments
- 10.8.5. Product portfolio
- 10.9. Gentos Co., Ltd.
- 10.9.1. Company overview
- 10.9.2. Key Executives
- 10.9.3. Company snapshot
- 10.9.4. Operating business segments
- 10.9.5. Product portfolio
- 10.9.6. Key strategic moves and developments
- 10.10. Luxgend Electronics Co., Ltd.
- 10.10.1. Company overview
- 10.10.2. Key Executives
- 10.10.3. Company snapshot
- 10.10.4. Operating business segments
- 10.10.5. Product portfolio
LIST OF TABLES
- TABLE 01. GLOBAL WORK LIGHTS MARKET, BY TYPE, 2022-2032 ($MILLION)
- TABLE 02. WORK LIGHTS MARKET FOR PORTABLE, BY REGION, 2022-2032 ($MILLION)
- TABLE 03. WORK LIGHTS MARKET FOR TRIPOD, BY REGION, 2022-2032 ($MILLION)
- TABLE 04. WORK LIGHTS MARKET FOR HANDHELD AND RETRACTABLE, BY REGION, 2022-2032 ($MILLION)
- TABLE 05. GLOBAL WORK LIGHTS MARKET, BY LIGHT TECHNOLOGY, 2022-2032 ($MILLION)
- TABLE 06. WORK LIGHTS MARKET FOR INTEGRATED LED, BY REGION, 2022-2032 ($MILLION)
- TABLE 07. WORK LIGHTS MARKET FOR HALOGEN, BY REGION, 2022-2032 ($MILLION)
- TABLE 08. WORK LIGHTS MARKET FOR FLUORESCENT, BY REGION, 2022-2032 ($MILLION)
- TABLE 09. GLOBAL WORK LIGHTS MARKET, BY POWER SOURCE, 2022-2032 ($MILLION)
- TABLE 10. WORK LIGHTS MARKET FOR PLUG-IN, BY REGION, 2022-2032 ($MILLION)
- TABLE 11. WORK LIGHTS MARKET FOR BATTERY, BY REGION, 2022-2032 ($MILLION)
- TABLE 12. GLOBAL WORK LIGHTS MARKET, BY END-USE, 2022-2032 ($MILLION)
- TABLE 13. WORK LIGHTS MARKET FOR CONSTRUCTION, BY REGION, 2022-2032 ($MILLION)
- TABLE 14. WORK LIGHTS MARKET FOR WAREHOUSES, BY REGION, 2022-2032 ($MILLION)
- TABLE 15. WORK LIGHTS MARKET FOR MANUFACTURING, BY REGION, 2022-2032 ($MILLION)
- TABLE 16. WORK LIGHTS MARKET FOR MINING, BY REGION, 2022-2032 ($MILLION)
- TABLE 17. WORK LIGHTS MARKET FOR OTHERS, BY REGION, 2022-2032 ($MILLION)
- TABLE 18. WORK LIGHTS MARKET, BY REGION, 2022-2032 ($MILLION)
- TABLE 19. NORTH AMERICA WORK LIGHTS MARKET, BY TYPE, 2022-2032 ($MILLION)
- TABLE 20. NORTH AMERICA WORK LIGHTS MARKET, BY LIGHT TECHNOLOGY, 2022-2032 ($MILLION)
- TABLE 21. NORTH AMERICA WORK LIGHTS MARKET, BY POWER SOURCE, 2022-2032 ($MILLION)
- TABLE 22. NORTH AMERICA WORK LIGHTS MARKET, BY END-USE, 2022-2032 ($MILLION)
- TABLE 23. NORTH AMERICA WORK LIGHTS MARKET, BY COUNTRY, 2022-2032 ($MILLION)
- TABLE 24. U.S. WORK LIGHTS MARKET, BY TYPE, 2022-2032 ($MILLION)
- TABLE 25. U.S. WORK LIGHTS MARKET, BY LIGHT TECHNOLOGY, 2022-2032 ($MILLION)
- TABLE 26. U.S. WORK LIGHTS MARKET, BY POWER SOURCE, 2022-2032 ($MILLION)
- TABLE 27. U.S. WORK LIGHTS MARKET, BY END-USE, 2022-2032 ($MILLION)
- TABLE 28. CANADA WORK LIGHTS MARKET, BY TYPE, 2022-2032 ($MILLION)
- TABLE 29. CANADA WORK LIGHTS MARKET, BY LIGHT TECHNOLOGY, 2022-2032 ($MILLION)
- TABLE 30. CANADA WORK LIGHTS MARKET, BY POWER SOURCE, 2022-2032 ($MILLION)
- TABLE 31. CANADA WORK LIGHTS MARKET, BY END-USE, 2022-2032 ($MILLION)
- TABLE 32. MEXICO WORK LIGHTS MARKET, BY TYPE, 2022-2032 ($MILLION)
- TABLE 33. MEXICO WORK LIGHTS MARKET, BY LIGHT TECHNOLOGY, 2022-2032 ($MILLION)
- TABLE 34. MEXICO WORK LIGHTS MARKET, BY POWER SOURCE, 2022-2032 ($MILLION)
- TABLE 35. MEXICO WORK LIGHTS MARKET, BY END-USE, 2022-2032 ($MILLION)
- TABLE 36. EUROPE WORK LIGHTS MARKET, BY TYPE, 2022-2032 ($MILLION)
- TABLE 37. EUROPE WORK LIGHTS MARKET, BY LIGHT TECHNOLOGY, 2022-2032 ($MILLION)
- TABLE 38. EUROPE WORK LIGHTS MARKET, BY POWER SOURCE, 2022-2032 ($MILLION)
- TABLE 39. EUROPE WORK LIGHTS MARKET, BY END-USE, 2022-2032 ($MILLION)
- TABLE 40. EUROPE WORK LIGHTS MARKET, BY COUNTRY, 2022-2032 ($MILLION)
- TABLE 41. GERMANY WORK LIGHTS MARKET, BY TYPE, 2022-2032 ($MILLION)
- TABLE 42. GERMANY WORK LIGHTS MARKET, BY LIGHT TECHNOLOGY, 2022-2032 ($MILLION)
- TABLE 43. GERMANY WORK LIGHTS MARKET, BY POWER SOURCE, 2022-2032 ($MILLION)
- TABLE 44. GERMANY WORK LIGHTS MARKET, BY END-USE, 2022-2032 ($MILLION)
- TABLE 45. FRANCE WORK LIGHTS MARKET, BY TYPE, 2022-2032 ($MILLION)
- TABLE 46. FRANCE WORK LIGHTS MARKET, BY LIGHT TECHNOLOGY, 2022-2032 ($MILLION)
- TABLE 47. FRANCE WORK LIGHTS MARKET, BY POWER SOURCE, 2022-2032 ($MILLION)
- TABLE 48. FRANCE WORK LIGHTS MARKET, BY END-USE, 2022-2032 ($MILLION)
- TABLE 49. UK WORK LIGHTS MARKET, BY TYPE, 2022-2032 ($MILLION)
- TABLE 50. UK WORK LIGHTS MARKET, BY LIGHT TECHNOLOGY, 2022-2032 ($MILLION)
- TABLE 51. UK WORK LIGHTS MARKET, BY POWER SOURCE, 2022-2032 ($MILLION)
- TABLE 52. UK WORK LIGHTS MARKET, BY END-USE, 2022-2032 ($MILLION)
- TABLE 53. ITALY WORK LIGHTS MARKET, BY TYPE, 2022-2032 ($MILLION)
- TABLE 54. ITALY WORK LIGHTS MARKET, BY LIGHT TECHNOLOGY, 2022-2032 ($MILLION)
- TABLE 55. ITALY WORK LIGHTS MARKET, BY POWER SOURCE, 2022-2032 ($MILLION)
- TABLE 56. ITALY WORK LIGHTS MARKET, BY END-USE, 2022-2032 ($MILLION)
- TABLE 57. SPAIN WORK LIGHTS MARKET, BY TYPE, 2022-2032 ($MILLION)
- TABLE 58. SPAIN WORK LIGHTS MARKET, BY LIGHT TECHNOLOGY, 2022-2032 ($MILLION)
- TABLE 59. SPAIN WORK LIGHTS MARKET, BY POWER SOURCE, 2022-2032 ($MILLION)
- TABLE 60. SPAIN WORK LIGHTS MARKET, BY END-USE, 2022-2032 ($MILLION)
- TABLE 61. REST OF EUROPE WORK LIGHTS MARKET, BY TYPE, 2022-2032 ($MILLION)
- TABLE 62. REST OF EUROPE WORK LIGHTS MARKET, BY LIGHT TECHNOLOGY, 2022-2032 ($MILLION)
- TABLE 63. REST OF EUROPE WORK LIGHTS MARKET, BY POWER SOURCE, 2022-2032 ($MILLION)
- TABLE 64. REST OF EUROPE WORK LIGHTS MARKET, BY END-USE, 2022-2032 ($MILLION)
- TABLE 65. ASIA-PACIFIC WORK LIGHTS MARKET, BY TYPE, 2022-2032 ($MILLION)
- TABLE 66. ASIA-PACIFIC WORK LIGHTS MARKET, BY LIGHT TECHNOLOGY, 2022-2032 ($MILLION)
- TABLE 67. ASIA-PACIFIC WORK LIGHTS MARKET, BY POWER SOURCE, 2022-2032 ($MILLION)
- TABLE 68. ASIA-PACIFIC WORK LIGHTS MARKET, BY END-USE, 2022-2032 ($MILLION)
- TABLE 69. ASIA-PACIFIC WORK LIGHTS MARKET, BY COUNTRY, 2022-2032 ($MILLION)
- TABLE 70. CHINA WORK LIGHTS MARKET, BY TYPE, 2022-2032 ($MILLION)
- TABLE 71. CHINA WORK LIGHTS MARKET, BY LIGHT TECHNOLOGY, 2022-2032 ($MILLION)
- TABLE 72. CHINA WORK LIGHTS MARKET, BY POWER SOURCE, 2022-2032 ($MILLION)
- TABLE 73. CHINA WORK LIGHTS MARKET, BY END-USE, 2022-2032 ($MILLION)
- TABLE 74. JAPAN WORK LIGHTS MARKET, BY TYPE, 2022-2032 ($MILLION)
- TABLE 75. JAPAN WORK LIGHTS MARKET, BY LIGHT TECHNOLOGY, 2022-2032 ($MILLION)
- TABLE 76. JAPAN WORK LIGHTS MARKET, BY POWER SOURCE, 2022-2032 ($MILLION)
- TABLE 77. JAPAN WORK LIGHTS MARKET, BY END-USE, 2022-2032 ($MILLION)
- TABLE 78. INDIA WORK LIGHTS MARKET, BY TYPE, 2022-2032 ($MILLION)
- TABLE 79. INDIA WORK LIGHTS MARKET, BY LIGHT TECHNOLOGY, 2022-2032 ($MILLION)
- TABLE 80. INDIA WORK LIGHTS MARKET, BY POWER SOURCE, 2022-2032 ($MILLION)
- TABLE 81. INDIA WORK LIGHTS MARKET, BY END-USE, 2022-2032 ($MILLION)
- TABLE 82. SOUTH KOREA WORK LIGHTS MARKET, BY TYPE, 2022-2032 ($MILLION)
- TABLE 83. SOUTH KOREA WORK LIGHTS MARKET, BY LIGHT TECHNOLOGY, 2022-2032 ($MILLION)
- TABLE 84. SOUTH KOREA WORK LIGHTS MARKET, BY POWER SOURCE, 2022-2032 ($MILLION)
- TABLE 85. SOUTH KOREA WORK LIGHTS MARKET, BY END-USE, 2022-2032 ($MILLION)
- TABLE 86. AUSTRALIA WORK LIGHTS MARKET, BY TYPE, 2022-2032 ($MILLION)
- TABLE 87. AUSTRALIA WORK LIGHTS MARKET, BY LIGHT TECHNOLOGY, 2022-2032 ($MILLION)
- TABLE 88. AUSTRALIA WORK LIGHTS MARKET, BY POWER SOURCE, 2022-2032 ($MILLION)
- TABLE 89. AUSTRALIA WORK LIGHTS MARKET, BY END-USE, 2022-2032 ($MILLION)
- TABLE 90. REST OF ASIA-PACIFIC WORK LIGHTS MARKET, BY TYPE, 2022-2032 ($MILLION)
- TABLE 91. REST OF ASIA-PACIFIC WORK LIGHTS MARKET, BY LIGHT TECHNOLOGY, 2022-2032 ($MILLION)
- TABLE 92. REST OF ASIA-PACIFIC WORK LIGHTS MARKET, BY POWER SOURCE, 2022-2032 ($MILLION)
- TABLE 93. REST OF ASIA-PACIFIC WORK LIGHTS MARKET, BY END-USE, 2022-2032 ($MILLION)
- TABLE 94. LAMEA WORK LIGHTS MARKET, BY TYPE, 2022-2032 ($MILLION)
- TABLE 95. LAMEA WORK LIGHTS MARKET, BY LIGHT TECHNOLOGY, 2022-2032 ($MILLION)
- TABLE 96. LAMEA WORK LIGHTS MARKET, BY POWER SOURCE, 2022-2032 ($MILLION)
- TABLE 97. LAMEA WORK LIGHTS MARKET, BY END-USE, 2022-2032 ($MILLION)
- TABLE 98. LAMEA WORK LIGHTS MARKET, BY COUNTRY, 2022-2032 ($MILLION)
- TABLE 99. BRAZIL WORK LIGHTS MARKET, BY TYPE, 2022-2032 ($MILLION)
- TABLE 100. BRAZIL WORK LIGHTS MARKET, BY LIGHT TECHNOLOGY, 2022-2032 ($MILLION)
- TABLE 101. BRAZIL WORK LIGHTS MARKET, BY POWER SOURCE, 2022-2032 ($MILLION)
- TABLE 102. BRAZIL WORK LIGHTS MARKET, BY END-USE, 2022-2032 ($MILLION)
- TABLE 103. SAUDI ARABIA WORK LIGHTS MARKET, BY TYPE, 2022-2032 ($MILLION)
- TABLE 104. SAUDI ARABIA WORK LIGHTS MARKET, BY LIGHT TECHNOLOGY, 2022-2032 ($MILLION)
- TABLE 105. SAUDI ARABIA WORK LIGHTS MARKET, BY POWER SOURCE, 2022-2032 ($MILLION)
- TABLE 106. SAUDI ARABIA WORK LIGHTS MARKET, BY END-USE, 2022-2032 ($MILLION)
- TABLE 107. SOUTH AFRICA WORK LIGHTS MARKET, BY TYPE, 2022-2032 ($MILLION)
- TABLE 108. SOUTH AFRICA WORK LIGHTS MARKET, BY LIGHT TECHNOLOGY, 2022-2032 ($MILLION)
- TABLE 109. SOUTH AFRICA WORK LIGHTS MARKET, BY POWER SOURCE, 2022-2032 ($MILLION)
- TABLE 110. SOUTH AFRICA WORK LIGHTS MARKET, BY END-USE, 2022-2032 ($MILLION)
- TABLE 111. UAE WORK LIGHTS MARKET, BY TYPE, 2022-2032 ($MILLION)
- TABLE 112. UAE WORK LIGHTS MARKET, BY LIGHT TECHNOLOGY, 2022-2032 ($MILLION)
- TABLE 113. UAE WORK LIGHTS MARKET, BY POWER SOURCE, 2022-2032 ($MILLION)
- TABLE 114. UAE WORK LIGHTS MARKET, BY END-USE, 2022-2032 ($MILLION)
- TABLE 115. ARGENTINA WORK LIGHTS MARKET, BY TYPE, 2022-2032 ($MILLION)
- TABLE 116. ARGENTINA WORK LIGHTS MARKET, BY LIGHT TECHNOLOGY, 2022-2032 ($MILLION)
- TABLE 117. ARGENTINA WORK LIGHTS MARKET, BY POWER SOURCE, 2022-2032 ($MILLION)
- TABLE 118. ARGENTINA WORK LIGHTS MARKET, BY END-USE, 2022-2032 ($MILLION)
- TABLE 119. REST OF LAMEA WORK LIGHTS MARKET, BY TYPE, 2022-2032 ($MILLION)
- TABLE 120. REST OF LAMEA WORK LIGHTS MARKET, BY LIGHT TECHNOLOGY, 2022-2032 ($MILLION)
- TABLE 121. REST OF LAMEA WORK LIGHTS MARKET, BY POWER SOURCE, 2022-2032 ($MILLION)
- TABLE 122. REST OF LAMEA WORK LIGHTS MARKET, BY END-USE, 2022-2032 ($MILLION)
- TABLE 123. HORPOL J.I.A.T. HORECZY SP. K.: KEY EXECUTIVES
- TABLE 124. HORPOL J.I.A.T. HORECZY SP. K.: COMPANY SNAPSHOT
- TABLE 125. HORPOL J.I.A.T. HORECZY SP. K.: PRODUCT SEGMENTS
- TABLE 126. HORPOL J.I.A.T. HORECZY SP. K.: PRODUCT PORTFOLIO
- TABLE 127. STE: KEY EXECUTIVES
- TABLE 128. STE: COMPANY SNAPSHOT
- TABLE 129. STE: PRODUCT SEGMENTS
- TABLE 130. STE: PRODUCT PORTFOLIO
- TABLE 131. PETERSON MANUFACTURING: KEY EXECUTIVES
- TABLE 132. PETERSON MANUFACTURING: COMPANY SNAPSHOT
- TABLE 133. PETERSON MANUFACTURING: PRODUCT SEGMENTS
- TABLE 134. PETERSON MANUFACTURING: PRODUCT PORTFOLIO
- TABLE 135. AIS LED: KEY EXECUTIVES
- TABLE 136. AIS LED: COMPANY SNAPSHOT
- TABLE 137. AIS LED: PRODUCT SEGMENTS
- TABLE 138. AIS LED: PRODUCT PORTFOLIO
- TABLE 139. SCANGRIP NORTH AMERICA INC.: KEY EXECUTIVES
- TABLE 140. SCANGRIP NORTH AMERICA INC.: COMPANY SNAPSHOT
- TABLE 141. SCANGRIP NORTH AMERICA INC.: PRODUCT SEGMENTS
- TABLE 142. SCANGRIP NORTH AMERICA INC.: PRODUCT PORTFOLIO
- TABLE 143. SCANGRIP NORTH AMERICA INC.: KEY STRATERGIES
- TABLE 144. KIRA LEUCHTEN GMBH: KEY EXECUTIVES
- TABLE 145. KIRA LEUCHTEN GMBH: COMPANY SNAPSHOT
- TABLE 146. KIRA LEUCHTEN GMBH: PRODUCT SEGMENTS
- TABLE 147. KIRA LEUCHTEN GMBH: PRODUCT PORTFOLIO
- TABLE 148. KIRA LEUCHTEN GMBH: KEY STRATERGIES
- TABLE 149. HUGO BRENNENSTUHL GMBH & CO KOMMANDITGESELLSCHAFT: KEY EXECUTIVES
- TABLE 150. HUGO BRENNENSTUHL GMBH & CO KOMMANDITGESELLSCHAFT: COMPANY SNAPSHOT
- TABLE 151. HUGO BRENNENSTUHL GMBH & CO KOMMANDITGESELLSCHAFT: PRODUCT SEGMENTS
- TABLE 152. HUGO BRENNENSTUHL GMBH & CO KOMMANDITGESELLSCHAFT: PRODUCT PORTFOLIO
- TABLE 153. LEDLENSER: KEY EXECUTIVES
- TABLE 154. LEDLENSER: COMPANY SNAPSHOT
- TABLE 155. LEDLENSER: PRODUCT SEGMENTS
- TABLE 156. LEDLENSER: PRODUCT PORTFOLIO
- TABLE 157. GENTOS CO., LTD.: KEY EXECUTIVES
- TABLE 158. GENTOS CO., LTD.: COMPANY SNAPSHOT
- TABLE 159. GENTOS CO., LTD.: PRODUCT SEGMENTS
- TABLE 160. GENTOS CO., LTD.: PRODUCT PORTFOLIO
- TABLE 161. GENTOS CO., LTD.: KEY STRATERGIES
- TABLE 162. LUXGEND ELECTRONICS CO., LTD.: KEY EXECUTIVES
- TABLE 163. LUXGEND ELECTRONICS CO., LTD.: COMPANY SNAPSHOT
- TABLE 164. LUXGEND ELECTRONICS CO., LTD.: PRODUCT SEGMENTS
- TABLE 165. LUXGEND ELECTRONICS CO., LTD.: PRODUCT PORTFOLIO
LIST OF FIGURES
- FIGURE 01. WORK LIGHTS MARKET, 2022-2032
- FIGURE 02. SEGMENTATION OF WORK LIGHTS MARKET, 2022-2032
- FIGURE 03. TOP INVESTMENT POCKETS IN WORK LIGHTS MARKET (2023-2032)
- FIGURE 04. LOW BARGAINING POWER OF SUPPLIERS
- FIGURE 05. LOW BARGAINING POWER OF BUYERS
- FIGURE 06. LOW THREAT OF SUBSTITUTES
- FIGURE 07. LOW THREAT OF NEW ENTRANTS
- FIGURE 08. LOW INTENSITY OF RIVALRY
- FIGURE 09. DRIVERS, RESTRAINTS AND OPPORTUNITIES: GLOBALWORK LIGHTS MARKET
- FIGURE 10. IMPACT OF KEY REGULATION: WORK LIGHTS MARKET
- FIGURE 11. VALUE CHAIN ANALYSIS: WORK LIGHTS MARKET
- FIGURE 12. WORK LIGHTS MARKET, BY TYPE, 2022(%)
- FIGURE 13. COMPARATIVE SHARE ANALYSIS OF WORK LIGHTS MARKET FOR PORTABLE, BY COUNTRY 2022 AND 2032(%)
- FIGURE 14. COMPARATIVE SHARE ANALYSIS OF WORK LIGHTS MARKET FOR TRIPOD, BY COUNTRY 2022 AND 2032(%)
- FIGURE 15. COMPARATIVE SHARE ANALYSIS OF WORK LIGHTS MARKET FOR HANDHELD AND RETRACTABLE, BY COUNTRY 2022 AND 2032(%)
- FIGURE 16. WORK LIGHTS MARKET, BY LIGHT TECHNOLOGY, 2022(%)
- FIGURE 17. COMPARATIVE SHARE ANALYSIS OF WORK LIGHTS MARKET FOR INTEGRATED LED, BY COUNTRY 2022 AND 2032(%)
- FIGURE 18. COMPARATIVE SHARE ANALYSIS OF WORK LIGHTS MARKET FOR HALOGEN, BY COUNTRY 2022 AND 2032(%)
- FIGURE 19. COMPARATIVE SHARE ANALYSIS OF WORK LIGHTS MARKET FOR FLUORESCENT, BY COUNTRY 2022 AND 2032(%)
- FIGURE 20. WORK LIGHTS MARKET, BY POWER SOURCE, 2022(%)
- FIGURE 21. COMPARATIVE SHARE ANALYSIS OF WORK LIGHTS MARKET FOR PLUG-IN, BY COUNTRY 2022 AND 2032(%)
- FIGURE 22. COMPARATIVE SHARE ANALYSIS OF WORK LIGHTS MARKET FOR BATTERY, BY COUNTRY 2022 AND 2032(%)
- FIGURE 23. WORK LIGHTS MARKET, BY END-USE, 2022(%)
- FIGURE 24. COMPARATIVE SHARE ANALYSIS OF WORK LIGHTS MARKET FOR CONSTRUCTION, BY COUNTRY 2022 AND 2032(%)
- FIGURE 25. COMPARATIVE SHARE ANALYSIS OF WORK LIGHTS MARKET FOR WAREHOUSES, BY COUNTRY 2022 AND 2032(%)
- FIGURE 26. COMPARATIVE SHARE ANALYSIS OF WORK LIGHTS MARKET FOR MANUFACTURING, BY COUNTRY 2022 AND 2032(%)
- FIGURE 27. COMPARATIVE SHARE ANALYSIS OF WORK LIGHTS MARKET FOR MINING, BY COUNTRY 2022 AND 2032(%)
- FIGURE 28. COMPARATIVE SHARE ANALYSIS OF WORK LIGHTS MARKET FOR OTHERS, BY COUNTRY 2022 AND 2032(%)
- FIGURE 29. WORK LIGHTS MARKET BY REGION, 2022
- FIGURE 30. U.S. WORK LIGHTS MARKET, 2022-2032 ($MILLION)
- FIGURE 31. CANADA WORK LIGHTS MARKET, 2022-2032 ($MILLION)
- FIGURE 32. MEXICO WORK LIGHTS MARKET, 2022-2032 ($MILLION)
- FIGURE 33. GERMANY WORK LIGHTS MARKET, 2022-2032 ($MILLION)
- FIGURE 34. FRANCE WORK LIGHTS MARKET, 2022-2032 ($MILLION)
- FIGURE 35. UK WORK LIGHTS MARKET, 2022-2032 ($MILLION)
- FIGURE 36. ITALY WORK LIGHTS MARKET, 2022-2032 ($MILLION)
- FIGURE 37. SPAIN WORK LIGHTS MARKET, 2022-2032 ($MILLION)
- FIGURE 38. REST OF EUROPE WORK LIGHTS MARKET, 2022-2032 ($MILLION)
- FIGURE 39. CHINA WORK LIGHTS MARKET, 2022-2032 ($MILLION)
- FIGURE 40. JAPAN WORK LIGHTS MARKET, 2022-2032 ($MILLION)
- FIGURE 41. INDIA WORK LIGHTS MARKET, 2022-2032 ($MILLION)
- FIGURE 42. SOUTH KOREA WORK LIGHTS MARKET, 2022-2032 ($MILLION)
- FIGURE 43. AUSTRALIA WORK LIGHTS MARKET, 2022-2032 ($MILLION)
- FIGURE 44. REST OF ASIA-PACIFIC WORK LIGHTS MARKET, 2022-2032 ($MILLION)
- FIGURE 45. BRAZIL WORK LIGHTS MARKET, 2022-2032 ($MILLION)
- FIGURE 46. SAUDI ARABIA WORK LIGHTS MARKET, 2022-2032 ($MILLION)
- FIGURE 47. SOUTH AFRICA WORK LIGHTS MARKET, 2022-2032 ($MILLION)
- FIGURE 48. UAE WORK LIGHTS MARKET, 2022-2032 ($MILLION)
- FIGURE 49. ARGENTINA WORK LIGHTS MARKET, 2022-2032 ($MILLION)
- FIGURE 50. REST OF LAMEA WORK LIGHTS MARKET, 2022-2032 ($MILLION)
- FIGURE 51. TOP WINNING STRATEGIES, BY YEAR
- FIGURE 52. TOP WINNING STRATEGIES, BY DEVELOPMENT
- FIGURE 53. TOP WINNING STRATEGIES, BY COMPANY
- FIGURE 54. PRODUCT MAPPING OF TOP 10 PLAYERS
- FIGURE 55. COMPETITIVE DASHBOARD
- FIGURE 56. COMPETITIVE HEATMAP: WORK LIGHTS MARKET
- FIGURE 57. TOP PLAYER POSITIONING, 2022
 2024 年工作燈世界市場報告
 2024-2032 年工業和商業 LED 照明市場報告(按產品類型、應用、配銷通路、最終用戶和地區)
 2024年工商業LED照明全球市場報告
 全球工作燈市場規模、佔有率、趨勢分析報告:按電源、類型、照明技術、最終用途、區域前景和預測,2023-2030 年
 產業·商業用LED照明市場:各終端用戶,各地區- 規模,佔有率,展望,機會分析,2023~2030年
 電影、影像專業生產LED照明的全球市場:2022-2032年
 LED工作燈的全球市場
 全球工業和商業 LED 照明市場規模、份額、行業趨勢分析報告:按產品類型、應用、最終用戶、地區劃分的展望和預測,2022-2028 年
 產業用·商業用LED照明的全球市場 2022-2026