


 |
市場調查報告書
商品編碼
1344368
燃煤發電市場:按技術、按應用劃分:2023-2032 年全球機會分析與產業預測Coal Power Generation Market By Technology (Pulverized, Cyclone Furnaces, Others), By Application (Residential, Commercial, Industrial): Global Opportunity Analysis and Industry Forecast, 2023-2032 |
||||||
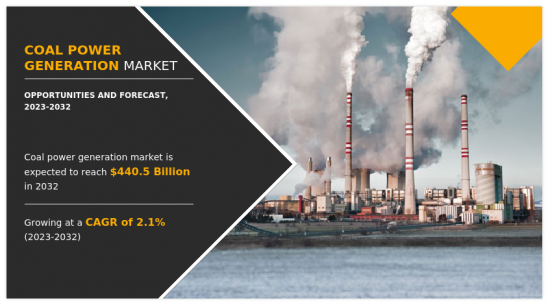
根據聯合市場研究公司發布的最新報告,2022年煤炭發電市場價值將達到3611億美元,2023年至2032年複合年增長率為2.1%,預計2032年將達到4405億美元。 。
煤炭是全球使用最廣泛的發電能源之一。 煤炭發電是指在發電廠燃燒煤炭作為燃料來發電的過程。 煤炭發電廣泛普及的地區通常擁有與採礦、運輸和營運發電廠相關的現有基礎設施和熟練勞動力。 利用這些資源可能會影響煤炭發電的持續使用。 燃煤電廠能夠持續運行,能夠穩定滿足電力需求,並提供穩定的電力供應。 然而,煤炭發電有一些顯著的缺點和環境問題。 燃燒煤炭會排放大量二氧化碳和其他污染物,造成空氣污染、氣候變遷和對健康的負面影響。
相反,人們正在努力透過提高燃煤電廠的效率、引入排放控制技術以及轉向更清潔、更永續的能源來解決這些問題。 旋風爐法是一種煤炭發電的替代方法,它利用旋風燃燒室取代傳統鍋爐。 此方法主要用於小型燃煤發電廠和工業設施。 旋風爐中使用的煤炭經過破碎、壓碎和篩分等初步加工,以獲得適合燃燒的一致粒度。 旋風爐採用一個或多個旋風燃燒室,而不是傳統的鍋爐。
這些室呈圓柱形或圓錐形,垂直排列。 噴煤在室內產生渦流運動,促進煤顆粒與燃燒空氣的混合。 燃燒產生的熱量被傳遞到安裝在旋風室內的熱交換器的表面。 使用蒸汽發生器或鍋爐將傳熱流體轉化為高壓蒸汽。 然後,該蒸汽被輸送至蒸□□汽渦輪機,類似於煤粉發電廠的過程。 高壓蒸汽驅動連接到發電機的渦輪機產生電力。 燃煤發電廠不用於住宅用途,因為它們的設計目的是大規模發電以滿足地區或國家需求。 支援煤炭發電所需的基礎設施,包括礦場、運輸系統和大型發電廠,規模龐大,不適合住宅使用。
但是,許多經濟體嚴重依賴燃煤發電來滿足其不斷增長的電力需求,因此也用於住宅用途。 快速的城市化,加上人口增長和電力需求的增加,歷史上導致了住宅區煤炭發電的增加。 隨著城市的發展和城市化,人口快速成長、基礎設施擴建和能源消耗增加等因素導致對電力的需求增加。 煤炭是傳統的發電能源,由於其來源廣泛,已成為滿足日益增長的居民用電需求的熱門選擇。
北美擁有大量煤炭儲量,為發電提供了國內可用且相對便宜的燃料來源。 這種可用性歷來促進了燃煤電廠的使用。 北美擁有發達的煤炭發電基礎設施。 許多燃煤電廠已經運作了幾十年,鐵路網路和煤炭運輸儲存設施等相關基礎設施也很完善。 美國燃煤發電量的下降是由天然氣發電廠的興起所推動的。 國內生產的天然氣豐富且與煤炭相比碳強度較低,使其成為更好的選擇。 加拿大承諾2030年逐步淘汰傳統燃煤發電。 這項承諾是我們減少溫室氣體排放和向清潔能源過渡的努力的一部分。
目錄
第1章簡介
第 2 章執行摘要
第3章市場概述
- 市場定義和範圍
- 主要發現
- 影響因素
- 主要投資機會
- 波特五力分析
- 市場動態
- 促進因素
- 煤炭的豐富性和可用性
- 煤炭的成本效益
- 抑制因素
- 煤炭發電導致環境問題日益嚴重
- 與再生能源的競爭和嚴格的排放法規
- 機會
- 先進煤炭技術
- 能源取得與開發
- 促進因素
- 新冠肺炎 (COVID-19):市場影響分析
- 價格分析
- 價值鏈分析
- 專利情況
第 4 章燃煤發電市場:依技術劃分
- 摘要
- 破碎爐
- 旋風爐
- 其他
第5章煤炭發電市場:依應用劃分
- 摘要
- 住房
- 商業
- 工業
第6章燃煤發電市場:依地區劃分
- 摘要
- 北美
- 美國
- 加拿大
- 墨西哥
- 歐洲
- 德國
- 英國
- 法國
- 義大利
- 西班牙
- 歐洲其他地區
- 亞太地區
- 中國
- 日本
- 印度
- 韓國
- 澳大利亞
- 其他亞太地區
- 拉丁美洲/中東/非洲
- 巴西
- 阿拉伯聯合大公國
- 南非
- 其他拉丁美洲/中東/非洲
第7章競爭態勢
- 簡介
- 關鍵成功策略
- 10家主要公司的產品圖譜
- 競爭對手儀表板
- 競爭熱圖
- 2022 年主要公司的定位
第8章公司簡介
- Adani Power Ltd
- China Huadian Corporation Ltd.
- Dominion Energy, Inc.
- NTPC Ltd
- Korea Electric Power Corporation KEPCO
- Jindal India Thermal Power Limited
- Uniper SE.
- China Shenhua Energy Company Limited
- Saudi Electricity Company
- China Huaneng Group Co., Ltd.
- American Electric Power Company, Inc.
- Duke Energy Corporation
According to a new report published by Allied Market Research, titled, "Coal Power Generation Market," The coal power generation market was valued at $361.1 billion in 2022 and is estimated to reach $440.5 billion by 2032, growing at a CAGR of 2.1% from 2023 to 2032.
Coal is one of the most widely used sources of energy for electricity generation worldwide. Coal power generation refers to the process of producing electricity by burning coal as a fuel in power plants. In regions where coal power generation has been prevalent, there is often an existing infrastructure and a skilled workforce associated with coal mining, transportation, and power plant operation. Utilizing these resources can influence the continued use of coal power generation. Coal power plants can provide a stable and consistent supply of electricity, as they can operate continuously and meet the demand for power consistently. However, coal power generation has several significant drawbacks and environmental concerns. The combustion of coal releases a large amount of carbon dioxide and other pollutants contribute to air pollution, climate change, and negative health effects.
Conversely, efforts are being made to address these issues by improving the efficiency of coal power plants, implementing emission control technologies, and transitioning to cleaner and more sustainable energy sources. The cyclone furnace method is an alternative approach to coal power generation that utilizes cyclone combustion chambers instead of traditional boilers. This method is primarily used in smaller scale coal-fired power plants and industrial facilities. The coal used in cyclone furnaces undergoes initial processing, including crushing, grinding, and screening to achieve a consistent particle size suitable for combustion. Instead of a conventional boiler, the cyclone furnace employs one or more cyclone combustion chambers.
These chambers are cylindrical or conical in shape and arranged in a vertical configuration. The coal injection creates a swirling motion within the chamber, promoting the mixing of coal particles with combustion air. The heat generated by combustion is transferred to heat exchanger surfaces affixed within the cyclone chamber. The heat transfer fluid is converted into high-pressure steam using a steam generator or boiler. This steam is subsequently directed to a steam turbine, similar to the process in pulverized coal power plants. The high-pressure steam drives a turbine connected to a generator, producing electricity. Coal power generation is not used for residential applications, as coal power plants are designed to generate electricity on a large scale to meet the demands of an entire region or country. The infrastructure required to support coal power generation, such as coal mines, transportation systems, and large power plants, is extensive and not suitable for residential applications.
However, there are many economies that are heavily dependent on coal-fired power generation to meet the ever-growing demand for electricity and thus use it in residential applications. Rapid urbanization, coupled with population growth and increased electricity demand, has historically led to an increase in coal power generation in residential areas. As cities grow and urbanize, the demand for electricity rises due to factors such as exponentially increasing population, expanding infrastructure, and higher energy consumption. Coal has been a traditional and readily available energy source for electricity generation, making it a common choice for meeting the growing residential electricity demand in the past.
North America has substantial coal reserves, making it a domestically available and relatively affordable fuel source for electricity generation. This availability has historically contributed to the utilization of coal power plants. North America has a well-developed infrastructure for coal power generation. Many coal-fired power plants have been in operation for decades, and the associated infrastructure, such as rail networks for coal transportation and storage facilities, is well-established. The decline of coal power generation in the U.S. has been accompanied by a rise in natural gas-fired power plants. The abundance of domestically produced natural gas and its lower carbon intensity compared to coal have made natural gas a more suitable option. Canada has committed to phasing out traditional coal-fired power generation by 2030. This commitment is part of the country's efforts to reduce greenhouse gas emissions and transition to cleaner energy sources.
The coal power generation market scope covers segmentation based on technology, application, and region. The report highlights the details about various technologies used in coal power generation, including pulverized, cyclone furnaces, and others. In addition, the applications covered in the study include residential, commercial, and industrial. Moreover, the report analyzes the current market trends of cola power generation across different regions such as North America, Europe, Asia-Pacific, and LAMEA and suggests future growth opportunities. The key players profiled in the coal power generation industry are Adani Power Limited, China Huadian Corporation LTD., Dominion Energy, NTPC Limited, KEPCO E&C, Jindal India Thermal Power ltd., Uniper SE, China Shenhua Energy Company Limited, Saudi Electricity Company, China Huaneng Group Co., Ltd., American Electric Power Company, Inc., and Duke Energy Corporation.
The growth drivers, restraints, and opportunities are explained in the report to better understand the market dynamics. This report further highlights the key areas of investment. In addition, it includes Porter's five forces analysis to understand the competitive scenario of the industry and the role of each stakeholder. The report features strategies adopted by key market players to maintain their foothold in the market. Furthermore, it highlights the competitive landscape of key players to increase their market share and sustain the intense competition in the industry
Key Benefits For Stakeholders
- This report provides a quantitative analysis of the market segments, current trends, estimations, and dynamics of the coal power generation market analysis from 2022 to 2032 to identify the prevailing coal power generation market opportunities.
- The market research is offered along with information related to key drivers, restraints, and opportunities.
- Porter's five forces analysis highlights the potency of buyers and suppliers to enable stakeholders make profit-oriented business decisions and strengthen their supplier-buyer network.
- In-depth analysis of the coal power generation market segmentation assists to determine the prevailing market opportunities.
- Major countries in each region are mapped according to their revenue contribution to the global market.
- Market player positioning facilitates benchmarking and provides a clear understanding of the present position of the market players.
- The report includes the analysis of the regional as well as global coal power generation market trends, key players, market segments, application areas, and market growth strategies.
Key Market Segments
By Technology
- Cyclone Furnaces
- Others
- Pulverized
By Application
- Residential
- Commercial
- Industrial
By Region
- North America
- U.S.
- Canada
- Mexico
- Europe
- Germany
- UK
- France
- Italy
- Spain
- Rest of Europe
- Asia-Pacific
- China
- Japan
- India
- South Korea
- Australia
- Rest of Asia-Pacific
- LAMEA
- Brazil
- United Arab Emirates
- South Africa
- Rest of LAMEA
Key Market Players:
- Adani Power Ltd
- American Electric Power Company, Inc.
- China Huadian Corporation Ltd.
- China Huaneng Group Co., Ltd.
- China Shenhua Energy Company Limited
- Dominion Energy, Inc.
- Duke Energy Corporation
- Jindal India Thermal Power Limited
- Korea Electric Power Corporation KEPCO
- NTPC Ltd
- Saudi Electricity Company
- Uniper SE.
TABLE OF CONTENTS
CHAPTER 1: INTRODUCTION
- 1.1. Report description
- 1.2. Key market segments
- 1.3. Key benefits to the stakeholders
- 1.4. Research Methodology
- 1.4.1. Primary research
- 1.4.2. Secondary research
- 1.4.3. Analyst tools and models
CHAPTER 2: EXECUTIVE SUMMARY
- 2.1. CXO Perspective
CHAPTER 3: MARKET OVERVIEW
- 3.1. Market definition and scope
- 3.2. Key findings
- 3.2.1. Top impacting factors
- 3.2.2. Top investment pockets
- 3.3. Porter's five forces analysis
- 3.3.1. Low bargaining power of suppliers
- 3.3.2. Low threat of new entrants
- 3.3.3. Low threat of substitutes
- 3.3.4. Low intensity of rivalry
- 3.3.5. Low bargaining power of buyers
- 3.4. Market dynamics
- 3.4.1. Drivers
- 3.4.1.1. Abundance and accessibility of coal
- 3.4.1.2. Cost-effectiveness of coal
- 3.4.1. Drivers
- 3.4.2. Restraints
- 3.4.2.1. Increase in environmental concerns due to coal power generation
- 3.4.2.2. Renewable Energy Competitiveness and stringent emission regulations
- 3.4.3. Opportunities
- 3.4.3.1. Advanced Coal Technologies
- 3.4.3.2. Energy Access and Development
- 3.5. COVID-19 Impact Analysis on the market
- 3.6. Pricing Analysis
- 3.7. Value Chain Analysis
- 3.8. Patent Landscape
CHAPTER 4: COAL POWER GENERATION MARKET, BY TECHNOLOGY
- 4.1. Overview
- 4.1.1. Market size and forecast
- 4.2. Pulverized
- 4.2.1. Key market trends, growth factors and opportunities
- 4.2.2. Market size and forecast, by region
- 4.2.3. Market share analysis by country
- 4.3. Cyclone Furnaces
- 4.3.1. Key market trends, growth factors and opportunities
- 4.3.2. Market size and forecast, by region
- 4.3.3. Market share analysis by country
- 4.4. Others
- 4.4.1. Key market trends, growth factors and opportunities
- 4.4.2. Market size and forecast, by region
- 4.4.3. Market share analysis by country
CHAPTER 5: COAL POWER GENERATION MARKET, BY APPLICATION
- 5.1. Overview
- 5.1.1. Market size and forecast
- 5.2. Residential
- 5.2.1. Key market trends, growth factors and opportunities
- 5.2.2. Market size and forecast, by region
- 5.2.3. Market share analysis by country
- 5.3. Commercial
- 5.3.1. Key market trends, growth factors and opportunities
- 5.3.2. Market size and forecast, by region
- 5.3.3. Market share analysis by country
- 5.4. Industrial
- 5.4.1. Key market trends, growth factors and opportunities
- 5.4.2. Market size and forecast, by region
- 5.4.3. Market share analysis by country
CHAPTER 6: COAL POWER GENERATION MARKET, BY REGION
- 6.1. Overview
- 6.1.1. Market size and forecast By Region
- 6.2. North America
- 6.2.1. Key trends and opportunities
- 6.2.2. Market size and forecast, by Technology
- 6.2.3. Market size and forecast, by Application
- 6.2.4. Market size and forecast, by country
- 6.2.4.1. U.S.
- 6.2.4.1.1. Key market trends, growth factors and opportunities
- 6.2.4.1.2. Market size and forecast, by Technology
- 6.2.4.1.3. Market size and forecast, by Application
- 6.2.4.2. Canada
- 6.2.4.2.1. Key market trends, growth factors and opportunities
- 6.2.4.2.2. Market size and forecast, by Technology
- 6.2.4.2.3. Market size and forecast, by Application
- 6.2.4.3. Mexico
- 6.2.4.3.1. Key market trends, growth factors and opportunities
- 6.2.4.3.2. Market size and forecast, by Technology
- 6.2.4.3.3. Market size and forecast, by Application
- 6.3. Europe
- 6.3.1. Key trends and opportunities
- 6.3.2. Market size and forecast, by Technology
- 6.3.3. Market size and forecast, by Application
- 6.3.4. Market size and forecast, by country
- 6.3.4.1. Germany
- 6.3.4.1.1. Key market trends, growth factors and opportunities
- 6.3.4.1.2. Market size and forecast, by Technology
- 6.3.4.1.3. Market size and forecast, by Application
- 6.3.4.2. UK
- 6.3.4.2.1. Key market trends, growth factors and opportunities
- 6.3.4.2.2. Market size and forecast, by Technology
- 6.3.4.2.3. Market size and forecast, by Application
- 6.3.4.3. France
- 6.3.4.3.1. Key market trends, growth factors and opportunities
- 6.3.4.3.2. Market size and forecast, by Technology
- 6.3.4.3.3. Market size and forecast, by Application
- 6.3.4.4. Italy
- 6.3.4.4.1. Key market trends, growth factors and opportunities
- 6.3.4.4.2. Market size and forecast, by Technology
- 6.3.4.4.3. Market size and forecast, by Application
- 6.3.4.5. Spain
- 6.3.4.5.1. Key market trends, growth factors and opportunities
- 6.3.4.5.2. Market size and forecast, by Technology
- 6.3.4.5.3. Market size and forecast, by Application
- 6.3.4.6. Rest of Europe
- 6.3.4.6.1. Key market trends, growth factors and opportunities
- 6.3.4.6.2. Market size and forecast, by Technology
- 6.3.4.6.3. Market size and forecast, by Application
- 6.4. Asia-Pacific
- 6.4.1. Key trends and opportunities
- 6.4.2. Market size and forecast, by Technology
- 6.4.3. Market size and forecast, by Application
- 6.4.4. Market size and forecast, by country
- 6.4.4.1. China
- 6.4.4.1.1. Key market trends, growth factors and opportunities
- 6.4.4.1.2. Market size and forecast, by Technology
- 6.4.4.1.3. Market size and forecast, by Application
- 6.4.4.2. Japan
- 6.4.4.2.1. Key market trends, growth factors and opportunities
- 6.4.4.2.2. Market size and forecast, by Technology
- 6.4.4.2.3. Market size and forecast, by Application
- 6.4.4.3. India
- 6.4.4.3.1. Key market trends, growth factors and opportunities
- 6.4.4.3.2. Market size and forecast, by Technology
- 6.4.4.3.3. Market size and forecast, by Application
- 6.4.4.4. South Korea
- 6.4.4.4.1. Key market trends, growth factors and opportunities
- 6.4.4.4.2. Market size and forecast, by Technology
- 6.4.4.4.3. Market size and forecast, by Application
- 6.4.4.5. Australia
- 6.4.4.5.1. Key market trends, growth factors and opportunities
- 6.4.4.5.2. Market size and forecast, by Technology
- 6.4.4.5.3. Market size and forecast, by Application
- 6.4.4.6. Rest of Asia-Pacific
- 6.4.4.6.1. Key market trends, growth factors and opportunities
- 6.4.4.6.2. Market size and forecast, by Technology
- 6.4.4.6.3. Market size and forecast, by Application
- 6.5. LAMEA
- 6.5.1. Key trends and opportunities
- 6.5.2. Market size and forecast, by Technology
- 6.5.3. Market size and forecast, by Application
- 6.5.4. Market size and forecast, by country
- 6.5.4.1. Brazil
- 6.5.4.1.1. Key market trends, growth factors and opportunities
- 6.5.4.1.2. Market size and forecast, by Technology
- 6.5.4.1.3. Market size and forecast, by Application
- 6.5.4.2. United Arab Emirates
- 6.5.4.2.1. Key market trends, growth factors and opportunities
- 6.5.4.2.2. Market size and forecast, by Technology
- 6.5.4.2.3. Market size and forecast, by Application
- 6.5.4.3. South Africa
- 6.5.4.3.1. Key market trends, growth factors and opportunities
- 6.5.4.3.2. Market size and forecast, by Technology
- 6.5.4.3.3. Market size and forecast, by Application
- 6.5.4.4. Rest of LAMEA
- 6.5.4.4.1. Key market trends, growth factors and opportunities
- 6.5.4.4.2. Market size and forecast, by Technology
- 6.5.4.4.3. Market size and forecast, by Application
CHAPTER 7: COMPETITIVE LANDSCAPE
- 7.1. Introduction
- 7.2. Top winning strategies
- 7.3. Product Mapping of Top 10 Player
- 7.4. Competitive Dashboard
- 7.5. Competitive Heatmap
- 7.6. Top player positioning, 2022
CHAPTER 8: COMPANY PROFILES
- 8.1. Adani Power Ltd
- 8.1.1. Company overview
- 8.1.2. Key Executives
- 8.1.3. Company snapshot
- 8.1.4. Operating business segments
- 8.1.5. Product portfolio
- 8.1.6. Business performance
- 8.2. China Huadian Corporation Ltd.
- 8.2.1. Company overview
- 8.2.2. Key Executives
- 8.2.3. Company snapshot
- 8.2.4. Operating business segments
- 8.2.5. Product portfolio
- 8.3. Dominion Energy, Inc.
- 8.3.1. Company overview
- 8.3.2. Key Executives
- 8.3.3. Company snapshot
- 8.3.4. Operating business segments
- 8.3.5. Product portfolio
- 8.3.6. Business performance
- 8.4. NTPC Ltd
- 8.4.1. Company overview
- 8.4.2. Key Executives
- 8.4.3. Company snapshot
- 8.4.4. Operating business segments
- 8.4.5. Product portfolio
- 8.4.6. Business performance
- 8.5. Korea Electric Power Corporation KEPCO
- 8.5.1. Company overview
- 8.5.2. Key Executives
- 8.5.3. Company snapshot
- 8.5.4. Operating business segments
- 8.5.5. Product portfolio
- 8.5.6. Business performance
- 8.6. Jindal India Thermal Power Limited
- 8.6.1. Company overview
- 8.6.2. Key Executives
- 8.6.3. Company snapshot
- 8.6.4. Operating business segments
- 8.6.5. Product portfolio
- 8.7. Uniper SE.
- 8.7.1. Company overview
- 8.7.2. Key Executives
- 8.7.3. Company snapshot
- 8.7.4. Operating business segments
- 8.7.5. Product portfolio
- 8.7.6. Business performance
- 8.8. China Shenhua Energy Company Limited
- 8.8.1. Company overview
- 8.8.2. Key Executives
- 8.8.3. Company snapshot
- 8.8.4. Operating business segments
- 8.8.5. Product portfolio
- 8.8.6. Business performance
- 8.9. Saudi Electricity Company
- 8.9.1. Company overview
- 8.9.2. Key Executives
- 8.9.3. Company snapshot
- 8.9.4. Operating business segments
- 8.9.5. Product portfolio
- 8.9.6. Business performance
- 8.10. China Huaneng Group Co., Ltd.
- 8.10.1. Company overview
- 8.10.2. Key Executives
- 8.10.3. Company snapshot
- 8.10.4. Operating business segments
- 8.10.5. Product portfolio
- 8.11. American Electric Power Company, Inc.
- 8.11.1. Company overview
- 8.11.2. Key Executives
- 8.11.3. Company snapshot
- 8.11.4. Operating business segments
- 8.11.5. Product portfolio
- 8.11.6. Business performance
- 8.12. Duke Energy Corporation
- 8.12.1. Company overview
- 8.12.2. Key Executives
- 8.12.3. Company snapshot
- 8.12.4. Operating business segments
- 8.12.5. Product portfolio
- 8.12.6. Business performance
LIST OF TABLES
- TABLE 01. GLOBAL COAL POWER GENERATION MARKET, BY TECHNOLOGY, 2022-2032 ($MILLION)
- TABLE 02. COAL POWER GENERATION MARKET FOR PULVERIZED, BY REGION, 2022-2032 ($MILLION)
- TABLE 03. COAL POWER GENERATION MARKET FOR CYCLONE FURNACES, BY REGION, 2022-2032 ($MILLION)
- TABLE 04. COAL POWER GENERATION MARKET FOR OTHERS, BY REGION, 2022-2032 ($MILLION)
- TABLE 05. GLOBAL COAL POWER GENERATION MARKET, BY APPLICATION, 2022-2032 ($MILLION)
- TABLE 06. COAL POWER GENERATION MARKET FOR RESIDENTIAL, BY REGION, 2022-2032 ($MILLION)
- TABLE 07. COAL POWER GENERATION MARKET FOR COMMERCIAL, BY REGION, 2022-2032 ($MILLION)
- TABLE 08. COAL POWER GENERATION MARKET FOR INDUSTRIAL, BY REGION, 2022-2032 ($MILLION)
- TABLE 09. COAL POWER GENERATION MARKET, BY REGION, 2022-2032 ($MILLION)
- TABLE 10. NORTH AMERICA COAL POWER GENERATION MARKET, BY TECHNOLOGY, 2022-2032 ($MILLION)
- TABLE 11. NORTH AMERICA COAL POWER GENERATION MARKET, BY APPLICATION, 2022-2032 ($MILLION)
- TABLE 12. NORTH AMERICA COAL POWER GENERATION MARKET, BY COUNTRY, 2022-2032 ($MILLION)
- TABLE 13. U.S. COAL POWER GENERATION MARKET, BY TECHNOLOGY, 2022-2032 ($MILLION)
- TABLE 14. U.S. COAL POWER GENERATION MARKET, BY APPLICATION, 2022-2032 ($MILLION)
- TABLE 15. CANADA COAL POWER GENERATION MARKET, BY TECHNOLOGY, 2022-2032 ($MILLION)
- TABLE 16. CANADA COAL POWER GENERATION MARKET, BY APPLICATION, 2022-2032 ($MILLION)
- TABLE 17. MEXICO COAL POWER GENERATION MARKET, BY TECHNOLOGY, 2022-2032 ($MILLION)
- TABLE 18. MEXICO COAL POWER GENERATION MARKET, BY APPLICATION, 2022-2032 ($MILLION)
- TABLE 19. EUROPE COAL POWER GENERATION MARKET, BY TECHNOLOGY, 2022-2032 ($MILLION)
- TABLE 20. EUROPE COAL POWER GENERATION MARKET, BY APPLICATION, 2022-2032 ($MILLION)
- TABLE 21. EUROPE COAL POWER GENERATION MARKET, BY COUNTRY, 2022-2032 ($MILLION)
- TABLE 22. GERMANY COAL POWER GENERATION MARKET, BY TECHNOLOGY, 2022-2032 ($MILLION)
- TABLE 23. GERMANY COAL POWER GENERATION MARKET, BY APPLICATION, 2022-2032 ($MILLION)
- TABLE 24. UK COAL POWER GENERATION MARKET, BY TECHNOLOGY, 2022-2032 ($MILLION)
- TABLE 25. UK COAL POWER GENERATION MARKET, BY APPLICATION, 2022-2032 ($MILLION)
- TABLE 26. FRANCE COAL POWER GENERATION MARKET, BY TECHNOLOGY, 2022-2032 ($MILLION)
- TABLE 27. FRANCE COAL POWER GENERATION MARKET, BY APPLICATION, 2022-2032 ($MILLION)
- TABLE 28. ITALY COAL POWER GENERATION MARKET, BY TECHNOLOGY, 2022-2032 ($MILLION)
- TABLE 29. ITALY COAL POWER GENERATION MARKET, BY APPLICATION, 2022-2032 ($MILLION)
- TABLE 30. SPAIN COAL POWER GENERATION MARKET, BY TECHNOLOGY, 2022-2032 ($MILLION)
- TABLE 31. SPAIN COAL POWER GENERATION MARKET, BY APPLICATION, 2022-2032 ($MILLION)
- TABLE 32. REST OF EUROPE COAL POWER GENERATION MARKET, BY TECHNOLOGY, 2022-2032 ($MILLION)
- TABLE 33. REST OF EUROPE COAL POWER GENERATION MARKET, BY APPLICATION, 2022-2032 ($MILLION)
- TABLE 34. ASIA-PACIFIC COAL POWER GENERATION MARKET, BY TECHNOLOGY, 2022-2032 ($MILLION)
- TABLE 35. ASIA-PACIFIC COAL POWER GENERATION MARKET, BY APPLICATION, 2022-2032 ($MILLION)
- TABLE 36. ASIA-PACIFIC COAL POWER GENERATION MARKET, BY COUNTRY, 2022-2032 ($MILLION)
- TABLE 37. CHINA COAL POWER GENERATION MARKET, BY TECHNOLOGY, 2022-2032 ($MILLION)
- TABLE 38. CHINA COAL POWER GENERATION MARKET, BY APPLICATION, 2022-2032 ($MILLION)
- TABLE 39. JAPAN COAL POWER GENERATION MARKET, BY TECHNOLOGY, 2022-2032 ($MILLION)
- TABLE 40. JAPAN COAL POWER GENERATION MARKET, BY APPLICATION, 2022-2032 ($MILLION)
- TABLE 41. INDIA COAL POWER GENERATION MARKET, BY TECHNOLOGY, 2022-2032 ($MILLION)
- TABLE 42. INDIA COAL POWER GENERATION MARKET, BY APPLICATION, 2022-2032 ($MILLION)
- TABLE 43. SOUTH KOREA COAL POWER GENERATION MARKET, BY TECHNOLOGY, 2022-2032 ($MILLION)
- TABLE 44. SOUTH KOREA COAL POWER GENERATION MARKET, BY APPLICATION, 2022-2032 ($MILLION)
- TABLE 45. AUSTRALIA COAL POWER GENERATION MARKET, BY TECHNOLOGY, 2022-2032 ($MILLION)
- TABLE 46. AUSTRALIA COAL POWER GENERATION MARKET, BY APPLICATION, 2022-2032 ($MILLION)
- TABLE 47. REST OF ASIA-PACIFIC COAL POWER GENERATION MARKET, BY TECHNOLOGY, 2022-2032 ($MILLION)
- TABLE 48. REST OF ASIA-PACIFIC COAL POWER GENERATION MARKET, BY APPLICATION, 2022-2032 ($MILLION)
- TABLE 49. LAMEA COAL POWER GENERATION MARKET, BY TECHNOLOGY, 2022-2032 ($MILLION)
- TABLE 50. LAMEA COAL POWER GENERATION MARKET, BY APPLICATION, 2022-2032 ($MILLION)
- TABLE 51. LAMEA COAL POWER GENERATION MARKET, BY COUNTRY, 2022-2032 ($MILLION)
- TABLE 52. BRAZIL COAL POWER GENERATION MARKET, BY TECHNOLOGY, 2022-2032 ($MILLION)
- TABLE 53. BRAZIL COAL POWER GENERATION MARKET, BY APPLICATION, 2022-2032 ($MILLION)
- TABLE 54. UNITED ARAB EMIRATES COAL POWER GENERATION MARKET, BY TECHNOLOGY, 2022-2032 ($MILLION)
- TABLE 55. UNITED ARAB EMIRATES COAL POWER GENERATION MARKET, BY APPLICATION, 2022-2032 ($MILLION)
- TABLE 56. SOUTH AFRICA COAL POWER GENERATION MARKET, BY TECHNOLOGY, 2022-2032 ($MILLION)
- TABLE 57. SOUTH AFRICA COAL POWER GENERATION MARKET, BY APPLICATION, 2022-2032 ($MILLION)
- TABLE 58. REST OF LAMEA COAL POWER GENERATION MARKET, BY TECHNOLOGY, 2022-2032 ($MILLION)
- TABLE 59. REST OF LAMEA COAL POWER GENERATION MARKET, BY APPLICATION, 2022-2032 ($MILLION)
- TABLE 60. ADANI POWER LTD: KEY EXECUTIVES
- TABLE 61. ADANI POWER LTD: COMPANY SNAPSHOT
- TABLE 62. ADANI POWER LTD: SERVICE SEGMENTS
- TABLE 63. ADANI POWER LTD: PRODUCT PORTFOLIO
- TABLE 64. CHINA HUADIAN CORPORATION LTD.: KEY EXECUTIVES
- TABLE 65. CHINA HUADIAN CORPORATION LTD.: COMPANY SNAPSHOT
- TABLE 66. CHINA HUADIAN CORPORATION LTD.: PRODUCT SEGMENTS
- TABLE 67. CHINA HUADIAN CORPORATION LTD.: PRODUCT PORTFOLIO
- TABLE 68. DOMINION ENERGY, INC.: KEY EXECUTIVES
- TABLE 69. DOMINION ENERGY, INC.: COMPANY SNAPSHOT
- TABLE 70. DOMINION ENERGY, INC.: PRODUCT SEGMENTS
- TABLE 71. DOMINION ENERGY, INC.: PRODUCT PORTFOLIO
- TABLE 72. NTPC LTD: KEY EXECUTIVES
- TABLE 73. NTPC LTD: COMPANY SNAPSHOT
- TABLE 74. NTPC LTD: PRODUCT SEGMENTS
- TABLE 75. NTPC LTD: PRODUCT PORTFOLIO
- TABLE 76. KOREA ELECTRIC POWER CORPORATION KEPCO: KEY EXECUTIVES
- TABLE 77. KOREA ELECTRIC POWER CORPORATION KEPCO: COMPANY SNAPSHOT
- TABLE 78. KOREA ELECTRIC POWER CORPORATION KEPCO: PRODUCT SEGMENTS
- TABLE 79. KOREA ELECTRIC POWER CORPORATION KEPCO: SERVICE SEGMENTS
- TABLE 80. KOREA ELECTRIC POWER CORPORATION KEPCO: PRODUCT PORTFOLIO
- TABLE 81. JINDAL INDIA THERMAL POWER LIMITED: KEY EXECUTIVES
- TABLE 82. JINDAL INDIA THERMAL POWER LIMITED: COMPANY SNAPSHOT
- TABLE 83. JINDAL INDIA THERMAL POWER LIMITED: PRODUCT SEGMENTS
- TABLE 84. JINDAL INDIA THERMAL POWER LIMITED: PRODUCT PORTFOLIO
- TABLE 85. UNIPER SE.: KEY EXECUTIVES
- TABLE 86. UNIPER SE.: COMPANY SNAPSHOT
- TABLE 87. UNIPER SE.: PRODUCT SEGMENTS
- TABLE 88. UNIPER SE.: PRODUCT PORTFOLIO
- TABLE 89. CHINA SHENHUA ENERGY COMPANY LIMITED: KEY EXECUTIVES
- TABLE 90. CHINA SHENHUA ENERGY COMPANY LIMITED: COMPANY SNAPSHOT
- TABLE 91. CHINA SHENHUA ENERGY COMPANY LIMITED: PRODUCT SEGMENTS
- TABLE 92. CHINA SHENHUA ENERGY COMPANY LIMITED: PRODUCT PORTFOLIO
- TABLE 93. SAUDI ELECTRICITY COMPANY: KEY EXECUTIVES
- TABLE 94. SAUDI ELECTRICITY COMPANY: COMPANY SNAPSHOT
- TABLE 95. SAUDI ELECTRICITY COMPANY: SERVICE SEGMENTS
- TABLE 96. SAUDI ELECTRICITY COMPANY: PRODUCT PORTFOLIO
- TABLE 97. CHINA HUANENG GROUP CO., LTD.: KEY EXECUTIVES
- TABLE 98. CHINA HUANENG GROUP CO., LTD.: COMPANY SNAPSHOT
- TABLE 99. CHINA HUANENG GROUP CO., LTD.: PRODUCT SEGMENTS
- TABLE 100. CHINA HUANENG GROUP CO., LTD.: PRODUCT PORTFOLIO
- TABLE 101. AMERICAN ELECTRIC POWER COMPANY, INC.: KEY EXECUTIVES
- TABLE 102. AMERICAN ELECTRIC POWER COMPANY, INC.: COMPANY SNAPSHOT
- TABLE 103. AMERICAN ELECTRIC POWER COMPANY, INC.: PRODUCT SEGMENTS
- TABLE 104. AMERICAN ELECTRIC POWER COMPANY, INC.: PRODUCT PORTFOLIO
- TABLE 105. DUKE ENERGY CORPORATION: KEY EXECUTIVES
- TABLE 106. DUKE ENERGY CORPORATION: COMPANY SNAPSHOT
- TABLE 107. DUKE ENERGY CORPORATION: PRODUCT SEGMENTS
- TABLE 108. DUKE ENERGY CORPORATION: PRODUCT PORTFOLIO
LIST OF FIGURES
- FIGURE 01. COAL POWER GENERATION MARKET, 2022-2032
- FIGURE 02. SEGMENTATION OF COAL POWER GENERATION MARKET, 2022-2032
- FIGURE 03. TOP INVESTMENT POCKETS IN COAL POWER GENERATION MARKET (2023-2032)
- FIGURE 04. LOW BARGAINING POWER OF SUPPLIERS
- FIGURE 05. LOW THREAT OF NEW ENTRANTS
- FIGURE 06. LOW THREAT OF SUBSTITUTES
- FIGURE 07. LOW INTENSITY OF RIVALRY
- FIGURE 08. LOW BARGAINING POWER OF BUYERS
- FIGURE 09. DRIVERS, RESTRAINTS AND OPPORTUNITIES: GLOBALCOAL POWER GENERATION MARKET
- FIGURE 10. PRICING ANALYSIS: COAL POWER GENERATION MARKET 2022 AND 2032
- FIGURE 11. PATENT ANALYSIS BY COMPANY
- FIGURE 12. PATENT ANALYSIS BY COUNTRY
- FIGURE 12. COAL POWER GENERATION MARKET, BY TECHNOLOGY, 2022(%)
- FIGURE 13. COMPARATIVE SHARE ANALYSIS OF COAL POWER GENERATION MARKET FOR PULVERIZED, BY COUNTRY 2022 AND 2032(%)
- FIGURE 14. COMPARATIVE SHARE ANALYSIS OF COAL POWER GENERATION MARKET FOR CYCLONE FURNACES, BY COUNTRY 2022 AND 2032(%)
- FIGURE 15. COMPARATIVE SHARE ANALYSIS OF COAL POWER GENERATION MARKET FOR OTHERS, BY COUNTRY 2022 AND 2032(%)
- FIGURE 16. COAL POWER GENERATION MARKET, BY APPLICATION, 2022(%)
- FIGURE 17. COMPARATIVE SHARE ANALYSIS OF COAL POWER GENERATION MARKET FOR RESIDENTIAL, BY COUNTRY 2022 AND 2032(%)
- FIGURE 18. COMPARATIVE SHARE ANALYSIS OF COAL POWER GENERATION MARKET FOR COMMERCIAL, BY COUNTRY 2022 AND 2032(%)
- FIGURE 19. COMPARATIVE SHARE ANALYSIS OF COAL POWER GENERATION MARKET FOR INDUSTRIAL, BY COUNTRY 2022 AND 2032(%)
- FIGURE 20. COAL POWER GENERATION MARKET BY REGION, 2022
- FIGURE 21. U.S. COAL POWER GENERATION MARKET, 2022-2032 ($MILLION)
- FIGURE 22. CANADA COAL POWER GENERATION MARKET, 2022-2032 ($MILLION)
- FIGURE 23. MEXICO COAL POWER GENERATION MARKET, 2022-2032 ($MILLION)
- FIGURE 24. GERMANY COAL POWER GENERATION MARKET, 2022-2032 ($MILLION)
- FIGURE 25. UK COAL POWER GENERATION MARKET, 2022-2032 ($MILLION)
- FIGURE 26. FRANCE COAL POWER GENERATION MARKET, 2022-2032 ($MILLION)
- FIGURE 27. ITALY COAL POWER GENERATION MARKET, 2022-2032 ($MILLION)
- FIGURE 28. SPAIN COAL POWER GENERATION MARKET, 2022-2032 ($MILLION)
- FIGURE 29. REST OF EUROPE COAL POWER GENERATION MARKET, 2022-2032 ($MILLION)
- FIGURE 30. CHINA COAL POWER GENERATION MARKET, 2022-2032 ($MILLION)
- FIGURE 31. JAPAN COAL POWER GENERATION MARKET, 2022-2032 ($MILLION)
- FIGURE 32. INDIA COAL POWER GENERATION MARKET, 2022-2032 ($MILLION)
- FIGURE 33. SOUTH KOREA COAL POWER GENERATION MARKET, 2022-2032 ($MILLION)
- FIGURE 34. AUSTRALIA COAL POWER GENERATION MARKET, 2022-2032 ($MILLION)
- FIGURE 35. REST OF ASIA-PACIFIC COAL POWER GENERATION MARKET, 2022-2032 ($MILLION)
- FIGURE 36. BRAZIL COAL POWER GENERATION MARKET, 2022-2032 ($MILLION)
- FIGURE 37. UNITED ARAB EMIRATES COAL POWER GENERATION MARKET, 2022-2032 ($MILLION)
- FIGURE 38. SOUTH AFRICA COAL POWER GENERATION MARKET, 2022-2032 ($MILLION)
- FIGURE 39. REST OF LAMEA COAL POWER GENERATION MARKET, 2022-2032 ($MILLION)
- FIGURE 40. TOP WINNING STRATEGIES, BY YEAR
- FIGURE 41. TOP WINNING STRATEGIES, BY DEVELOPMENT
- FIGURE 42. TOP WINNING STRATEGIES, BY COMPANY
- FIGURE 43. PRODUCT MAPPING OF TOP 10 PLAYERS
- FIGURE 44. COMPETITIVE DASHBOARD
- FIGURE 45. COMPETITIVE HEATMAP: COAL POWER GENERATION MARKET
- FIGURE 46. TOP PLAYER POSITIONING, 2022
- FIGURE 47. ADANI POWER LTD: NET REVENUE, 2020-2022 ($MILLION)
- FIGURE 48. ADANI POWER LTD: REVENUE SHARE BY SEGMENT, 2022 (%)
- FIGURE 49. DOMINION ENERGY, INC.: NET REVENUE, 2020-2022 ($MILLION)
- FIGURE 50. DOMINION ENERGY, INC.: REVENUE SHARE BY SEGMENT, 2022 (%)
- FIGURE 51. NTPC LTD: NET REVENUE, 2020-2022 ($MILLION)
- FIGURE 52. NTPC LTD: REVENUE SHARE BY SEGMENT, 2022 (%)
- FIGURE 53. NTPC LTD: REVENUE SHARE BY REGION, 2022 (%)
- FIGURE 54. KOREA ELECTRIC POWER CORPORATION KEPCO: NET REVENUE, 2020-2022 ($MILLION)
- FIGURE 55. KOREA ELECTRIC POWER CORPORATION KEPCO: REVENUE SHARE BY SEGMENT, 2022 (%)
- FIGURE 56. KOREA ELECTRIC POWER CORPORATION KEPCO: REVENUE SHARE BY REGION, 2022 (%)
- FIGURE 57. UNIPER SE.: NET REVENUE, 2020-2022 ($MILLION)
- FIGURE 58. UNIPER SE.: REVENUE SHARE BY SEGMENT, 2022 (%)
- FIGURE 59. UNIPER SE.: REVENUE SHARE BY REGION, 2022 (%)
- FIGURE 60. CHINA SHENHUA ENERGY COMPANY LIMITED: NET REVENUE, 2020-2022 ($MILLION)
- FIGURE 61. CHINA SHENHUA ENERGY COMPANY LIMITED: REVENUE SHARE BY SEGMENT, 2022 (%)
- FIGURE 62. CHINA SHENHUA ENERGY COMPANY LIMITED: REVENUE SHARE BY REGION, 2022 (%)
- FIGURE 63. SAUDI ELECTRICITY COMPANY: NET REVENUE, 2020-2022 ($MILLION)
- FIGURE 64. SAUDI ELECTRICITY COMPANY: REVENUE SHARE BY SEGMENT, 2022 (%)
- FIGURE 65. AMERICAN ELECTRIC POWER COMPANY, INC.: NET REVENUE, 2020-2022 ($MILLION)
- FIGURE 66. AMERICAN ELECTRIC POWER COMPANY, INC.: REVENUE SHARE BY SEGMENT, 2022 (%)
- FIGURE 67. DUKE ENERGY CORPORATION: NET REVENUE, 2020-2022 ($MILLION)
- FIGURE 68. DUKE ENERGY CORPORATION: REVENUE SHARE BY SEGMENT, 2022 (%)
 燃煤發電市場:2023-2028 年全球產業趨勢、佔有率、規模、成長、機會與預測
 MISO對煤炭投擲一條短救生索,反之亦然
 煤炭火力發電的全球市場:各技術,各應用領域,各地區-規模,佔有率,展望,機會分析(2022年~2028年)