


 |
市場調查報告書
商品編碼
1344333
神經介入設備市場:按產品、適應症和應用分類:2023-2032 年全球機會分析和產業預測Neurointerventional Devices Market By Product, By Indication, By Application : Global Opportunity Analysis and Industry Forecast, 2023-2032 |
||||||
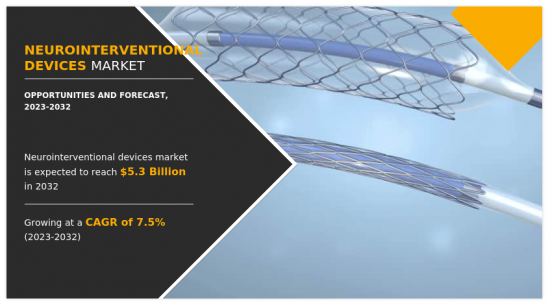
2022 年神經介入設備市場估值為 26 億美元,預計 2023 年至 2032 年複合年增長率為 7.5%,到 2032 年達到 53 億美元。Masu。
神經介入設備是用於神經介入放射治療領域的一類專業醫療設備。 這些設備專門用於診斷和治療影響大腦和脊髓血管的各種神經系統疾病。 介入性神經手術採用微創技術,使用導管、電線、支架和其他裝置來進入和治療受影響的區域。 神經介入設備在缺血性中風、出血性中風、腦動脈瘤、動靜脈畸形和其他中樞神經系統血管異常等疾病的治療中發揮重要作用。 與傳統開放性手術相比,這些設備實現了風險更低、恢復時間更快的微創治療,徹底改變了神經介入放射學領域。
神經介入器材在神經血管疾病的診斷和治療中發揮重要作用。 例如,腦血管攝影使用導管和成像系統來可視化血管並檢測異常情況。 栓塞線圈和分流器透過促進血液凝固和改變血流方向來幫助治療動脈瘤。 因此,神經系統疾病的日益普及增加了對神經介入手術和設備的需求,推動了市場成長。 此外,對微創手術的日益青睞正在推動神經介入設備市場的成長。 與傳統開放性手術相比,微創手術具有多種優勢,包括侵入性更小、住院時間更短、恢復更快、準確性和結果更高、併發症風險更低,徹底改變了神經介入領域。 由於微創手術風險較低、恢復較快等優點,患者對微創手術的偏好正迅速增加。
美國國家醫學圖書館 2020 年進行的一項研究報告稱,在過去 16 年裡,患者對微創治療的偏好增加了 36%。 微創治療透過小切口進入受影響區域,通常由螢光鏡或血管攝影等影像技術引導。 神經介入設備使醫生能夠導航複雜的血管並提供精確的治療。 對診斷為中風的患者進行的血栓切除術使用導管、導絲和氣球來幫助清除大腦中的血栓。
目錄
第一章簡介
第 2 章執行摘要
第三章市場概述
- 市場定義和範圍
- 主要發現
- 影響因素
- 主要投資機會
- 波特五力分析
- 供應商議價能力低
- 新進入者的威脅較低
- 替代品威脅低
- 競爭強度低
- 買方的議價能力較低
- 市場動態
- 促進因素
- 神經系統疾病盛行率激增
- 提高對神經系統疾病的認識
- 對微創手術的需求不斷增加
- 抑制因素
- 神經介入設備價格高
- 機會
- 神經介入設備的技術進步
- 促進因素
- 新冠肺炎 (COVID-19) 市場影響分析
第 4 章神經介入設備市場:依產品
- 摘要
- 支架
- 栓塞線圈
- 導管
- 電線
- 其他
第五章神經介入器材市場:依適應症劃分
- 摘要
- 腦動脈瘤
- 中風
- 其他
第 6 章神經介入設備市場:依應用分類
- 摘要
- 醫院
- 門診手術中心
- 其他
第七章神經介入設備市場:按地區
- 摘要
- 北美
- 美國
- 加拿大
- 墨西哥
- 歐洲
- 德國
- 法國
- 英國
- 義大利
- 西班牙
- 歐洲其他地區
- 亞太地區
- 日本
- 中國
- 澳大利亞
- 印度
- 韓國
- 其他亞太地區
- 拉丁美洲/中東/非洲
- 巴西
- 沙烏地阿拉伯
- 南非
- 其他領域
第八章競爭態勢
- 簡介
- 關鍵成功策略
- 10家主要公司的產品圖譜
- 競爭對手儀表板
- 競爭熱圖
- 2022 年主要公司的定位
第九章公司簡介
- Stryker Corporation.
- Johnson & Johnson
- Medtronic plc
- Terumo Corporation
- Integer Holdings Corporation
- Lepu Medical Technology(Beijing)Co., Ltd
- Balt Group
- Merit Medical Systems Inc.
- Cook Group Inc
- Penumbra, Inc
According to a new report published by Allied Market Research, titled, "Neurointerventional Devices Market," The neurointerventional devices market was valued at $2.6 billion in 2022, and is estimated to reach $5.3 billion by 2032, growing at a CAGR of 7.5% from 2023 to 2032. Neurointerventional devices are a specialized category of medical devices used in the field of neurointerventional radiology. These devices are designed to diagnose and treat various neurological conditions, particularly those affecting the blood vessels of the brain and spinal cord. Neurointerventional procedures involve minimally invasive techniques that utilize catheters, wires, stents, and other devices to access and treat the affected area. Neurointerventional devices play a crucial role in the management of conditions such as ischemic stroke, hemorrhagic stroke, brain aneurysms, AVMs, and other vascular abnormalities of the central nervous system. These devices have revolutionized the field of neurointerventional radiology by enabling minimally invasive treatments with reduced risks and faster recovery times compared to traditional open surgeries
Neurointerventional devices play a crucial role in the diagnosis and treatment of neurovascular conditions. For example, catheters and imaging systems are used during cerebral angiography to visualize blood vessels and detect abnormalities. Embolic coils and flow diverters help to treat aneurysms by promoting clotting or redirecting blood flow. Thus, rise in incidence of neurological disorders surge the demand for neurointerventional procedures and devices and propel the growth of the market. Furthermore, increase in preference towards minimally invasive procedures is shaping the growth of the neurointerventional devices market. Minimally invasive procedures have revolutionized the field of neurointerventional by offering several advantages over traditional open surgeries such as reduced invasiveness, shorter hospital stays, faster recovery, improved precision and outcomes, and lower risk of complications. Due to the advantage such as lower risk and faster recovery, there has been a spike in patient preference towards the minimally invasive procedures.
A study performed by the National Library of Medicine, in 2020, reported that the preference of patients toward minimally invasive treatments raised by 36% over the last 16 years. Minimally invasive procedures involve accessing the affected area through small incisions, often guided by imaging techniques such as fluoroscopy or angiography. Neurointerventional devices enable physicians to navigate complex blood vessels and deliver treatments precisely. Catheters, guidewires, and balloons are used in thrombectomy procedure in patient diagnosed with stroke, which helps to remove the blood clots in brain.
In addition, stents and flow diverters are also used to help restore blood flow in blocked or weakened vessels. Thus, the minimally invasive procedures have emerged as more efficient in terms of faster recovery of patient, lower risk management, and improved precision and outcomes, as compared to the traditional surgical methods, leading to high adoption of minimally invasive procedures by patients and healthcare professionals, resulting in the growth of the neurointerventional devices market.
In addition, rise in awareness of neurological disorders has emerged as a significant driver for the neurointerventional devices market. Neurological disorders encompass a range of conditions affecting the brain, spinal cord, and peripheral nervous system. Over recent years, rise in incidence of neurological disorders, advancements in diagnostic techniques, media coverage and advocacy efforts to spread awareness about the neurological disorders, and government initiatives towards treatment support of neurological disorders have led to increase in public awareness of these disorders.
For instance, The National Policy for Rare Diseases scheme, by government of India, has provision for financial support of up to Rs. 50 lakhs to the patients suffering from any category of the rare diseases and for treatment in the Centre of Excellence (CoE) mentioned in NPRD-2021. Moreover, rise in sedentary lifestyles, unhealthy diets, environmental factors, and aging population, further lead to various neurological disorder and boost the growth of the market. Conditions such as stroke, cerebral aneurysms, and arteriovenous malformations can have severe consequences if not diagnosed and treated promptly. Thus, the need for neurointerventional procedure increase the demand for neurointerventional device and propel the growth of the market. However, the high cost of neurointerventional devices is expected to restrain the growth of the market. Technological advancements such as robotics and integration of artificial intelligence (AI) in neurointerventional devices offer lucrative growth opportunity for the neurointerventional devices market.
The neurointerventional devices market is segmented on the basis of product, indication, end user, and region. By product type, the market is categorized into catheter, wires, stents, embolic coils, and others. The others include embolic protection device, and long sheath. By indication, the market is categorized into brain aneurysm, stroke, vascular malformations, and others. The others include vascular malformations, arteriovenous fistula, and arteriovenous malformation (AVM).
By end user, the market is categorized into hospitals and ambulatory surgical center. Region-wise, the market is analyzed across North America (the U.S., Canada, and Mexico), Europe (Germany, France, the UK, Italy, Spain, and rest of Europe), Asia-Pacific (Japan, China, Australia, India, South Korea, and rest of Asia-Pacific), and LAMEA (Brazil, South Africa, Saudi Arabia, and rest of LAMEA). Major key players that operate in the global neurointerventional devices market are Stryker Corporation, Johnson & Johnson, Medtronic plc, Terumo Corporation, Lepu Medical Technology (Beijing) Co., Ltd, Merit Medical Systems Inc, Balt Group, Integer Holdings Corporation, Penumbra, Inc., and Cook Group Inc.
Key Benefits For Stakeholders
- This report provides a quantitative analysis of the market segments, current trends, estimations, and dynamics of the neurointerventional devices market analysis from 2022 to 2032 to identify the prevailing neurointerventional devices market opportunities.
- The market research is offered along with information related to key drivers, restraints, and opportunities.
- Porter's five forces analysis highlights the potency of buyers and suppliers to enable stakeholders make profit-oriented business decisions and strengthen their supplier-buyer network.
- In-depth analysis of the neurointerventional devices market segmentation assists to determine the prevailing market opportunities.
- Major countries in each region are mapped according to their revenue contribution to the global market.
- Market player positioning facilitates benchmarking and provides a clear understanding of the present position of the market players.
- The report includes the analysis of the regional as well as global neurointerventional devices market trends, key players, market segments, application areas, and market growth strategies.
Key Market Segments
By Product
- Stents
- Embolic Coils
- Catheter
- Wires
- Others
By Indication
- Brain Aneurysm
- Stroke
- Others
By Application
- Hospitals
- Ambulatory Surgical Centers
- Others
By Region
- North America
- U.S.
- Canada
- Mexico
- Europe
- Germany
- France
- UK
- Italy
- Spain
- Rest of Europe
- Asia-Pacific
- Japan
- China
- Australia
- India
- South Korea
- Rest of Asia-Pacific
- LAMEA
- Brazil
- Saudi Arabia
- South Africa
- Rest of LAMEA
Key Market Players:
- Balt Group
- Cook Group Inc
- Integer Holdings Corporation
- Johnson & Johnson
- Lepu Medical Technology (Beijing) Co., Ltd
- Medtronic plc
- Merit Medical Systems Inc.
- Penumbra, Inc
- Stryker Corporation.
- Terumo Corporation
TABLE OF CONTENTS
CHAPTER 1: INTRODUCTION
- 1.1. Report description
- 1.2. Key market segments
- 1.3. Key benefits to the stakeholders
- 1.4. Research Methodology
- 1.4.1. Primary research
- 1.4.2. Secondary research
- 1.4.3. Analyst tools and models
CHAPTER 2: EXECUTIVE SUMMARY
- 2.1. CXO Perspective
CHAPTER 3: MARKET OVERVIEW
- 3.1. Market definition and scope
- 3.2. Key findings
- 3.2.1. Top impacting factors
- 3.2.2. Top investment pockets
- 3.3. Porter's five forces analysis
- 3.3.1. Low bargaining power of suppliers
- 3.3.2. Low threat of new entrants
- 3.3.3. Low threat of substitutes
- 3.3.4. Low intensity of rivalry
- 3.3.5. Low bargaining power of buyers
- 3.4. Market dynamics
- 3.4.1. Drivers
- 3.4.1.1. Surge in prevalence of neurological disorders
- 3.4.1.2. Rise in awareness about neurological disorders
- 3.4.1.3. Rise in demand for minimal invasive procedures
- 3.4.1. Drivers
- 3.4.2. Restraints
- 3.4.2.1. High cost of neurointerventional devices
- 3.4.3. Opportunities
- 3.4.3.1. Technological advancement in neurointerventional devices
- 3.5. COVID-19 Impact Analysis on the market
CHAPTER 4: NEUROINTERVENTIONAL DEVICES MARKET, BY PRODUCT
- 4.1. Overview
- 4.1.1. Market size and forecast
- 4.2. Stents
- 4.2.1. Key market trends, growth factors and opportunities
- 4.2.2. Market size and forecast, by region
- 4.2.3. Market share analysis by country
- 4.3. Embolic Coils
- 4.3.1. Key market trends, growth factors and opportunities
- 4.3.2. Market size and forecast, by region
- 4.3.3. Market share analysis by country
- 4.4. Catheter
- 4.4.1. Key market trends, growth factors and opportunities
- 4.4.2. Market size and forecast, by region
- 4.4.3. Market share analysis by country
- 4.5. Wires
- 4.5.1. Key market trends, growth factors and opportunities
- 4.5.2. Market size and forecast, by region
- 4.5.3. Market share analysis by country
- 4.6. Others
- 4.6.1. Key market trends, growth factors and opportunities
- 4.6.2. Market size and forecast, by region
- 4.6.3. Market share analysis by country
CHAPTER 5: NEUROINTERVENTIONAL DEVICES MARKET, BY INDICATION
- 5.1. Overview
- 5.1.1. Market size and forecast
- 5.2. Brain Aneurysm
- 5.2.1. Key market trends, growth factors and opportunities
- 5.2.2. Market size and forecast, by region
- 5.2.3. Market share analysis by country
- 5.3. Stroke
- 5.3.1. Key market trends, growth factors and opportunities
- 5.3.2. Market size and forecast, by region
- 5.3.3. Market share analysis by country
- 5.4. Others
- 5.4.1. Key market trends, growth factors and opportunities
- 5.4.2. Market size and forecast, by region
- 5.4.3. Market share analysis by country
CHAPTER 6: NEUROINTERVENTIONAL DEVICES MARKET, BY APPLICATION
- 6.1. Overview
- 6.1.1. Market size and forecast
- 6.2. Hospitals
- 6.2.1. Key market trends, growth factors and opportunities
- 6.2.2. Market size and forecast, by region
- 6.2.3. Market share analysis by country
- 6.3. Ambulatory Surgical Centers
- 6.3.1. Key market trends, growth factors and opportunities
- 6.3.2. Market size and forecast, by region
- 6.3.3. Market share analysis by country
- 6.4. Others
- 6.4.1. Key market trends, growth factors and opportunities
- 6.4.2. Market size and forecast, by region
- 6.4.3. Market share analysis by country
CHAPTER 7: NEUROINTERVENTIONAL DEVICES MARKET, BY REGION
- 7.1. Overview
- 7.1.1. Market size and forecast By Region
- 7.2. North America
- 7.2.1. Key trends and opportunities
- 7.2.2. Market size and forecast, by Product
- 7.2.3. Market size and forecast, by Indication
- 7.2.4. Market size and forecast, by Application
- 7.2.5. Market size and forecast, by country
- 7.2.5.1. U.S.
- 7.2.5.1.1. Key market trends, growth factors and opportunities
- 7.2.5.1.2. Market size and forecast, by Product
- 7.2.5.1.3. Market size and forecast, by Indication
- 7.2.5.1.4. Market size and forecast, by Application
- 7.2.5.2. Canada
- 7.2.5.2.1. Key market trends, growth factors and opportunities
- 7.2.5.2.2. Market size and forecast, by Product
- 7.2.5.2.3. Market size and forecast, by Indication
- 7.2.5.2.4. Market size and forecast, by Application
- 7.2.5.3. Mexico
- 7.2.5.3.1. Key market trends, growth factors and opportunities
- 7.2.5.3.2. Market size and forecast, by Product
- 7.2.5.3.3. Market size and forecast, by Indication
- 7.2.5.3.4. Market size and forecast, by Application
- 7.3. Europe
- 7.3.1. Key trends and opportunities
- 7.3.2. Market size and forecast, by Product
- 7.3.3. Market size and forecast, by Indication
- 7.3.4. Market size and forecast, by Application
- 7.3.5. Market size and forecast, by country
- 7.3.5.1. Germany
- 7.3.5.1.1. Key market trends, growth factors and opportunities
- 7.3.5.1.2. Market size and forecast, by Product
- 7.3.5.1.3. Market size and forecast, by Indication
- 7.3.5.1.4. Market size and forecast, by Application
- 7.3.5.2. France
- 7.3.5.2.1. Key market trends, growth factors and opportunities
- 7.3.5.2.2. Market size and forecast, by Product
- 7.3.5.2.3. Market size and forecast, by Indication
- 7.3.5.2.4. Market size and forecast, by Application
- 7.3.5.3. UK
- 7.3.5.3.1. Key market trends, growth factors and opportunities
- 7.3.5.3.2. Market size and forecast, by Product
- 7.3.5.3.3. Market size and forecast, by Indication
- 7.3.5.3.4. Market size and forecast, by Application
- 7.3.5.4. Italy
- 7.3.5.4.1. Key market trends, growth factors and opportunities
- 7.3.5.4.2. Market size and forecast, by Product
- 7.3.5.4.3. Market size and forecast, by Indication
- 7.3.5.4.4. Market size and forecast, by Application
- 7.3.5.5. Spain
- 7.3.5.5.1. Key market trends, growth factors and opportunities
- 7.3.5.5.2. Market size and forecast, by Product
- 7.3.5.5.3. Market size and forecast, by Indication
- 7.3.5.5.4. Market size and forecast, by Application
- 7.3.5.6. Rest of Europe
- 7.3.5.6.1. Key market trends, growth factors and opportunities
- 7.3.5.6.2. Market size and forecast, by Product
- 7.3.5.6.3. Market size and forecast, by Indication
- 7.3.5.6.4. Market size and forecast, by Application
- 7.4. Asia-Pacific
- 7.4.1. Key trends and opportunities
- 7.4.2. Market size and forecast, by Product
- 7.4.3. Market size and forecast, by Indication
- 7.4.4. Market size and forecast, by Application
- 7.4.5. Market size and forecast, by country
- 7.4.5.1. Japan
- 7.4.5.1.1. Key market trends, growth factors and opportunities
- 7.4.5.1.2. Market size and forecast, by Product
- 7.4.5.1.3. Market size and forecast, by Indication
- 7.4.5.1.4. Market size and forecast, by Application
- 7.4.5.2. China
- 7.4.5.2.1. Key market trends, growth factors and opportunities
- 7.4.5.2.2. Market size and forecast, by Product
- 7.4.5.2.3. Market size and forecast, by Indication
- 7.4.5.2.4. Market size and forecast, by Application
- 7.4.5.3. Australia
- 7.4.5.3.1. Key market trends, growth factors and opportunities
- 7.4.5.3.2. Market size and forecast, by Product
- 7.4.5.3.3. Market size and forecast, by Indication
- 7.4.5.3.4. Market size and forecast, by Application
- 7.4.5.4. India
- 7.4.5.4.1. Key market trends, growth factors and opportunities
- 7.4.5.4.2. Market size and forecast, by Product
- 7.4.5.4.3. Market size and forecast, by Indication
- 7.4.5.4.4. Market size and forecast, by Application
- 7.4.5.5. South Korea
- 7.4.5.5.1. Key market trends, growth factors and opportunities
- 7.4.5.5.2. Market size and forecast, by Product
- 7.4.5.5.3. Market size and forecast, by Indication
- 7.4.5.5.4. Market size and forecast, by Application
- 7.4.5.6. Rest of Asia-Pacific
- 7.4.5.6.1. Key market trends, growth factors and opportunities
- 7.4.5.6.2. Market size and forecast, by Product
- 7.4.5.6.3. Market size and forecast, by Indication
- 7.4.5.6.4. Market size and forecast, by Application
- 7.5. LAMEA
- 7.5.1. Key trends and opportunities
- 7.5.2. Market size and forecast, by Product
- 7.5.3. Market size and forecast, by Indication
- 7.5.4. Market size and forecast, by Application
- 7.5.5. Market size and forecast, by country
- 7.5.5.1. Brazil
- 7.5.5.1.1. Key market trends, growth factors and opportunities
- 7.5.5.1.2. Market size and forecast, by Product
- 7.5.5.1.3. Market size and forecast, by Indication
- 7.5.5.1.4. Market size and forecast, by Application
- 7.5.5.2. Saudi Arabia
- 7.5.5.2.1. Key market trends, growth factors and opportunities
- 7.5.5.2.2. Market size and forecast, by Product
- 7.5.5.2.3. Market size and forecast, by Indication
- 7.5.5.2.4. Market size and forecast, by Application
- 7.5.5.3. South Africa
- 7.5.5.3.1. Key market trends, growth factors and opportunities
- 7.5.5.3.2. Market size and forecast, by Product
- 7.5.5.3.3. Market size and forecast, by Indication
- 7.5.5.3.4. Market size and forecast, by Application
- 7.5.5.4. Rest of LAMEA
- 7.5.5.4.1. Key market trends, growth factors and opportunities
- 7.5.5.4.2. Market size and forecast, by Product
- 7.5.5.4.3. Market size and forecast, by Indication
- 7.5.5.4.4. Market size and forecast, by Application
CHAPTER 8: COMPETITIVE LANDSCAPE
- 8.1. Introduction
- 8.2. Top winning strategies
- 8.3. Product Mapping of Top 10 Player
- 8.4. Competitive Dashboard
- 8.5. Competitive Heatmap
- 8.6. Top player positioning, 2022
CHAPTER 9: COMPANY PROFILES
- 9.1. Stryker Corporation.
- 9.1.1. Company overview
- 9.1.2. Key Executives
- 9.1.3. Company snapshot
- 9.1.4. Operating business segments
- 9.1.5. Product portfolio
- 9.1.6. Business performance
- 9.1.7. Key strategic moves and developments
- 9.2. Johnson & Johnson
- 9.2.1. Company overview
- 9.2.2. Key Executives
- 9.2.3. Company snapshot
- 9.2.4. Operating business segments
- 9.2.5. Product portfolio
- 9.2.6. Business performance
- 9.2.7. Key strategic moves and developments
- 9.3. Medtronic plc
- 9.3.1. Company overview
- 9.3.2. Key Executives
- 9.3.3. Company snapshot
- 9.3.4. Operating business segments
- 9.3.5. Product portfolio
- 9.3.6. Business performance
- 9.4. Terumo Corporation
- 9.4.1. Company overview
- 9.4.2. Key Executives
- 9.4.3. Company snapshot
- 9.4.4. Operating business segments
- 9.4.5. Product portfolio
- 9.4.6. Business performance
- 9.4.7. Key strategic moves and developments
- 9.5. Integer Holdings Corporation
- 9.5.1. Company overview
- 9.5.2. Key Executives
- 9.5.3. Company snapshot
- 9.5.4. Operating business segments
- 9.5.5. Product portfolio
- 9.5.6. Business performance
- 9.5.7. Key strategic moves and developments
- 9.6. Lepu Medical Technology (Beijing) Co., Ltd
- 9.6.1. Company overview
- 9.6.2. Key Executives
- 9.6.3. Company snapshot
- 9.6.4. Operating business segments
- 9.6.5. Product portfolio
- 9.6.6. Business performance
- 9.7. Balt Group
- 9.7.1. Company overview
- 9.7.2. Key Executives
- 9.7.3. Company snapshot
- 9.7.4. Operating business segments
- 9.7.5. Product portfolio
- 9.8. Merit Medical Systems Inc.
- 9.8.1. Company overview
- 9.8.2. Key Executives
- 9.8.3. Company snapshot
- 9.8.4. Operating business segments
- 9.8.5. Product portfolio
- 9.8.6. Business performance
- 9.9. Cook Group Inc
- 9.9.1. Company overview
- 9.9.2. Key Executives
- 9.9.3. Company snapshot
- 9.9.4. Operating business segments
- 9.9.5. Product portfolio
- 9.10. Penumbra, Inc
- 9.10.1. Company overview
- 9.10.2. Key Executives
- 9.10.3. Company snapshot
- 9.10.4. Operating business segments
- 9.10.5. Product portfolio
- 9.10.6. Business performance
LIST OF TABLES
- TABLE 01. GLOBAL NEUROINTERVENTIONAL DEVICES MARKET, BY PRODUCT, 2022-2032 ($MILLION)
- TABLE 02. NEUROINTERVENTIONAL DEVICES MARKET FOR STENTS, BY REGION, 2022-2032 ($MILLION)
- TABLE 03. NEUROINTERVENTIONAL DEVICES MARKET FOR EMBOLIC COILS, BY REGION, 2022-2032 ($MILLION)
- TABLE 04. NEUROINTERVENTIONAL DEVICES MARKET FOR CATHETER, BY REGION, 2022-2032 ($MILLION)
- TABLE 05. NEUROINTERVENTIONAL DEVICES MARKET FOR WIRES, BY REGION, 2022-2032 ($MILLION)
- TABLE 06. NEUROINTERVENTIONAL DEVICES MARKET FOR OTHERS, BY REGION, 2022-2032 ($MILLION)
- TABLE 07. GLOBAL NEUROINTERVENTIONAL DEVICES MARKET, BY INDICATION, 2022-2032 ($MILLION)
- TABLE 08. NEUROINTERVENTIONAL DEVICES MARKET FOR BRAIN ANEURYSM, BY REGION, 2022-2032 ($MILLION)
- TABLE 09. NEUROINTERVENTIONAL DEVICES MARKET FOR STROKE, BY REGION, 2022-2032 ($MILLION)
- TABLE 10. NEUROINTERVENTIONAL DEVICES MARKET FOR OTHERS, BY REGION, 2022-2032 ($MILLION)
- TABLE 11. GLOBAL NEUROINTERVENTIONAL DEVICES MARKET, BY APPLICATION, 2022-2032 ($MILLION)
- TABLE 12. NEUROINTERVENTIONAL DEVICES MARKET FOR HOSPITALS, BY REGION, 2022-2032 ($MILLION)
- TABLE 13. NEUROINTERVENTIONAL DEVICES MARKET FOR AMBULATORY SURGICAL CENTERS, BY REGION, 2022-2032 ($MILLION)
- TABLE 14. NEUROINTERVENTIONAL DEVICES MARKET FOR OTHERS, BY REGION, 2022-2032 ($MILLION)
- TABLE 15. NEUROINTERVENTIONAL DEVICES MARKET, BY REGION, 2022-2032 ($MILLION)
- TABLE 16. NORTH AMERICA NEUROINTERVENTIONAL DEVICES MARKET, BY PRODUCT, 2022-2032 ($MILLION)
- TABLE 17. NORTH AMERICA NEUROINTERVENTIONAL DEVICES MARKET, BY INDICATION, 2022-2032 ($MILLION)
- TABLE 18. NORTH AMERICA NEUROINTERVENTIONAL DEVICES MARKET, BY APPLICATION, 2022-2032 ($MILLION)
- TABLE 19. NORTH AMERICA NEUROINTERVENTIONAL DEVICES MARKET, BY COUNTRY, 2022-2032 ($MILLION)
- TABLE 20. U.S. NEUROINTERVENTIONAL DEVICES MARKET, BY PRODUCT, 2022-2032 ($MILLION)
- TABLE 21. U.S. NEUROINTERVENTIONAL DEVICES MARKET, BY INDICATION, 2022-2032 ($MILLION)
- TABLE 22. U.S. NEUROINTERVENTIONAL DEVICES MARKET, BY APPLICATION, 2022-2032 ($MILLION)
- TABLE 23. CANADA NEUROINTERVENTIONAL DEVICES MARKET, BY PRODUCT, 2022-2032 ($MILLION)
- TABLE 24. CANADA NEUROINTERVENTIONAL DEVICES MARKET, BY INDICATION, 2022-2032 ($MILLION)
- TABLE 25. CANADA NEUROINTERVENTIONAL DEVICES MARKET, BY APPLICATION, 2022-2032 ($MILLION)
- TABLE 26. MEXICO NEUROINTERVENTIONAL DEVICES MARKET, BY PRODUCT, 2022-2032 ($MILLION)
- TABLE 27. MEXICO NEUROINTERVENTIONAL DEVICES MARKET, BY INDICATION, 2022-2032 ($MILLION)
- TABLE 28. MEXICO NEUROINTERVENTIONAL DEVICES MARKET, BY APPLICATION, 2022-2032 ($MILLION)
- TABLE 29. EUROPE NEUROINTERVENTIONAL DEVICES MARKET, BY PRODUCT, 2022-2032 ($MILLION)
- TABLE 30. EUROPE NEUROINTERVENTIONAL DEVICES MARKET, BY INDICATION, 2022-2032 ($MILLION)
- TABLE 31. EUROPE NEUROINTERVENTIONAL DEVICES MARKET, BY APPLICATION, 2022-2032 ($MILLION)
- TABLE 32. EUROPE NEUROINTERVENTIONAL DEVICES MARKET, BY COUNTRY, 2022-2032 ($MILLION)
- TABLE 33. GERMANY NEUROINTERVENTIONAL DEVICES MARKET, BY PRODUCT, 2022-2032 ($MILLION)
- TABLE 34. GERMANY NEUROINTERVENTIONAL DEVICES MARKET, BY INDICATION, 2022-2032 ($MILLION)
- TABLE 35. GERMANY NEUROINTERVENTIONAL DEVICES MARKET, BY APPLICATION, 2022-2032 ($MILLION)
- TABLE 36. FRANCE NEUROINTERVENTIONAL DEVICES MARKET, BY PRODUCT, 2022-2032 ($MILLION)
- TABLE 37. FRANCE NEUROINTERVENTIONAL DEVICES MARKET, BY INDICATION, 2022-2032 ($MILLION)
- TABLE 38. FRANCE NEUROINTERVENTIONAL DEVICES MARKET, BY APPLICATION, 2022-2032 ($MILLION)
- TABLE 39. UK NEUROINTERVENTIONAL DEVICES MARKET, BY PRODUCT, 2022-2032 ($MILLION)
- TABLE 40. UK NEUROINTERVENTIONAL DEVICES MARKET, BY INDICATION, 2022-2032 ($MILLION)
- TABLE 41. UK NEUROINTERVENTIONAL DEVICES MARKET, BY APPLICATION, 2022-2032 ($MILLION)
- TABLE 42. ITALY NEUROINTERVENTIONAL DEVICES MARKET, BY PRODUCT, 2022-2032 ($MILLION)
- TABLE 43. ITALY NEUROINTERVENTIONAL DEVICES MARKET, BY INDICATION, 2022-2032 ($MILLION)
- TABLE 44. ITALY NEUROINTERVENTIONAL DEVICES MARKET, BY APPLICATION, 2022-2032 ($MILLION)
- TABLE 45. SPAIN NEUROINTERVENTIONAL DEVICES MARKET, BY PRODUCT, 2022-2032 ($MILLION)
- TABLE 46. SPAIN NEUROINTERVENTIONAL DEVICES MARKET, BY INDICATION, 2022-2032 ($MILLION)
- TABLE 47. SPAIN NEUROINTERVENTIONAL DEVICES MARKET, BY APPLICATION, 2022-2032 ($MILLION)
- TABLE 48. REST OF EUROPE NEUROINTERVENTIONAL DEVICES MARKET, BY PRODUCT, 2022-2032 ($MILLION)
- TABLE 49. REST OF EUROPE NEUROINTERVENTIONAL DEVICES MARKET, BY INDICATION, 2022-2032 ($MILLION)
- TABLE 50. REST OF EUROPE NEUROINTERVENTIONAL DEVICES MARKET, BY APPLICATION, 2022-2032 ($MILLION)
- TABLE 51. ASIA-PACIFIC NEUROINTERVENTIONAL DEVICES MARKET, BY PRODUCT, 2022-2032 ($MILLION)
- TABLE 52. ASIA-PACIFIC NEUROINTERVENTIONAL DEVICES MARKET, BY INDICATION, 2022-2032 ($MILLION)
- TABLE 53. ASIA-PACIFIC NEUROINTERVENTIONAL DEVICES MARKET, BY APPLICATION, 2022-2032 ($MILLION)
- TABLE 54. ASIA-PACIFIC NEUROINTERVENTIONAL DEVICES MARKET, BY COUNTRY, 2022-2032 ($MILLION)
- TABLE 55. JAPAN NEUROINTERVENTIONAL DEVICES MARKET, BY PRODUCT, 2022-2032 ($MILLION)
- TABLE 56. JAPAN NEUROINTERVENTIONAL DEVICES MARKET, BY INDICATION, 2022-2032 ($MILLION)
- TABLE 57. JAPAN NEUROINTERVENTIONAL DEVICES MARKET, BY APPLICATION, 2022-2032 ($MILLION)
- TABLE 58. CHINA NEUROINTERVENTIONAL DEVICES MARKET, BY PRODUCT, 2022-2032 ($MILLION)
- TABLE 59. CHINA NEUROINTERVENTIONAL DEVICES MARKET, BY INDICATION, 2022-2032 ($MILLION)
- TABLE 60. CHINA NEUROINTERVENTIONAL DEVICES MARKET, BY APPLICATION, 2022-2032 ($MILLION)
- TABLE 61. AUSTRALIA NEUROINTERVENTIONAL DEVICES MARKET, BY PRODUCT, 2022-2032 ($MILLION)
- TABLE 62. AUSTRALIA NEUROINTERVENTIONAL DEVICES MARKET, BY INDICATION, 2022-2032 ($MILLION)
- TABLE 63. AUSTRALIA NEUROINTERVENTIONAL DEVICES MARKET, BY APPLICATION, 2022-2032 ($MILLION)
- TABLE 64. INDIA NEUROINTERVENTIONAL DEVICES MARKET, BY PRODUCT, 2022-2032 ($MILLION)
- TABLE 65. INDIA NEUROINTERVENTIONAL DEVICES MARKET, BY INDICATION, 2022-2032 ($MILLION)
- TABLE 66. INDIA NEUROINTERVENTIONAL DEVICES MARKET, BY APPLICATION, 2022-2032 ($MILLION)
- TABLE 67. SOUTH KOREA NEUROINTERVENTIONAL DEVICES MARKET, BY PRODUCT, 2022-2032 ($MILLION)
- TABLE 68. SOUTH KOREA NEUROINTERVENTIONAL DEVICES MARKET, BY INDICATION, 2022-2032 ($MILLION)
- TABLE 69. SOUTH KOREA NEUROINTERVENTIONAL DEVICES MARKET, BY APPLICATION, 2022-2032 ($MILLION)
- TABLE 70. REST OF ASIA-PACIFIC NEUROINTERVENTIONAL DEVICES MARKET, BY PRODUCT, 2022-2032 ($MILLION)
- TABLE 71. REST OF ASIA-PACIFIC NEUROINTERVENTIONAL DEVICES MARKET, BY INDICATION, 2022-2032 ($MILLION)
- TABLE 72. REST OF ASIA-PACIFIC NEUROINTERVENTIONAL DEVICES MARKET, BY APPLICATION, 2022-2032 ($MILLION)
- TABLE 73. LAMEA NEUROINTERVENTIONAL DEVICES MARKET, BY PRODUCT, 2022-2032 ($MILLION)
- TABLE 74. LAMEA NEUROINTERVENTIONAL DEVICES MARKET, BY INDICATION, 2022-2032 ($MILLION)
- TABLE 75. LAMEA NEUROINTERVENTIONAL DEVICES MARKET, BY APPLICATION, 2022-2032 ($MILLION)
- TABLE 76. LAMEA NEUROINTERVENTIONAL DEVICES MARKET, BY COUNTRY, 2022-2032 ($MILLION)
- TABLE 77. BRAZIL NEUROINTERVENTIONAL DEVICES MARKET, BY PRODUCT, 2022-2032 ($MILLION)
- TABLE 78. BRAZIL NEUROINTERVENTIONAL DEVICES MARKET, BY INDICATION, 2022-2032 ($MILLION)
- TABLE 79. BRAZIL NEUROINTERVENTIONAL DEVICES MARKET, BY APPLICATION, 2022-2032 ($MILLION)
- TABLE 80. SAUDI ARABIA NEUROINTERVENTIONAL DEVICES MARKET, BY PRODUCT, 2022-2032 ($MILLION)
- TABLE 81. SAUDI ARABIA NEUROINTERVENTIONAL DEVICES MARKET, BY INDICATION, 2022-2032 ($MILLION)
- TABLE 82. SAUDI ARABIA NEUROINTERVENTIONAL DEVICES MARKET, BY APPLICATION, 2022-2032 ($MILLION)
- TABLE 83. SOUTH AFRICA NEUROINTERVENTIONAL DEVICES MARKET, BY PRODUCT, 2022-2032 ($MILLION)
- TABLE 84. SOUTH AFRICA NEUROINTERVENTIONAL DEVICES MARKET, BY INDICATION, 2022-2032 ($MILLION)
- TABLE 85. SOUTH AFRICA NEUROINTERVENTIONAL DEVICES MARKET, BY APPLICATION, 2022-2032 ($MILLION)
- TABLE 86. REST OF LAMEA NEUROINTERVENTIONAL DEVICES MARKET, BY PRODUCT, 2022-2032 ($MILLION)
- TABLE 87. REST OF LAMEA NEUROINTERVENTIONAL DEVICES MARKET, BY INDICATION, 2022-2032 ($MILLION)
- TABLE 88. REST OF LAMEA NEUROINTERVENTIONAL DEVICES MARKET, BY APPLICATION, 2022-2032 ($MILLION)
- TABLE 89. STRYKER CORPORATION.: KEY EXECUTIVES
- TABLE 90. STRYKER CORPORATION.: COMPANY SNAPSHOT
- TABLE 91. STRYKER CORPORATION.: PRODUCT SEGMENTS
- TABLE 92. STRYKER CORPORATION.: PRODUCT PORTFOLIO
- TABLE 93. STRYKER CORPORATION.: KEY STRATERGIES
- TABLE 94. JOHNSON & JOHNSON: KEY EXECUTIVES
- TABLE 95. JOHNSON & JOHNSON: COMPANY SNAPSHOT
- TABLE 96. JOHNSON & JOHNSON: PRODUCT SEGMENTS
- TABLE 97. JOHNSON & JOHNSON: PRODUCT PORTFOLIO
- TABLE 98. JOHNSON & JOHNSON: KEY STRATERGIES
- TABLE 99. MEDTRONIC PLC: KEY EXECUTIVES
- TABLE 100. MEDTRONIC PLC: COMPANY SNAPSHOT
- TABLE 101. MEDTRONIC PLC: PRODUCT SEGMENTS
- TABLE 102. MEDTRONIC PLC: PRODUCT PORTFOLIO
- TABLE 103. TERUMO CORPORATION: KEY EXECUTIVES
- TABLE 104. TERUMO CORPORATION: COMPANY SNAPSHOT
- TABLE 105. TERUMO CORPORATION: PRODUCT SEGMENTS
- TABLE 106. TERUMO CORPORATION: PRODUCT PORTFOLIO
- TABLE 107. TERUMO CORPORATION: KEY STRATERGIES
- TABLE 108. INTEGER HOLDINGS CORPORATION: KEY EXECUTIVES
- TABLE 109. INTEGER HOLDINGS CORPORATION: COMPANY SNAPSHOT
- TABLE 110. INTEGER HOLDINGS CORPORATION: PRODUCT SEGMENTS
- TABLE 111. INTEGER HOLDINGS CORPORATION: PRODUCT PORTFOLIO
- TABLE 112. INTEGER HOLDINGS CORPORATION: KEY STRATERGIES
- TABLE 113. LEPU MEDICAL TECHNOLOGY (BEIJING) CO., LTD: KEY EXECUTIVES
- TABLE 114. LEPU MEDICAL TECHNOLOGY (BEIJING) CO., LTD: COMPANY SNAPSHOT
- TABLE 115. LEPU MEDICAL TECHNOLOGY (BEIJING) CO., LTD: PRODUCT SEGMENTS
- TABLE 116. LEPU MEDICAL TECHNOLOGY (BEIJING) CO., LTD: SERVICE SEGMENTS
- TABLE 117. LEPU MEDICAL TECHNOLOGY (BEIJING) CO., LTD: PRODUCT PORTFOLIO
- TABLE 118. BALT GROUP: KEY EXECUTIVES
- TABLE 119. BALT GROUP: COMPANY SNAPSHOT
- TABLE 120. BALT GROUP: PRODUCT SEGMENTS
- TABLE 121. BALT GROUP: PRODUCT PORTFOLIO
- TABLE 122. MERIT MEDICAL SYSTEMS INC.: KEY EXECUTIVES
- TABLE 123. MERIT MEDICAL SYSTEMS INC.: COMPANY SNAPSHOT
- TABLE 124. MERIT MEDICAL SYSTEMS INC.: PRODUCT SEGMENTS
- TABLE 125. MERIT MEDICAL SYSTEMS INC.: PRODUCT PORTFOLIO
- TABLE 126. COOK GROUP INC: KEY EXECUTIVES
- TABLE 127. COOK GROUP INC: COMPANY SNAPSHOT
- TABLE 128. COOK GROUP INC: PRODUCT SEGMENTS
- TABLE 129. COOK GROUP INC: SERVICE SEGMENTS
- TABLE 130. COOK GROUP INC: PRODUCT PORTFOLIO
- TABLE 131. PENUMBRA, INC: KEY EXECUTIVES
- TABLE 132. PENUMBRA, INC: COMPANY SNAPSHOT
- TABLE 133. PENUMBRA, INC: PRODUCT SEGMENTS
- TABLE 134. PENUMBRA, INC: PRODUCT PORTFOLIO
LIST OF FIGURES
- FIGURE 01. NEUROINTERVENTIONAL DEVICES MARKET, 2022-2032
- FIGURE 02. SEGMENTATION OF NEUROINTERVENTIONAL DEVICES MARKET, 2022-2032
- FIGURE 03. TOP INVESTMENT POCKETS IN NEUROINTERVENTIONAL DEVICES MARKET (2023-2032)
- FIGURE 04. LOW BARGAINING POWER OF SUPPLIERS
- FIGURE 05. LOW THREAT OF NEW ENTRANTS
- FIGURE 06. LOW THREAT OF SUBSTITUTES
- FIGURE 07. LOW INTENSITY OF RIVALRY
- FIGURE 08. LOW BARGAINING POWER OF BUYERS
- FIGURE 09. DRIVERS, RESTRAINTS AND OPPORTUNITIES: GLOBALNEUROINTERVENTIONAL DEVICES MARKET
- FIGURE 09. NEUROINTERVENTIONAL DEVICES MARKET, BY PRODUCT, 2022(%)
- FIGURE 10. COMPARATIVE SHARE ANALYSIS OF NEUROINTERVENTIONAL DEVICES MARKET FOR STENTS, BY COUNTRY 2022 AND 2032(%)
- FIGURE 11. COMPARATIVE SHARE ANALYSIS OF NEUROINTERVENTIONAL DEVICES MARKET FOR EMBOLIC COILS, BY COUNTRY 2022 AND 2032(%)
- FIGURE 12. COMPARATIVE SHARE ANALYSIS OF NEUROINTERVENTIONAL DEVICES MARKET FOR CATHETER, BY COUNTRY 2022 AND 2032(%)
- FIGURE 13. COMPARATIVE SHARE ANALYSIS OF NEUROINTERVENTIONAL DEVICES MARKET FOR WIRES, BY COUNTRY 2022 AND 2032(%)
- FIGURE 14. COMPARATIVE SHARE ANALYSIS OF NEUROINTERVENTIONAL DEVICES MARKET FOR OTHERS, BY COUNTRY 2022 AND 2032(%)
- FIGURE 15. NEUROINTERVENTIONAL DEVICES MARKET, BY INDICATION, 2022(%)
- FIGURE 16. COMPARATIVE SHARE ANALYSIS OF NEUROINTERVENTIONAL DEVICES MARKET FOR BRAIN ANEURYSM, BY COUNTRY 2022 AND 2032(%)
- FIGURE 17. COMPARATIVE SHARE ANALYSIS OF NEUROINTERVENTIONAL DEVICES MARKET FOR STROKE, BY COUNTRY 2022 AND 2032(%)
- FIGURE 18. COMPARATIVE SHARE ANALYSIS OF NEUROINTERVENTIONAL DEVICES MARKET FOR OTHERS, BY COUNTRY 2022 AND 2032(%)
- FIGURE 19. NEUROINTERVENTIONAL DEVICES MARKET, BY APPLICATION, 2022(%)
- FIGURE 20. COMPARATIVE SHARE ANALYSIS OF NEUROINTERVENTIONAL DEVICES MARKET FOR HOSPITALS, BY COUNTRY 2022 AND 2032(%)
- FIGURE 21. COMPARATIVE SHARE ANALYSIS OF NEUROINTERVENTIONAL DEVICES MARKET FOR AMBULATORY SURGICAL CENTERS, BY COUNTRY 2022 AND 2032(%)
- FIGURE 22. COMPARATIVE SHARE ANALYSIS OF NEUROINTERVENTIONAL DEVICES MARKET FOR OTHERS, BY COUNTRY 2022 AND 2032(%)
- FIGURE 23. NEUROINTERVENTIONAL DEVICES MARKET BY REGION, 2022
- FIGURE 24. U.S. NEUROINTERVENTIONAL DEVICES MARKET, 2022-2032 ($MILLION)
- FIGURE 25. CANADA NEUROINTERVENTIONAL DEVICES MARKET, 2022-2032 ($MILLION)
- FIGURE 26. MEXICO NEUROINTERVENTIONAL DEVICES MARKET, 2022-2032 ($MILLION)
- FIGURE 27. GERMANY NEUROINTERVENTIONAL DEVICES MARKET, 2022-2032 ($MILLION)
- FIGURE 28. FRANCE NEUROINTERVENTIONAL DEVICES MARKET, 2022-2032 ($MILLION)
- FIGURE 29. UK NEUROINTERVENTIONAL DEVICES MARKET, 2022-2032 ($MILLION)
- FIGURE 30. ITALY NEUROINTERVENTIONAL DEVICES MARKET, 2022-2032 ($MILLION)
- FIGURE 31. SPAIN NEUROINTERVENTIONAL DEVICES MARKET, 2022-2032 ($MILLION)
- FIGURE 32. REST OF EUROPE NEUROINTERVENTIONAL DEVICES MARKET, 2022-2032 ($MILLION)
- FIGURE 33. JAPAN NEUROINTERVENTIONAL DEVICES MARKET, 2022-2032 ($MILLION)
- FIGURE 34. CHINA NEUROINTERVENTIONAL DEVICES MARKET, 2022-2032 ($MILLION)
- FIGURE 35. AUSTRALIA NEUROINTERVENTIONAL DEVICES MARKET, 2022-2032 ($MILLION)
- FIGURE 36. INDIA NEUROINTERVENTIONAL DEVICES MARKET, 2022-2032 ($MILLION)
- FIGURE 37. SOUTH KOREA NEUROINTERVENTIONAL DEVICES MARKET, 2022-2032 ($MILLION)
- FIGURE 38. REST OF ASIA-PACIFIC NEUROINTERVENTIONAL DEVICES MARKET, 2022-2032 ($MILLION)
- FIGURE 39. BRAZIL NEUROINTERVENTIONAL DEVICES MARKET, 2022-2032 ($MILLION)
- FIGURE 40. SAUDI ARABIA NEUROINTERVENTIONAL DEVICES MARKET, 2022-2032 ($MILLION)
- FIGURE 41. SOUTH AFRICA NEUROINTERVENTIONAL DEVICES MARKET, 2022-2032 ($MILLION)
- FIGURE 42. REST OF LAMEA NEUROINTERVENTIONAL DEVICES MARKET, 2022-2032 ($MILLION)
- FIGURE 43. TOP WINNING STRATEGIES, BY YEAR
- FIGURE 44. TOP WINNING STRATEGIES, BY DEVELOPMENT
- FIGURE 45. TOP WINNING STRATEGIES, BY COMPANY
- FIGURE 46. PRODUCT MAPPING OF TOP 10 PLAYERS
- FIGURE 47. COMPETITIVE DASHBOARD
- FIGURE 48. COMPETITIVE HEATMAP: NEUROINTERVENTIONAL DEVICES MARKET
- FIGURE 49. TOP PLAYER POSITIONING, 2022
- FIGURE 50. STRYKER CORPORATION.: NET REVENUE, 2020-2022 ($MILLION)
- FIGURE 51. STRYKER CORPORATION.: REVENUE SHARE BY SEGMENT, 2022 (%)
- FIGURE 52. STRYKER CORPORATION.: REVENUE SHARE BY REGION, 2022 (%)
- FIGURE 53. JOHNSON & JOHNSON: NET SALES, 2020-2022 ($MILLION)
- FIGURE 54. JOHNSON & JOHNSON: REVENUE SHARE BY SEGMENT, 2022 (%)
- FIGURE 55. JOHNSON & JOHNSON: REVENUE SHARE BY REGION, 2022 (%)
- FIGURE 56. MEDTRONIC PLC: NET SALES, 2020-2022 ($MILLION)
- FIGURE 57. MEDTRONIC PLC: REVENUE SHARE BY SEGMENT, 2022 (%)
- FIGURE 58. MEDTRONIC PLC: REVENUE SHARE BY REGION, 2022 (%)
- FIGURE 59. TERUMO CORPORATION: NET SALES, 2020-2022 ($MILLION)
- FIGURE 60. TERUMO CORPORATION: REVENUE SHARE BY SEGMENT, 2022 (%)
- FIGURE 61. TERUMO CORPORATION: REVENUE SHARE BY REGION, 2022 (%)
- FIGURE 62. INTEGER HOLDINGS CORPORATION: NET SALES, 2020-2022 ($MILLION)
- FIGURE 63. INTEGER HOLDINGS CORPORATION: REVENUE SHARE BY SEGMENT, 2022 (%)
- FIGURE 64. INTEGER HOLDINGS CORPORATION: REVENUE SHARE BY REGION, 2022 (%)
- FIGURE 65. LEPU MEDICAL TECHNOLOGY (BEIJING) CO., LTD: NET REVENUE, 2020-2022 ($MILLION)
- FIGURE 66. LEPU MEDICAL TECHNOLOGY (BEIJING) CO., LTD: REVENUE SHARE BY SEGMENT, 2022 (%)
- FIGURE 67. MERIT MEDICAL SYSTEMS INC.: NET REVENUE, 2020-2022 ($MILLION)
- FIGURE 68. MERIT MEDICAL SYSTEMS INC.: REVENUE SHARE BY SEGMENT, 2021 (%)
- FIGURE 69. MERIT MEDICAL SYSTEMS INC.: REVENUE SHARE BY REGION, 2021 (%)
- FIGURE 70. PENUMBRA, INC: NET REVENUE, 2020-2022 ($MILLION)
- FIGURE 71. PENUMBRA, INC: REVENUE SHARE BY REGION, 2022 (%)
- FIGURE 72. PENUMBRA, INC: REVENUE SHARE BY SEGMENT, 2022 (%)


