


 |
市場調查報告書
商品編碼
1298408
推薦引擎市場:按類型、按部署模型、按公司規模、按應用、按行業:2021-2031 年全球機會分析和行業預測Recommendation Engine Market By Type, By Deployment Model, By Enterprise Size, By Application, By Industry Vertical : Global Opportunity Analysis and Industry Forecast, 2021-2031 |
||||||
推薦引擎是一種數據過濾工具,它使用機器學習算法為特定用戶或客戶推薦最相關的項目。
它還遵循從隱式或顯式收集的消費者行為數據中尋找模式的原則。
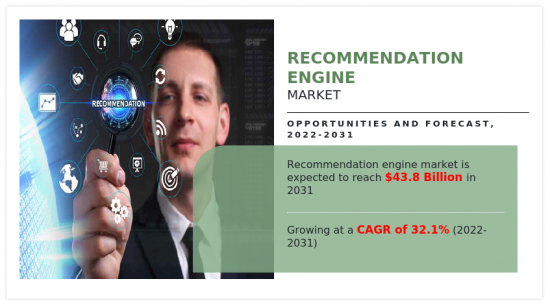
數字技術的日益採用和對增強客戶體驗的日益關注正在推動全球推薦引擎市場的增長。此外,在人工智能推薦引擎解決方案中增加深度學習技術的使用將對推薦引擎市場的增長產生積極影響。然而,缺乏技能和專業知識,以及對訪問客戶個人數據的擔憂正在阻礙推薦引擎市場的增長。相反,分析大量數據的需求不斷增長預計將為預測期內推薦引擎市場的擴張提供利潤豐厚的機會。
目錄
第 1 章 簡介
第二章執行摘要
第三章市場概況
- 市場定義和範圍
- 主要發現
- 影響因素
- 主要投資機會
- 波特五力分析
- 供應商的議價能力
- 買方議價能力
- 替代品的威脅
- 新進入者的威脅
- 競爭強度
- 市場動態
- 促進者
- 數字技術的採用增加
- 越來越注重改善客戶體驗
- 在人工智能推薦引擎解決方案中越來越多地使用深度學習技術
- 阻礙因素
- 缺乏技能和專業知識
- 對獲取客戶個人數據的擔憂
- 機會
- 分析大量數據的需求增加
- 促進者
- COVID-19 市場影響分析
4. 推薦引擎市場(按類型)
- 概述
- 市場規模及預測
- 協同過濾
- 主要市場趨勢、增長動力和機遇
- 市場規模/預測:按地區
- 市場份額分析:按國家分類
- 基於內容的過濾
- 主要市場趨勢、增長動力和機遇
- 市場規模/預測:按地區
- 市場份額分析:按國家分類
- 混合推薦
- 主要市場趨勢、增長動力和機遇
- 市場規模/預測:按地區
- 市場份額分析:按國家分類
5. 推薦引擎市場(按部署模型)
- 概述
- 市場規模/預測
- 本地
- 主要市場趨勢、增長動力和機遇
- 市場規模/預測:按地區
- 市場份額分析:按國家分類
- 雲
- 主要市場趨勢、增長動力和機遇
- 市場規模/預測:按地區
- 市場份額分析:按國家分類
6.推薦引擎市場,按公司規模劃分
- 概述
- 市場規模及預測
- 大公司
- 主要市場趨勢、增長動力和機遇
- 市場規模/預測:按地區
- 市場份額分析:按國家分類
- 中小企業
- 主要市場趨勢、增長動力和機遇
- 市場規模/預測:按地區
- 市場份額分析:按國家分類
7. 推薦引擎市場(按應用)
- 概述
- 市場規模及預測
- 個性化活動和客戶交付
- 主要市場趨勢、增長動力和機遇
- 市場規模/預測:按地區
- 市場份額分析:按國家分類
- 戰略運營和規劃
- 主要市場趨勢、增長動力和機遇
- 市場規模/預測:按地區
- 市場份額分析:按國家分類
- 產品規劃和主動資產管理
- 主要市場趨勢、增長動力和機遇
- 市場規模/預測:按地區
- 市場份額分析:按國家分類
8.推薦引擎市場(按行業)
- 概述
- 市場規模及預測
- 零售/消費品
- 主要市場趨勢、增長動力和機遇
- 市場規模/預測:按地區
- 市場份額分析:按國家分類
- IT/通訊
- 主要市場趨勢、增長動力和機遇
- 市場規模/預測:按地區
- 市場份額分析:按國家分類
- 醫療保健和生命科學
- 主要市場趨勢、增長動力和機遇
- 市場規模/預測:按地區
- 市場份額分析:按國家分類
- BFSI市場
- 主要市場趨勢、增長動力和機遇
- 市場規模/預測:按地區
- 市場份額分析:按國家分類
- 媒體娛樂
- 主要市場趨勢、增長動力和機遇
- 市場規模/預測:按地區
- 市場份額分析:按國家分類
- 其他
- 主要市場趨勢、增長動力和機遇
- 市場規模/預測:按地區
- 市場份額分析:按國家分類
9.推薦引擎市場(按地區)
- 概述
- 市場規模/預測:按地區
- 北美
- 主要趨勢和機遇
- 市場規模/預測:按類型
- 市場規模/預測:按部署模型
- 市場規模/預測:按公司規模
- 市場規模/預測:按應用
- 市場規模/預測:按行業劃分
- 市場規模/預測:按國家
- 美國
- 主要市場趨勢、增長動力和機遇
- 市場規模/預測:按類型
- 市場規模/預測:按部署模型
- 市場規模/預測:按公司規模
- 市場規模/預測:按應用
- 市場規模/預測:按行業劃分
- 加拿大
- 主要市場趨勢、增長動力和機遇
- 市場規模/預測:按類型
- 市場規模/預測:按部署模型
- 市場規模/預測:按公司規模
- 市場規模/預測:按應用
- 市場規模/預測:按行業劃分
- 歐洲
- 主要趨勢和機遇
- 市場規模/預測:按類型
- 市場規模/預測:按部署模型
- 市場規模/預測:按公司規模
- 市場規模/預測:按應用
- 市場規模/預測:按行業劃分
- 市場規模/預測:按國家
- 英國
- 主要市場趨勢、增長動力和機遇
- 市場規模/預測:按類型
- 市場規模/預測:按部署模型
- 市場規模/預測:按公司規模
- 市場規模/預測:按應用
- 市場規模/預測:按行業劃分
- 德國
- 主要市場趨勢、增長動力和機遇
- 市場規模/預測:按類型
- 市場規模/預測:按部署模型
- 市場規模/預測:按公司規模
- 市場規模/預測:按應用
- 市場規模/預測:按行業劃分
- 法國
- 主要市場趨勢、增長動力和機遇
- 市場規模/預測:按類型
- 市場規模/預測:按部署模型
- 市場規模/預測:按公司規模
- 市場規模/預測:按應用
- 市場規模/預測:按行業劃分
- 意大利
- 主要市場趨勢、增長動力和機遇
- 市場規模/預測:按類型
- 市場規模/預測:按部署模型
- 市場規模/預測:按公司規模
- 市場規模/預測:按應用
- 市場規模/預測:按行業劃分
- 西班牙
- 主要市場趨勢、增長動力和機遇
- 市場規模/預測:按類型
- 市場規模/預測:按部署模型
- 市場規模/預測:按公司規模
- 市場規模/預測:按應用
- 市場規模/預測:按行業劃分
- 歐洲其他地區
- 主要市場趨勢、增長動力和機遇
- 市場規模/預測:按類型
- 市場規模/預測:按部署模型
- 市場規模/預測:按公司規模
- 市場規模/預測:按應用
- 市場規模/預測:按行業劃分
- 亞太地區
- 主要趨勢和機遇
- 市場規模/預測:按類型
- 市場規模/預測:按部署模型
- 市場規模/預測:按公司規模
- 市場規模/預測:按應用
- 市場規模/預測:按行業劃分
- 市場規模/預測:按國家
- 中國市場
- 主要市場趨勢、增長動力和機遇
- 市場規模/預測:按類型
- 市場規模/預測:按部署模型
- 市場規模/預測:按公司規模
- 市場規模/預測:按應用
- 市場規模/預測:按行業劃分
- 日本
- 主要市場趨勢、增長動力和機遇
- 市場規模/預測:按類型
- 市場規模/預測:按部署模型
- 市場規模/預測:按公司規模
- 市場規模/預測:按應用
- 市場規模/預測:按行業劃分
- 韓國市場
- 主要市場趨勢、增長動力和機遇
- 市場規模/預測:按類型
- 市場規模/預測:按部署模型
- 市場規模/預測:按公司規模
- 市場規模/預測:按應用
- 市場規模/預測:按行業劃分
- 印度市場
- 主要市場趨勢、增長動力和機遇
- 市場規模/預測:按類型
- 市場規模/預測:按部署模型
- 市場規模/預測:按公司規模
- 市場規模/預測:按應用
- 市場規模/預測:按行業劃分
- 澳大利亞
- 主要市場趨勢、增長動力和機遇
- 市場規模/預測:按類型
- 市場規模/預測:按部署模型
- 市場規模/預測:按公司規模
- 市場規模/預測:按應用
- 市場規模/預測:按行業劃分
- 亞太其他地區
- 主要市場趨勢、增長動力和機遇
- 市場規模/預測:按類型
- 市場規模/預測:按部署模型
- 市場規模/預測:按公司規模
- 市場規模/預測:按應用
- 市場規模/預測:按行業劃分
- 拉丁美洲/中東/非洲
- 主要趨勢和機遇
- 市場規模/預測:按類型
- 市場規模/預測:按部署模型
- 市場規模/預測:按公司規模
- 市場規模/預測:按應用
- 市場規模/預測:按行業劃分
- 市場規模/預測:按國家
- 拉丁美洲
- 主要市場趨勢、增長動力和機遇
- 市場規模/預測:按類型
- 市場規模/預測:按部署模型
- 市場規模/預測:按公司規模
- 市場規模/預測:按應用
- 市場規模/預測:按行業劃分
- 中東市場
- 主要市場趨勢、增長動力和機遇
- 市場規模/預測:按類型
- 市場規模/預測:按部署模型
- 市場規模/預測:按公司規模
- 市場規模/預測:按應用
- 市場規模/預測:按行業劃分
- 非洲市場
- 主要市場趨勢、增長動力和機遇
- 市場規模/預測:按類型
- 市場規模/預測:按部署模型
- 市場規模/預測:按公司規模
- 市場規模/預測:按應用
- 市場規模/預測:按行業劃分
第10章 競爭格局
- 介紹
- 關鍵成功策略
- 10大公司產品圖
- 比賽儀表板
- 比賽熱圖
- 2021 年頂級公司定位
第十一章公司簡介
- Adobe
- Amazon Web Services
- Google LLC
- Hewlett Packard Enterprise Development LP
- IBM Corporation
- Intel Corporation
- Microsoft Corporation
- Oracle Corporation
- Salesforce, Inc.
- SAP SE
A recommendation engine is a type of data filtering tool that uses machine learning algorithms to recommend the most relevant items to a particular user or customer. In addition, it operates on the principle of finding patterns in consumer behavior data, which can be collected implicitly or explicitly.
Rise in adoption of digital technologies and increase in focus enhance customer experience, which boost the growth of the global recommendation engine market. In addition, increase in use of the deep learning technology in AI recommendation engine solution positively impacts the growth of the recommendation engine market. However, lack of skills & expertise and concerns over accessing customers' personal data hamper the recommendation engine market growth. On the contrary, increase in demand to analyze large volume of data is expected to offer remunerative opportunities for expansion of the recommendation engine market during the forecast period.
The recommendation engine market is segmented on the basis of by type, deployment model, application type, enterprise size, industry vertical, and region. On the basis of type, the market is categorized into collaborative filtering, content-based filtering, and hybrid recommendation. On the basis of deployment model, the market is bifurcated into on-premise and cloud. On the basis of enterprise size, the market is bifurcated into large enterprises and SMEs. By application type, the market is divided into personalized campaigns & customer delivery, strategy operations & planning, and product planning & proactive asset management. By industry vertical, it is classified into BFSI, IT & telecom, healthcare & life science, retail & consumer goods, media & entertainment, and others. By region, the market is analyzed across North America, Europe, Asia-Pacific, and LAMEA.
The key players that operate in the recommendation engine market are: Adobe, Amazon Web Services, Google LLC, Hewlett Packard Enterprise Development LP, IBM Corporation, Intel Corporation, Microsoft Corporation, Oracle Corporation, Salesforce, Inc., and SAP SE. These players have adopted various strategies to increase their market penetration and strengthen their position in the industry.
KEY BENEFITS FOR STAKEHOLDERS
- The study provides an in-depth analysis of the global recommendation engine market forecast along with the current and future trends to explain the imminent investment pockets.
- Information about key drivers, restraints, and opportunities and their impact analysis on global recommendation engine market trend is provided in the report.
- The Porter's five forces analysis illustrates the potency of the buyers and suppliers operating in the industry.
- The quantitative analysis of the market from 2022 to 2031 is provided to determine the market potential.
Key Market Segments
By Industry Vertical
- Retail and Consumer Goods
- IT and Telecom
- Healthcare and Life Science
- BFSI
- Media and Entertainment
- Others
By Type
- Collaborative Filtering
- Content-based Filtering
- Hybrid recommendation
By Deployment Model
- On-Premises
- Cloud
By Enterprise Size
- Large Enterprises
- Small and Medium Enterprises
By Application
- Personalized Campaigns and Customer Delivery
- Strategy Operations and Planning
- Product Planning and Proactive Asset Management
By Region
- North America
- U.S.
- Canada
- Europe
- UK
- Germany
- France
- Italy
- Spain
- Rest of Europe
- Asia-Pacific
- China
- Japan
- South Korea
- India
- Australia
- Rest of Asia-Pacific
- LAMEA
- Latin America
- Middle East
- Africa
Key Market Players:
- Amazon Web Services
- IBM Corporation
- Microsoft Corporation
- Oracle Corporation
- SAP SE
- Adobe
- Google LLC
- Intel Corporation
- Salesforce, Inc.
- Hewlett Packard Enterprise Development LP
TABLE OF CONTENTS
CHAPTER 1: INTRODUCTION
- 1.1. Report description
- 1.2. Key market segments
- 1.3. Key benefits to the stakeholders
- 1.4. Research Methodology
- 1.4.1. Primary research
- 1.4.2. Secondary research
- 1.4.3. Analyst tools and models
CHAPTER 2: EXECUTIVE SUMMARY
- 2.1. CXO Perspective
CHAPTER 3: MARKET OVERVIEW
- 3.1. Market definition and scope
- 3.2. Key findings
- 3.2.1. Top impacting factors
- 3.2.2. Top investment pockets
- 3.3. Porter's five forces analysis
- 3.3.1. Bargaining power of suppliers
- 3.3.2. Bargaining power of buyers
- 3.3.3. Threat of substitutes
- 3.3.4. Threat of new entrants
- 3.3.5. Intensity of rivalry
- 3.4. Market dynamics
- 3.4.1. Drivers
- 3.4.1.1. Growth in adoption of digital technologies
- 3.4.1.2. Increase in focus on enhancing the customer experience
- 3.4.1.3. Increase in use of the deep learning technology in AI recommendation engine solution
- 3.4.1. Drivers
- 3.4.2. Restraints
- 3.4.2.1. Lack of skills and expertise
- 3.4.2.2. Concerns over accessing customers' personal data
- 3.4.3. Opportunities
- 3.4.3.1. Increase in demand to analyze large volume of data
- 3.5. COVID-19 Impact Analysis on the market
CHAPTER 4: RECOMMENDATION ENGINE MARKET, BY TYPE
- 4.1. Overview
- 4.1.1. Market size and forecast
- 4.2. Collaborative Filtering
- 4.2.1. Key market trends, growth factors and opportunities
- 4.2.2. Market size and forecast, by region
- 4.2.3. Market share analysis by country
- 4.3. Content-based Filtering
- 4.3.1. Key market trends, growth factors and opportunities
- 4.3.2. Market size and forecast, by region
- 4.3.3. Market share analysis by country
- 4.4. Hybrid recommendation
- 4.4.1. Key market trends, growth factors and opportunities
- 4.4.2. Market size and forecast, by region
- 4.4.3. Market share analysis by country
CHAPTER 5: RECOMMENDATION ENGINE MARKET, BY DEPLOYMENT MODEL
- 5.1. Overview
- 5.1.1. Market size and forecast
- 5.2. On-Premises
- 5.2.1. Key market trends, growth factors and opportunities
- 5.2.2. Market size and forecast, by region
- 5.2.3. Market share analysis by country
- 5.3. Cloud
- 5.3.1. Key market trends, growth factors and opportunities
- 5.3.2. Market size and forecast, by region
- 5.3.3. Market share analysis by country
CHAPTER 6: RECOMMENDATION ENGINE MARKET, BY ENTERPRISE SIZE
- 6.1. Overview
- 6.1.1. Market size and forecast
- 6.2. Large Enterprises
- 6.2.1. Key market trends, growth factors and opportunities
- 6.2.2. Market size and forecast, by region
- 6.2.3. Market share analysis by country
- 6.3. Small and Medium Enterprises
- 6.3.1. Key market trends, growth factors and opportunities
- 6.3.2. Market size and forecast, by region
- 6.3.3. Market share analysis by country
CHAPTER 7: RECOMMENDATION ENGINE MARKET, BY APPLICATION
- 7.1. Overview
- 7.1.1. Market size and forecast
- 7.2. Personalized Campaigns and Customer Delivery
- 7.2.1. Key market trends, growth factors and opportunities
- 7.2.2. Market size and forecast, by region
- 7.2.3. Market share analysis by country
- 7.3. Strategy Operations and Planning
- 7.3.1. Key market trends, growth factors and opportunities
- 7.3.2. Market size and forecast, by region
- 7.3.3. Market share analysis by country
- 7.4. Product Planning and Proactive Asset Management
- 7.4.1. Key market trends, growth factors and opportunities
- 7.4.2. Market size and forecast, by region
- 7.4.3. Market share analysis by country
CHAPTER 8: RECOMMENDATION ENGINE MARKET, BY INDUSTRY VERTICAL
- 8.1. Overview
- 8.1.1. Market size and forecast
- 8.2. Retail and Consumer Goods
- 8.2.1. Key market trends, growth factors and opportunities
- 8.2.2. Market size and forecast, by region
- 8.2.3. Market share analysis by country
- 8.3. IT and Telecom
- 8.3.1. Key market trends, growth factors and opportunities
- 8.3.2. Market size and forecast, by region
- 8.3.3. Market share analysis by country
- 8.4. Healthcare and Life Science
- 8.4.1. Key market trends, growth factors and opportunities
- 8.4.2. Market size and forecast, by region
- 8.4.3. Market share analysis by country
- 8.5. BFSI
- 8.5.1. Key market trends, growth factors and opportunities
- 8.5.2. Market size and forecast, by region
- 8.5.3. Market share analysis by country
- 8.6. Media and Entertainment
- 8.6.1. Key market trends, growth factors and opportunities
- 8.6.2. Market size and forecast, by region
- 8.6.3. Market share analysis by country
- 8.7. Others
- 8.7.1. Key market trends, growth factors and opportunities
- 8.7.2. Market size and forecast, by region
- 8.7.3. Market share analysis by country
CHAPTER 9: RECOMMENDATION ENGINE MARKET, BY REGION
- 9.1. Overview
- 9.1.1. Market size and forecast By Region
- 9.2. North America
- 9.2.1. Key trends and opportunities
- 9.2.2. Market size and forecast, by Type
- 9.2.3. Market size and forecast, by Deployment Model
- 9.2.4. Market size and forecast, by Enterprise Size
- 9.2.5. Market size and forecast, by Application
- 9.2.6. Market size and forecast, by Industry Vertical
- 9.2.7. Market size and forecast, by country
- 9.2.7.1. U.S.
- 9.2.7.1.1. Key market trends, growth factors and opportunities
- 9.2.7.1.2. Market size and forecast, by Type
- 9.2.7.1.3. Market size and forecast, by Deployment Model
- 9.2.7.1.4. Market size and forecast, by Enterprise Size
- 9.2.7.1.5. Market size and forecast, by Application
- 9.2.7.1.6. Market size and forecast, by Industry Vertical
- 9.2.7.2. Canada
- 9.2.7.2.1. Key market trends, growth factors and opportunities
- 9.2.7.2.2. Market size and forecast, by Type
- 9.2.7.2.3. Market size and forecast, by Deployment Model
- 9.2.7.2.4. Market size and forecast, by Enterprise Size
- 9.2.7.2.5. Market size and forecast, by Application
- 9.2.7.2.6. Market size and forecast, by Industry Vertical
- 9.3. Europe
- 9.3.1. Key trends and opportunities
- 9.3.2. Market size and forecast, by Type
- 9.3.3. Market size and forecast, by Deployment Model
- 9.3.4. Market size and forecast, by Enterprise Size
- 9.3.5. Market size and forecast, by Application
- 9.3.6. Market size and forecast, by Industry Vertical
- 9.3.7. Market size and forecast, by country
- 9.3.7.1. UK
- 9.3.7.1.1. Key market trends, growth factors and opportunities
- 9.3.7.1.2. Market size and forecast, by Type
- 9.3.7.1.3. Market size and forecast, by Deployment Model
- 9.3.7.1.4. Market size and forecast, by Enterprise Size
- 9.3.7.1.5. Market size and forecast, by Application
- 9.3.7.1.6. Market size and forecast, by Industry Vertical
- 9.3.7.2. Germany
- 9.3.7.2.1. Key market trends, growth factors and opportunities
- 9.3.7.2.2. Market size and forecast, by Type
- 9.3.7.2.3. Market size and forecast, by Deployment Model
- 9.3.7.2.4. Market size and forecast, by Enterprise Size
- 9.3.7.2.5. Market size and forecast, by Application
- 9.3.7.2.6. Market size and forecast, by Industry Vertical
- 9.3.7.3. France
- 9.3.7.3.1. Key market trends, growth factors and opportunities
- 9.3.7.3.2. Market size and forecast, by Type
- 9.3.7.3.3. Market size and forecast, by Deployment Model
- 9.3.7.3.4. Market size and forecast, by Enterprise Size
- 9.3.7.3.5. Market size and forecast, by Application
- 9.3.7.3.6. Market size and forecast, by Industry Vertical
- 9.3.7.4. Italy
- 9.3.7.4.1. Key market trends, growth factors and opportunities
- 9.3.7.4.2. Market size and forecast, by Type
- 9.3.7.4.3. Market size and forecast, by Deployment Model
- 9.3.7.4.4. Market size and forecast, by Enterprise Size
- 9.3.7.4.5. Market size and forecast, by Application
- 9.3.7.4.6. Market size and forecast, by Industry Vertical
- 9.3.7.5. Spain
- 9.3.7.5.1. Key market trends, growth factors and opportunities
- 9.3.7.5.2. Market size and forecast, by Type
- 9.3.7.5.3. Market size and forecast, by Deployment Model
- 9.3.7.5.4. Market size and forecast, by Enterprise Size
- 9.3.7.5.5. Market size and forecast, by Application
- 9.3.7.5.6. Market size and forecast, by Industry Vertical
- 9.3.7.6. Rest of Europe
- 9.3.7.6.1. Key market trends, growth factors and opportunities
- 9.3.7.6.2. Market size and forecast, by Type
- 9.3.7.6.3. Market size and forecast, by Deployment Model
- 9.3.7.6.4. Market size and forecast, by Enterprise Size
- 9.3.7.6.5. Market size and forecast, by Application
- 9.3.7.6.6. Market size and forecast, by Industry Vertical
- 9.4. Asia-Pacific
- 9.4.1. Key trends and opportunities
- 9.4.2. Market size and forecast, by Type
- 9.4.3. Market size and forecast, by Deployment Model
- 9.4.4. Market size and forecast, by Enterprise Size
- 9.4.5. Market size and forecast, by Application
- 9.4.6. Market size and forecast, by Industry Vertical
- 9.4.7. Market size and forecast, by country
- 9.4.7.1. China
- 9.4.7.1.1. Key market trends, growth factors and opportunities
- 9.4.7.1.2. Market size and forecast, by Type
- 9.4.7.1.3. Market size and forecast, by Deployment Model
- 9.4.7.1.4. Market size and forecast, by Enterprise Size
- 9.4.7.1.5. Market size and forecast, by Application
- 9.4.7.1.6. Market size and forecast, by Industry Vertical
- 9.4.7.2. Japan
- 9.4.7.2.1. Key market trends, growth factors and opportunities
- 9.4.7.2.2. Market size and forecast, by Type
- 9.4.7.2.3. Market size and forecast, by Deployment Model
- 9.4.7.2.4. Market size and forecast, by Enterprise Size
- 9.4.7.2.5. Market size and forecast, by Application
- 9.4.7.2.6. Market size and forecast, by Industry Vertical
- 9.4.7.3. South Korea
- 9.4.7.3.1. Key market trends, growth factors and opportunities
- 9.4.7.3.2. Market size and forecast, by Type
- 9.4.7.3.3. Market size and forecast, by Deployment Model
- 9.4.7.3.4. Market size and forecast, by Enterprise Size
- 9.4.7.3.5. Market size and forecast, by Application
- 9.4.7.3.6. Market size and forecast, by Industry Vertical
- 9.4.7.4. India
- 9.4.7.4.1. Key market trends, growth factors and opportunities
- 9.4.7.4.2. Market size and forecast, by Type
- 9.4.7.4.3. Market size and forecast, by Deployment Model
- 9.4.7.4.4. Market size and forecast, by Enterprise Size
- 9.4.7.4.5. Market size and forecast, by Application
- 9.4.7.4.6. Market size and forecast, by Industry Vertical
- 9.4.7.5. Australia
- 9.4.7.5.1. Key market trends, growth factors and opportunities
- 9.4.7.5.2. Market size and forecast, by Type
- 9.4.7.5.3. Market size and forecast, by Deployment Model
- 9.4.7.5.4. Market size and forecast, by Enterprise Size
- 9.4.7.5.5. Market size and forecast, by Application
- 9.4.7.5.6. Market size and forecast, by Industry Vertical
- 9.4.7.6. Rest of Asia-Pacific
- 9.4.7.6.1. Key market trends, growth factors and opportunities
- 9.4.7.6.2. Market size and forecast, by Type
- 9.4.7.6.3. Market size and forecast, by Deployment Model
- 9.4.7.6.4. Market size and forecast, by Enterprise Size
- 9.4.7.6.5. Market size and forecast, by Application
- 9.4.7.6.6. Market size and forecast, by Industry Vertical
- 9.5. LAMEA
- 9.5.1. Key trends and opportunities
- 9.5.2. Market size and forecast, by Type
- 9.5.3. Market size and forecast, by Deployment Model
- 9.5.4. Market size and forecast, by Enterprise Size
- 9.5.5. Market size and forecast, by Application
- 9.5.6. Market size and forecast, by Industry Vertical
- 9.5.7. Market size and forecast, by country
- 9.5.7.1. Latin America
- 9.5.7.1.1. Key market trends, growth factors and opportunities
- 9.5.7.1.2. Market size and forecast, by Type
- 9.5.7.1.3. Market size and forecast, by Deployment Model
- 9.5.7.1.4. Market size and forecast, by Enterprise Size
- 9.5.7.1.5. Market size and forecast, by Application
- 9.5.7.1.6. Market size and forecast, by Industry Vertical
- 9.5.7.2. Middle East
- 9.5.7.2.1. Key market trends, growth factors and opportunities
- 9.5.7.2.2. Market size and forecast, by Type
- 9.5.7.2.3. Market size and forecast, by Deployment Model
- 9.5.7.2.4. Market size and forecast, by Enterprise Size
- 9.5.7.2.5. Market size and forecast, by Application
- 9.5.7.2.6. Market size and forecast, by Industry Vertical
- 9.5.7.3. Africa
- 9.5.7.3.1. Key market trends, growth factors and opportunities
- 9.5.7.3.2. Market size and forecast, by Type
- 9.5.7.3.3. Market size and forecast, by Deployment Model
- 9.5.7.3.4. Market size and forecast, by Enterprise Size
- 9.5.7.3.5. Market size and forecast, by Application
- 9.5.7.3.6. Market size and forecast, by Industry Vertical
CHAPTER 10: COMPETITIVE LANDSCAPE
- 10.1. Introduction
- 10.2. Top winning strategies
- 10.3. Product Mapping of Top 10 Player
- 10.4. Competitive Dashboard
- 10.5. Competitive Heatmap
- 10.6. Top player positioning, 2021
CHAPTER 11: COMPANY PROFILES
- 11.1. Adobe
- 11.1.1. Company overview
- 11.1.2. Key Executives
- 11.1.3. Company snapshot
- 11.1.4. Operating business segments
- 11.1.5. Product portfolio
- 11.1.6. Business performance
- 11.1.7. Key strategic moves and developments
- 11.2. Amazon Web Services
- 11.2.1. Company overview
- 11.2.2. Key Executives
- 11.2.3. Company snapshot
- 11.2.4. Operating business segments
- 11.2.5. Product portfolio
- 11.2.6. Business performance
- 11.2.7. Key strategic moves and developments
- 11.3. Google LLC
- 11.3.1. Company overview
- 11.3.2. Key Executives
- 11.3.3. Company snapshot
- 11.3.4. Operating business segments
- 11.3.5. Product portfolio
- 11.3.6. Business performance
- 11.3.7. Key strategic moves and developments
- 11.4. Hewlett Packard Enterprise Development LP
- 11.4.1. Company overview
- 11.4.2. Key Executives
- 11.4.3. Company snapshot
- 11.4.4. Operating business segments
- 11.4.5. Product portfolio
- 11.4.6. Business performance
- 11.5. IBM Corporation
- 11.5.1. Company overview
- 11.5.2. Key Executives
- 11.5.3. Company snapshot
- 11.5.4. Operating business segments
- 11.5.5. Product portfolio
- 11.5.6. Business performance
- 11.5.7. Key strategic moves and developments
- 11.6. Intel Corporation
- 11.6.1. Company overview
- 11.6.2. Key Executives
- 11.6.3. Company snapshot
- 11.6.4. Operating business segments
- 11.6.5. Product portfolio
- 11.6.6. Business performance
- 11.6.7. Key strategic moves and developments
- 11.7. Microsoft Corporation
- 11.7.1. Company overview
- 11.7.2. Key Executives
- 11.7.3. Company snapshot
- 11.7.4. Operating business segments
- 11.7.5. Product portfolio
- 11.7.6. Business performance
- 11.7.7. Key strategic moves and developments
- 11.8. Oracle Corporation
- 11.8.1. Company overview
- 11.8.2. Key Executives
- 11.8.3. Company snapshot
- 11.8.4. Operating business segments
- 11.8.5. Product portfolio
- 11.8.6. Business performance
- 11.8.7. Key strategic moves and developments
- 11.9. Salesforce, Inc.
- 11.9.1. Company overview
- 11.9.2. Key Executives
- 11.9.3. Company snapshot
- 11.9.4. Operating business segments
- 11.9.5. Product portfolio
- 11.9.6. Business performance
- 11.9.7. Key strategic moves and developments
- 11.10. SAP SE
- 11.10.1. Company overview
- 11.10.2. Key Executives
- 11.10.3. Company snapshot
- 11.10.4. Operating business segments
- 11.10.5. Product portfolio
- 11.10.6. Business performance
- 11.10.7. Key strategic moves and developments
LIST OF TABLES
- TABLE 01. GLOBAL RECOMMENDATION ENGINE MARKET, BY TYPE, 2021-2031 ($MILLION)
- TABLE 02. RECOMMENDATION ENGINE MARKET FOR COLLABORATIVE FILTERING, BY REGION, 2021-2031 ($MILLION)
- TABLE 03. RECOMMENDATION ENGINE MARKET FOR CONTENT-BASED FILTERING, BY REGION, 2021-2031 ($MILLION)
- TABLE 04. RECOMMENDATION ENGINE MARKET FOR HYBRID RECOMMENDATION, BY REGION, 2021-2031 ($MILLION)
- TABLE 05. GLOBAL RECOMMENDATION ENGINE MARKET, BY DEPLOYMENT MODEL, 2021-2031 ($MILLION)
- TABLE 06. RECOMMENDATION ENGINE MARKET FOR ON-PREMISES, BY REGION, 2021-2031 ($MILLION)
- TABLE 07. RECOMMENDATION ENGINE MARKET FOR CLOUD, BY REGION, 2021-2031 ($MILLION)
- TABLE 08. GLOBAL RECOMMENDATION ENGINE MARKET, BY ENTERPRISE SIZE, 2021-2031 ($MILLION)
- TABLE 09. RECOMMENDATION ENGINE MARKET FOR LARGE ENTERPRISES, BY REGION, 2021-2031 ($MILLION)
- TABLE 10. RECOMMENDATION ENGINE MARKET FOR SMALL AND MEDIUM ENTERPRISES, BY REGION, 2021-2031 ($MILLION)
- TABLE 11. GLOBAL RECOMMENDATION ENGINE MARKET, BY APPLICATION, 2021-2031 ($MILLION)
- TABLE 12. RECOMMENDATION ENGINE MARKET FOR PERSONALIZED CAMPAIGNS AND CUSTOMER DELIVERY, BY REGION, 2021-2031 ($MILLION)
- TABLE 13. RECOMMENDATION ENGINE MARKET FOR STRATEGY OPERATIONS AND PLANNING, BY REGION, 2021-2031 ($MILLION)
- TABLE 14. RECOMMENDATION ENGINE MARKET FOR PRODUCT PLANNING AND PROACTIVE ASSET MANAGEMENT, BY REGION, 2021-2031 ($MILLION)
- TABLE 15. GLOBAL RECOMMENDATION ENGINE MARKET, BY INDUSTRY VERTICAL, 2021-2031 ($MILLION)
- TABLE 16. RECOMMENDATION ENGINE MARKET FOR RETAIL AND CONSUMER GOODS, BY REGION, 2021-2031 ($MILLION)
- TABLE 17. RECOMMENDATION ENGINE MARKET FOR IT AND TELECOM, BY REGION, 2021-2031 ($MILLION)
- TABLE 18. RECOMMENDATION ENGINE MARKET FOR HEALTHCARE AND LIFE SCIENCE, BY REGION, 2021-2031 ($MILLION)
- TABLE 19. RECOMMENDATION ENGINE MARKET FOR BFSI, BY REGION, 2021-2031 ($MILLION)
- TABLE 20. RECOMMENDATION ENGINE MARKET FOR MEDIA AND ENTERTAINMENT, BY REGION, 2021-2031 ($MILLION)
- TABLE 21. RECOMMENDATION ENGINE MARKET FOR OTHERS, BY REGION, 2021-2031 ($MILLION)
- TABLE 22. RECOMMENDATION ENGINE MARKET, BY REGION, 2021-2031 ($MILLION)
- TABLE 23. NORTH AMERICA RECOMMENDATION ENGINE MARKET, BY TYPE, 2021-2031 ($MILLION)
- TABLE 24. NORTH AMERICA RECOMMENDATION ENGINE MARKET, BY DEPLOYMENT MODEL, 2021-2031 ($MILLION)
- TABLE 25. NORTH AMERICA RECOMMENDATION ENGINE MARKET, BY ENTERPRISE SIZE, 2021-2031 ($MILLION)
- TABLE 26. NORTH AMERICA RECOMMENDATION ENGINE MARKET, BY APPLICATION, 2021-2031 ($MILLION)
- TABLE 27. NORTH AMERICA RECOMMENDATION ENGINE MARKET, BY INDUSTRY VERTICAL, 2021-2031 ($MILLION)
- TABLE 28. NORTH AMERICA RECOMMENDATION ENGINE MARKET, BY COUNTRY, 2021-2031 ($MILLION)
- TABLE 29. U.S. RECOMMENDATION ENGINE MARKET, BY TYPE, 2021-2031 ($MILLION)
- TABLE 30. U.S. RECOMMENDATION ENGINE MARKET, BY DEPLOYMENT MODEL, 2021-2031 ($MILLION)
- TABLE 31. U.S. RECOMMENDATION ENGINE MARKET, BY ENTERPRISE SIZE, 2021-2031 ($MILLION)
- TABLE 32. U.S. RECOMMENDATION ENGINE MARKET, BY APPLICATION, 2021-2031 ($MILLION)
- TABLE 33. U.S. RECOMMENDATION ENGINE MARKET, BY INDUSTRY VERTICAL, 2021-2031 ($MILLION)
- TABLE 34. CANADA RECOMMENDATION ENGINE MARKET, BY TYPE, 2021-2031 ($MILLION)
- TABLE 35. CANADA RECOMMENDATION ENGINE MARKET, BY DEPLOYMENT MODEL, 2021-2031 ($MILLION)
- TABLE 36. CANADA RECOMMENDATION ENGINE MARKET, BY ENTERPRISE SIZE, 2021-2031 ($MILLION)
- TABLE 37. CANADA RECOMMENDATION ENGINE MARKET, BY APPLICATION, 2021-2031 ($MILLION)
- TABLE 38. CANADA RECOMMENDATION ENGINE MARKET, BY INDUSTRY VERTICAL, 2021-2031 ($MILLION)
- TABLE 39. EUROPE RECOMMENDATION ENGINE MARKET, BY TYPE, 2021-2031 ($MILLION)
- TABLE 40. EUROPE RECOMMENDATION ENGINE MARKET, BY DEPLOYMENT MODEL, 2021-2031 ($MILLION)
- TABLE 41. EUROPE RECOMMENDATION ENGINE MARKET, BY ENTERPRISE SIZE, 2021-2031 ($MILLION)
- TABLE 42. EUROPE RECOMMENDATION ENGINE MARKET, BY APPLICATION, 2021-2031 ($MILLION)
- TABLE 43. EUROPE RECOMMENDATION ENGINE MARKET, BY INDUSTRY VERTICAL, 2021-2031 ($MILLION)
- TABLE 44. EUROPE RECOMMENDATION ENGINE MARKET, BY COUNTRY, 2021-2031 ($MILLION)
- TABLE 45. UK RECOMMENDATION ENGINE MARKET, BY TYPE, 2021-2031 ($MILLION)
- TABLE 46. UK RECOMMENDATION ENGINE MARKET, BY DEPLOYMENT MODEL, 2021-2031 ($MILLION)
- TABLE 47. UK RECOMMENDATION ENGINE MARKET, BY ENTERPRISE SIZE, 2021-2031 ($MILLION)
- TABLE 48. UK RECOMMENDATION ENGINE MARKET, BY APPLICATION, 2021-2031 ($MILLION)
- TABLE 49. UK RECOMMENDATION ENGINE MARKET, BY INDUSTRY VERTICAL, 2021-2031 ($MILLION)
- TABLE 50. GERMANY RECOMMENDATION ENGINE MARKET, BY TYPE, 2021-2031 ($MILLION)
- TABLE 51. GERMANY RECOMMENDATION ENGINE MARKET, BY DEPLOYMENT MODEL, 2021-2031 ($MILLION)
- TABLE 52. GERMANY RECOMMENDATION ENGINE MARKET, BY ENTERPRISE SIZE, 2021-2031 ($MILLION)
- TABLE 53. GERMANY RECOMMENDATION ENGINE MARKET, BY APPLICATION, 2021-2031 ($MILLION)
- TABLE 54. GERMANY RECOMMENDATION ENGINE MARKET, BY INDUSTRY VERTICAL, 2021-2031 ($MILLION)
- TABLE 55. FRANCE RECOMMENDATION ENGINE MARKET, BY TYPE, 2021-2031 ($MILLION)
- TABLE 56. FRANCE RECOMMENDATION ENGINE MARKET, BY DEPLOYMENT MODEL, 2021-2031 ($MILLION)
- TABLE 57. FRANCE RECOMMENDATION ENGINE MARKET, BY ENTERPRISE SIZE, 2021-2031 ($MILLION)
- TABLE 58. FRANCE RECOMMENDATION ENGINE MARKET, BY APPLICATION, 2021-2031 ($MILLION)
- TABLE 59. FRANCE RECOMMENDATION ENGINE MARKET, BY INDUSTRY VERTICAL, 2021-2031 ($MILLION)
- TABLE 60. ITALY RECOMMENDATION ENGINE MARKET, BY TYPE, 2021-2031 ($MILLION)
- TABLE 61. ITALY RECOMMENDATION ENGINE MARKET, BY DEPLOYMENT MODEL, 2021-2031 ($MILLION)
- TABLE 62. ITALY RECOMMENDATION ENGINE MARKET, BY ENTERPRISE SIZE, 2021-2031 ($MILLION)
- TABLE 63. ITALY RECOMMENDATION ENGINE MARKET, BY APPLICATION, 2021-2031 ($MILLION)
- TABLE 64. ITALY RECOMMENDATION ENGINE MARKET, BY INDUSTRY VERTICAL, 2021-2031 ($MILLION)
- TABLE 65. SPAIN RECOMMENDATION ENGINE MARKET, BY TYPE, 2021-2031 ($MILLION)
- TABLE 66. SPAIN RECOMMENDATION ENGINE MARKET, BY DEPLOYMENT MODEL, 2021-2031 ($MILLION)
- TABLE 67. SPAIN RECOMMENDATION ENGINE MARKET, BY ENTERPRISE SIZE, 2021-2031 ($MILLION)
- TABLE 68. SPAIN RECOMMENDATION ENGINE MARKET, BY APPLICATION, 2021-2031 ($MILLION)
- TABLE 69. SPAIN RECOMMENDATION ENGINE MARKET, BY INDUSTRY VERTICAL, 2021-2031 ($MILLION)
- TABLE 70. REST OF EUROPE RECOMMENDATION ENGINE MARKET, BY TYPE, 2021-2031 ($MILLION)
- TABLE 71. REST OF EUROPE RECOMMENDATION ENGINE MARKET, BY DEPLOYMENT MODEL, 2021-2031 ($MILLION)
- TABLE 72. REST OF EUROPE RECOMMENDATION ENGINE MARKET, BY ENTERPRISE SIZE, 2021-2031 ($MILLION)
- TABLE 73. REST OF EUROPE RECOMMENDATION ENGINE MARKET, BY APPLICATION, 2021-2031 ($MILLION)
- TABLE 74. REST OF EUROPE RECOMMENDATION ENGINE MARKET, BY INDUSTRY VERTICAL, 2021-2031 ($MILLION)
- TABLE 75. ASIA-PACIFIC RECOMMENDATION ENGINE MARKET, BY TYPE, 2021-2031 ($MILLION)
- TABLE 76. ASIA-PACIFIC RECOMMENDATION ENGINE MARKET, BY DEPLOYMENT MODEL, 2021-2031 ($MILLION)
- TABLE 77. ASIA-PACIFIC RECOMMENDATION ENGINE MARKET, BY ENTERPRISE SIZE, 2021-2031 ($MILLION)
- TABLE 78. ASIA-PACIFIC RECOMMENDATION ENGINE MARKET, BY APPLICATION, 2021-2031 ($MILLION)
- TABLE 79. ASIA-PACIFIC RECOMMENDATION ENGINE MARKET, BY INDUSTRY VERTICAL, 2021-2031 ($MILLION)
- TABLE 80. ASIA-PACIFIC RECOMMENDATION ENGINE MARKET, BY COUNTRY, 2021-2031 ($MILLION)
- TABLE 81. CHINA RECOMMENDATION ENGINE MARKET, BY TYPE, 2021-2031 ($MILLION)
- TABLE 82. CHINA RECOMMENDATION ENGINE MARKET, BY DEPLOYMENT MODEL, 2021-2031 ($MILLION)
- TABLE 83. CHINA RECOMMENDATION ENGINE MARKET, BY ENTERPRISE SIZE, 2021-2031 ($MILLION)
- TABLE 84. CHINA RECOMMENDATION ENGINE MARKET, BY APPLICATION, 2021-2031 ($MILLION)
- TABLE 85. CHINA RECOMMENDATION ENGINE MARKET, BY INDUSTRY VERTICAL, 2021-2031 ($MILLION)
- TABLE 86. JAPAN RECOMMENDATION ENGINE MARKET, BY TYPE, 2021-2031 ($MILLION)
- TABLE 87. JAPAN RECOMMENDATION ENGINE MARKET, BY DEPLOYMENT MODEL, 2021-2031 ($MILLION)
- TABLE 88. JAPAN RECOMMENDATION ENGINE MARKET, BY ENTERPRISE SIZE, 2021-2031 ($MILLION)
- TABLE 89. JAPAN RECOMMENDATION ENGINE MARKET, BY APPLICATION, 2021-2031 ($MILLION)
- TABLE 90. JAPAN RECOMMENDATION ENGINE MARKET, BY INDUSTRY VERTICAL, 2021-2031 ($MILLION)
- TABLE 91. SOUTH KOREA RECOMMENDATION ENGINE MARKET, BY TYPE, 2021-2031 ($MILLION)
- TABLE 92. SOUTH KOREA RECOMMENDATION ENGINE MARKET, BY DEPLOYMENT MODEL, 2021-2031 ($MILLION)
- TABLE 93. SOUTH KOREA RECOMMENDATION ENGINE MARKET, BY ENTERPRISE SIZE, 2021-2031 ($MILLION)
- TABLE 94. SOUTH KOREA RECOMMENDATION ENGINE MARKET, BY APPLICATION, 2021-2031 ($MILLION)
- TABLE 95. SOUTH KOREA RECOMMENDATION ENGINE MARKET, BY INDUSTRY VERTICAL, 2021-2031 ($MILLION)
- TABLE 96. INDIA RECOMMENDATION ENGINE MARKET, BY TYPE, 2021-2031 ($MILLION)
- TABLE 97. INDIA RECOMMENDATION ENGINE MARKET, BY DEPLOYMENT MODEL, 2021-2031 ($MILLION)
- TABLE 98. INDIA RECOMMENDATION ENGINE MARKET, BY ENTERPRISE SIZE, 2021-2031 ($MILLION)
- TABLE 99. INDIA RECOMMENDATION ENGINE MARKET, BY APPLICATION, 2021-2031 ($MILLION)
- TABLE 100. INDIA RECOMMENDATION ENGINE MARKET, BY INDUSTRY VERTICAL, 2021-2031 ($MILLION)
- TABLE 101. AUSTRALIA RECOMMENDATION ENGINE MARKET, BY TYPE, 2021-2031 ($MILLION)
- TABLE 102. AUSTRALIA RECOMMENDATION ENGINE MARKET, BY DEPLOYMENT MODEL, 2021-2031 ($MILLION)
- TABLE 103. AUSTRALIA RECOMMENDATION ENGINE MARKET, BY ENTERPRISE SIZE, 2021-2031 ($MILLION)
- TABLE 104. AUSTRALIA RECOMMENDATION ENGINE MARKET, BY APPLICATION, 2021-2031 ($MILLION)
- TABLE 105. AUSTRALIA RECOMMENDATION ENGINE MARKET, BY INDUSTRY VERTICAL, 2021-2031 ($MILLION)
- TABLE 106. REST OF ASIA-PACIFIC RECOMMENDATION ENGINE MARKET, BY TYPE, 2021-2031 ($MILLION)
- TABLE 107. REST OF ASIA-PACIFIC RECOMMENDATION ENGINE MARKET, BY DEPLOYMENT MODEL, 2021-2031 ($MILLION)
- TABLE 108. REST OF ASIA-PACIFIC RECOMMENDATION ENGINE MARKET, BY ENTERPRISE SIZE, 2021-2031 ($MILLION)
- TABLE 109. REST OF ASIA-PACIFIC RECOMMENDATION ENGINE MARKET, BY APPLICATION, 2021-2031 ($MILLION)
- TABLE 110. REST OF ASIA-PACIFIC RECOMMENDATION ENGINE MARKET, BY INDUSTRY VERTICAL, 2021-2031 ($MILLION)
- TABLE 111. LAMEA RECOMMENDATION ENGINE MARKET, BY TYPE, 2021-2031 ($MILLION)
- TABLE 112. LAMEA RECOMMENDATION ENGINE MARKET, BY DEPLOYMENT MODEL, 2021-2031 ($MILLION)
- TABLE 113. LAMEA RECOMMENDATION ENGINE MARKET, BY ENTERPRISE SIZE, 2021-2031 ($MILLION)
- TABLE 114. LAMEA RECOMMENDATION ENGINE MARKET, BY APPLICATION, 2021-2031 ($MILLION)
- TABLE 115. LAMEA RECOMMENDATION ENGINE MARKET, BY INDUSTRY VERTICAL, 2021-2031 ($MILLION)
- TABLE 116. LAMEA RECOMMENDATION ENGINE MARKET, BY COUNTRY, 2021-2031 ($MILLION)
- TABLE 117. LATIN AMERICA RECOMMENDATION ENGINE MARKET, BY TYPE, 2021-2031 ($MILLION)
- TABLE 118. LATIN AMERICA RECOMMENDATION ENGINE MARKET, BY DEPLOYMENT MODEL, 2021-2031 ($MILLION)
- TABLE 119. LATIN AMERICA RECOMMENDATION ENGINE MARKET, BY ENTERPRISE SIZE, 2021-2031 ($MILLION)
- TABLE 120. LATIN AMERICA RECOMMENDATION ENGINE MARKET, BY APPLICATION, 2021-2031 ($MILLION)
- TABLE 121. LATIN AMERICA RECOMMENDATION ENGINE MARKET, BY INDUSTRY VERTICAL, 2021-2031 ($MILLION)
- TABLE 122. MIDDLE EAST RECOMMENDATION ENGINE MARKET, BY TYPE, 2021-2031 ($MILLION)
- TABLE 123. MIDDLE EAST RECOMMENDATION ENGINE MARKET, BY DEPLOYMENT MODEL, 2021-2031 ($MILLION)
- TABLE 124. MIDDLE EAST RECOMMENDATION ENGINE MARKET, BY ENTERPRISE SIZE, 2021-2031 ($MILLION)
- TABLE 125. MIDDLE EAST RECOMMENDATION ENGINE MARKET, BY APPLICATION, 2021-2031 ($MILLION)
- TABLE 126. MIDDLE EAST RECOMMENDATION ENGINE MARKET, BY INDUSTRY VERTICAL, 2021-2031 ($MILLION)
- TABLE 127. AFRICA RECOMMENDATION ENGINE MARKET, BY TYPE, 2021-2031 ($MILLION)
- TABLE 128. AFRICA RECOMMENDATION ENGINE MARKET, BY DEPLOYMENT MODEL, 2021-2031 ($MILLION)
- TABLE 129. AFRICA RECOMMENDATION ENGINE MARKET, BY ENTERPRISE SIZE, 2021-2031 ($MILLION)
- TABLE 130. AFRICA RECOMMENDATION ENGINE MARKET, BY APPLICATION, 2021-2031 ($MILLION)
- TABLE 131. AFRICA RECOMMENDATION ENGINE MARKET, BY INDUSTRY VERTICAL, 2021-2031 ($MILLION)
- TABLE 132. ADOBE: KEY EXECUTIVES
- TABLE 133. ADOBE: COMPANY SNAPSHOT
- TABLE 134. ADOBE: SERVICE SEGMENTS
- TABLE 135. ADOBE: PRODUCT PORTFOLIO
- TABLE 136. ADOBE: KEY STRATERGIES
- TABLE 137. AMAZON WEB SERVICES: KEY EXECUTIVES
- TABLE 138. AMAZON WEB SERVICES: COMPANY SNAPSHOT
- TABLE 139. AMAZON WEB SERVICES: SERVICE SEGMENTS
- TABLE 140. AMAZON WEB SERVICES: PRODUCT PORTFOLIO
- TABLE 141. AMAZON WEB SERVICES: KEY STRATERGIES
- TABLE 142. GOOGLE LLC: KEY EXECUTIVES
- TABLE 143. GOOGLE LLC: COMPANY SNAPSHOT
- TABLE 144. GOOGLE LLC: SERVICE SEGMENTS
- TABLE 145. GOOGLE LLC: PRODUCT PORTFOLIO
- TABLE 146. GOOGLE LLC: KEY STRATERGIES
- TABLE 147. HEWLETT PACKARD ENTERPRISE DEVELOPMENT LP: KEY EXECUTIVES
- TABLE 148. HEWLETT PACKARD ENTERPRISE DEVELOPMENT LP: COMPANY SNAPSHOT
- TABLE 149. HEWLETT PACKARD ENTERPRISE DEVELOPMENT LP: SERVICE SEGMENTS
- TABLE 150. HEWLETT PACKARD ENTERPRISE DEVELOPMENT LP: PRODUCT PORTFOLIO
- TABLE 151. IBM CORPORATION: KEY EXECUTIVES
- TABLE 152. IBM CORPORATION: COMPANY SNAPSHOT
- TABLE 153. IBM CORPORATION: SERVICE SEGMENTS
- TABLE 154. IBM CORPORATION: PRODUCT PORTFOLIO
- TABLE 155. IBM CORPORATION: KEY STRATERGIES
- TABLE 156. INTEL CORPORATION: KEY EXECUTIVES
- TABLE 157. INTEL CORPORATION: COMPANY SNAPSHOT
- TABLE 158. INTEL CORPORATION: SERVICE SEGMENTS
- TABLE 159. INTEL CORPORATION: PRODUCT PORTFOLIO
- TABLE 160. INTEL CORPORATION: KEY STRATERGIES
- TABLE 161. MICROSOFT CORPORATION: KEY EXECUTIVES
- TABLE 162. MICROSOFT CORPORATION: COMPANY SNAPSHOT
- TABLE 163. MICROSOFT CORPORATION: SERVICE SEGMENTS
- TABLE 164. MICROSOFT CORPORATION: PRODUCT PORTFOLIO
- TABLE 165. MICROSOFT CORPORATION: KEY STRATERGIES
- TABLE 166. ORACLE CORPORATION: KEY EXECUTIVES
- TABLE 167. ORACLE CORPORATION: COMPANY SNAPSHOT
- TABLE 168. ORACLE CORPORATION: PRODUCT SEGMENTS
- TABLE 169. ORACLE CORPORATION: PRODUCT PORTFOLIO
- TABLE 170. ORACLE CORPORATION: KEY STRATERGIES
- TABLE 171. SALESFORCE, INC.: KEY EXECUTIVES
- TABLE 172. SALESFORCE, INC.: COMPANY SNAPSHOT
- TABLE 173. SALESFORCE, INC.: SERVICE SEGMENTS
- TABLE 174. SALESFORCE, INC.: PRODUCT PORTFOLIO
- TABLE 175. SALESFORCE, INC.: KEY STRATERGIES
- TABLE 176. SAP SE: KEY EXECUTIVES
- TABLE 177. SAP SE: COMPANY SNAPSHOT
- TABLE 178. SAP SE: SERVICE SEGMENTS
- TABLE 179. SAP SE: PRODUCT PORTFOLIO
- TABLE 180. SAP SE: KEY STRATERGIES
LIST OF FIGURES
- FIGURE 01. RECOMMENDATION ENGINE MARKET, 2021-2031
- FIGURE 02. SEGMENTATION OF RECOMMENDATION ENGINE MARKET, 2021-2031
- FIGURE 03. TOP INVESTMENT POCKETS IN RECOMMENDATION ENGINE MARKET (2022-2031)
- FIGURE 04. LOW BARGAINING POWER OF SUPPLIERS
- FIGURE 05. LOW BARGAINING POWER OF BUYERS
- FIGURE 06. LOW THREAT OF SUBSTITUTES
- FIGURE 07. LOW THREAT OF NEW ENTRANTS
- FIGURE 08. LOW INTENSITY OF RIVALRY
- FIGURE 09. DRIVERS, RESTRAINTS AND OPPORTUNITIES: GLOBALRECOMMENDATION ENGINE MARKET
- FIGURE 10. RECOMMENDATION ENGINE MARKET, BY TYPE, 2021(%)
- FIGURE 11. COMPARATIVE SHARE ANALYSIS OF RECOMMENDATION ENGINE MARKET FOR COLLABORATIVE FILTERING, BY COUNTRY 2021 AND 2031(%)
- FIGURE 12. COMPARATIVE SHARE ANALYSIS OF RECOMMENDATION ENGINE MARKET FOR CONTENT-BASED FILTERING, BY COUNTRY 2021 AND 2031(%)
- FIGURE 13. COMPARATIVE SHARE ANALYSIS OF RECOMMENDATION ENGINE MARKET FOR HYBRID RECOMMENDATION, BY COUNTRY 2021 AND 2031(%)
- FIGURE 14. RECOMMENDATION ENGINE MARKET, BY DEPLOYMENT MODEL, 2021(%)
- FIGURE 15. COMPARATIVE SHARE ANALYSIS OF RECOMMENDATION ENGINE MARKET FOR ON-PREMISES, BY COUNTRY 2021 AND 2031(%)
- FIGURE 16. COMPARATIVE SHARE ANALYSIS OF RECOMMENDATION ENGINE MARKET FOR CLOUD, BY COUNTRY 2021 AND 2031(%)
- FIGURE 17. RECOMMENDATION ENGINE MARKET, BY ENTERPRISE SIZE, 2021(%)
- FIGURE 18. COMPARATIVE SHARE ANALYSIS OF RECOMMENDATION ENGINE MARKET FOR LARGE ENTERPRISES, BY COUNTRY 2021 AND 2031(%)
- FIGURE 19. COMPARATIVE SHARE ANALYSIS OF RECOMMENDATION ENGINE MARKET FOR SMALL AND MEDIUM ENTERPRISES, BY COUNTRY 2021 AND 2031(%)
- FIGURE 20. RECOMMENDATION ENGINE MARKET, BY APPLICATION, 2021(%)
- FIGURE 21. COMPARATIVE SHARE ANALYSIS OF RECOMMENDATION ENGINE MARKET FOR PERSONALIZED CAMPAIGNS AND CUSTOMER DELIVERY, BY COUNTRY 2021 AND 2031(%)
- FIGURE 22. COMPARATIVE SHARE ANALYSIS OF RECOMMENDATION ENGINE MARKET FOR STRATEGY OPERATIONS AND PLANNING, BY COUNTRY 2021 AND 2031(%)
- FIGURE 23. COMPARATIVE SHARE ANALYSIS OF RECOMMENDATION ENGINE MARKET FOR PRODUCT PLANNING AND PROACTIVE ASSET MANAGEMENT, BY COUNTRY 2021 AND 2031(%)
- FIGURE 24. RECOMMENDATION ENGINE MARKET, BY INDUSTRY VERTICAL, 2021(%)
- FIGURE 25. COMPARATIVE SHARE ANALYSIS OF RECOMMENDATION ENGINE MARKET FOR RETAIL AND CONSUMER GOODS, BY COUNTRY 2021 AND 2031(%)
- FIGURE 26. COMPARATIVE SHARE ANALYSIS OF RECOMMENDATION ENGINE MARKET FOR IT AND TELECOM, BY COUNTRY 2021 AND 2031(%)
- FIGURE 27. COMPARATIVE SHARE ANALYSIS OF RECOMMENDATION ENGINE MARKET FOR HEALTHCARE AND LIFE SCIENCE, BY COUNTRY 2021 AND 2031(%)
- FIGURE 28. COMPARATIVE SHARE ANALYSIS OF RECOMMENDATION ENGINE MARKET FOR BFSI, BY COUNTRY 2021 AND 2031(%)
- FIGURE 29. COMPARATIVE SHARE ANALYSIS OF RECOMMENDATION ENGINE MARKET FOR MEDIA AND ENTERTAINMENT, BY COUNTRY 2021 AND 2031(%)
- FIGURE 30. COMPARATIVE SHARE ANALYSIS OF RECOMMENDATION ENGINE MARKET FOR OTHERS, BY COUNTRY 2021 AND 2031(%)
- FIGURE 31. RECOMMENDATION ENGINE MARKET BY REGION, 2021
- FIGURE 32. U.S. RECOMMENDATION ENGINE MARKET, 2021-2031 ($MILLION)
- FIGURE 33. CANADA RECOMMENDATION ENGINE MARKET, 2021-2031 ($MILLION)
- FIGURE 34. UK RECOMMENDATION ENGINE MARKET, 2021-2031 ($MILLION)
- FIGURE 35. GERMANY RECOMMENDATION ENGINE MARKET, 2021-2031 ($MILLION)
- FIGURE 36. FRANCE RECOMMENDATION ENGINE MARKET, 2021-2031 ($MILLION)
- FIGURE 37. ITALY RECOMMENDATION ENGINE MARKET, 2021-2031 ($MILLION)
- FIGURE 38. SPAIN RECOMMENDATION ENGINE MARKET, 2021-2031 ($MILLION)
- FIGURE 39. REST OF EUROPE RECOMMENDATION ENGINE MARKET, 2021-2031 ($MILLION)
- FIGURE 40. CHINA RECOMMENDATION ENGINE MARKET, 2021-2031 ($MILLION)
- FIGURE 41. JAPAN RECOMMENDATION ENGINE MARKET, 2021-2031 ($MILLION)
- FIGURE 42. SOUTH KOREA RECOMMENDATION ENGINE MARKET, 2021-2031 ($MILLION)
- FIGURE 43. INDIA RECOMMENDATION ENGINE MARKET, 2021-2031 ($MILLION)
- FIGURE 44. AUSTRALIA RECOMMENDATION ENGINE MARKET, 2021-2031 ($MILLION)
- FIGURE 45. REST OF ASIA-PACIFIC RECOMMENDATION ENGINE MARKET, 2021-2031 ($MILLION)
- FIGURE 46. LATIN AMERICA RECOMMENDATION ENGINE MARKET, 2021-2031 ($MILLION)
- FIGURE 47. MIDDLE EAST RECOMMENDATION ENGINE MARKET, 2021-2031 ($MILLION)
- FIGURE 48. AFRICA RECOMMENDATION ENGINE MARKET, 2021-2031 ($MILLION)
- FIGURE 49. TOP WINNING STRATEGIES, BY YEAR
- FIGURE 50. TOP WINNING STRATEGIES, BY DEVELOPMENT
- FIGURE 51. TOP WINNING STRATEGIES, BY COMPANY
- FIGURE 52. PRODUCT MAPPING OF TOP 10 PLAYERS
- FIGURE 53. COMPETITIVE DASHBOARD
- FIGURE 54. COMPETITIVE HEATMAP: RECOMMENDATION ENGINE MARKET
- FIGURE 55. TOP PLAYER POSITIONING, 2021
- FIGURE 56. ADOBE: NET REVENUE, 2019-2021 ($MILLION)
- FIGURE 57. ADOBE: RESEARCH & DEVELOPMENT EXPENDITURE, 2019-2021 ($MILLION)
- FIGURE 58. ADOBE: REVENUE SHARE BY SEGMENT, 2021 (%)
- FIGURE 59. ADOBE: REVENUE SHARE BY REGION, 2021 (%)
- FIGURE 60. AMAZON WEB SERVICES: NET REVENUE, 2019-2021 ($MILLION)
- FIGURE 61. AMAZON WEB SERVICES: REVENUE SHARE BY SEGMENT, 2021 (%)
- FIGURE 62. AMAZON WEB SERVICES: REVENUE SHARE BY REGION, 2021 (%)
- FIGURE 63. GOOGLE LLC: NET REVENUE, 2019-2021 ($MILLION)
- FIGURE 64. GOOGLE LLC: REVENUE SHARE BY SEGMENT, 2021 (%)
- FIGURE 65. GOOGLE LLC: REVENUE SHARE BY REGION, 2021 (%)
- FIGURE 66. HEWLETT PACKARD ENTERPRISE DEVELOPMENT LP: NET REVENUE, 2019-2021 ($MILLION)
- FIGURE 67. HEWLETT PACKARD ENTERPRISE DEVELOPMENT LP: RESEARCH & DEVELOPMENT EXPENDITURE, 2019-2021
- FIGURE 68. HEWLETT PACKARD ENTERPRISE DEVELOPMENT LP: REVENUE SHARE BY SEGMENT, 2021 (%)
- FIGURE 69. HEWLETT PACKARD ENTERPRISE DEVELOPMENT LP: REVENUE SHARE BY REGION, 2021 (%)
- FIGURE 70. IBM CORPORATION: NET REVENUE, 2020-2022 ($MILLION)
- FIGURE 71. IBM CORPORATION: RESEARCH & DEVELOPMENT EXPENDITURE, 2019-2021
- FIGURE 72. IBM CORPORATION: REVENUE SHARE BY REGION, 2022 (%)
- FIGURE 73. IBM CORPORATION: REVENUE SHARE BY SEGMENT, 2022 (%)
- FIGURE 74. INTEL CORPORATION: RESEARCH & DEVELOPMENT EXPENDITURE, 2020-2022 ($MILLION)
- FIGURE 75. INTEL CORPORATION: NET REVENUE, 2020-2022 ($MILLION)
- FIGURE 76. INTEL CORPORATION: REVENUE SHARE BY SEGMENT, 2022 (%)
- FIGURE 77. INTEL CORPORATION: REVENUE SHARE BY REGION, 2022 (%)
- FIGURE 78. MICROSOFT CORPORATION.: NET REVENUE, 2020-2022 ($BILLION)
- FIGURE 79. MICROSOFT CORPORATION.: RESEARCH & DEVELOPMENT EXPENDITURE, 2020-2022 ($BILLION)
- FIGURE 80. MICROSOFT CORPORATION.: REVENUE SHARE BY SEGMENT, 2022 (%)
- FIGURE 81. MICROSOFT CORPORATION.: REVENUE SHARE BY REGION, 2022 (%)
- FIGURE 82. ORACLE CORPORATION: NET REVENUE, 2020-2022 ($MILLION)
- FIGURE 83. ORACLE CORPORATION: RESEARCH & DEVELOPMENT EXPENDITURE, 2020-2022 ($MILLION)
- FIGURE 84. ORACLE CORPORATION: REVENUE SHARE BY SEGMENT, 2022 (%)
- FIGURE 85. ORACLE CORPORATION: REVENUE SHARE BY REGION, 2022 (%)
- FIGURE 86. SALESFORCE, INC.: NET REVENUE, 2019-2021 ($MILLION)
- FIGURE 87. SALESFORCE, INC.: REVENUE SHARE BY REGION, 2021 (%)
- FIGURE 88. SAP SE: NET REVENUE, 2020-2022 ($MILLION)
- FIGURE 89. SAP SE: RESEARCH & DEVELOPMENT EXPENDITURE, 2020-2022 ($MILLION)
- FIGURE 90. SAP SE: REVENUE SHARE BY SEGMENT, 2022 (%)
- FIGURE 91. SAP SE: REVENUE SHARE BY REGION, 2022 (%)


