


 |
市場調查報告書
商品編碼
1298371
緊急護理應用程序市場:按產品、治療領域:2023-2032 年全球機會分析和行業預測Urgent Care Apps Market By Product (Emergency Care Triage Apps, In-hospital Communication Apps, Post-hospital Apps), By Clinical area (Trauma, Stroke, Cardiac Conditions, Others): Global Opportunity Analysis and Industry Forecast, 2023-2032 |
||||||
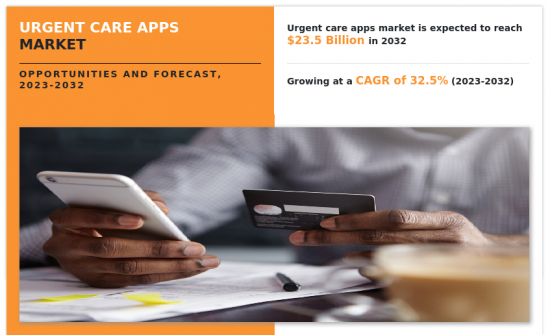
緊急護理應用市場預計到 2022 年將達到 14 億美元,到 2032 年將達到 235 億美元,2023 年至 2032 年的複合年增長率為 32.5%。
緊急護理應用程序有助於解決需要立即關注的醫療狀況。緊急護理應用程序是需要立即關注的醫療狀況的渠道。
此外,它還為心臟病和懷孕等健康狀況提供了低成本的選擇。為了向患者提供盡可能最好的服務,大多數醫療機構都在最大限度地使用緊急護理應用程序,以確保為患者提供最快的預約和最好的護理。這些應用程序將消費者從傳統治療轉向數字設備。由於創傷和其他疾病等危急情況的增加,緊急護理應用程序的使用正在增加。這些應用程序提供的藥物和篩查福利正在促進醫療保健行業的增長。這些應用程序對於在緊急情況下需要立即幫助的老年人特別有用。
慢性病患病率的激增、應用程序可用性和可負擔性的提高以及高級產品發布數量的增加推動了緊急護理應用程序市場的增長。此外,全球領先的醫療保健 IT 公司越來越注重收購提供測試解決方案的公司,預計這將為市場增長做出重大貢獻。例如,2022 年 3 月,專注於商業服務領域中型企業的大型投資公司 ICV Partners, LLC 決定收購 Urgent Care Group (UCG) 並將其與投資組合公司 Total Access Urgent Care (TAUC) 整合.宣布。
此外,全球緊急護理應用程序市場的增長是由緊急護理應用程序在數字世界中的重要應用、政府和私營實體針對大型緊急護理應用程序項目(3G、4G)的各種舉措和資金推動的。受到 5G 網絡越來越多的採用以及智能手機在人口中普及率不斷提高等因素的推動。為了加強市場地位並保持競爭環境,全球緊急護理應用程序市場的參與者正在進行各種投資,例如產品發布、收購以及研發投資,以推進他們的緊急護理應用程序。我們選擇不同的策略。
全球疾病患病率的驚人增長是推動市場增長的關鍵因素之一。然而,新興國家的互聯網連接較差限制了市場的增長。相反,智能手機用戶數量的不斷增長以及對藥物管理應用程序的認識,尤其是新興國家的患者,預計將在不久的將來為市場增長提供利潤豐厚的機會。醫療保健 IT 領域的廣泛研發活動預計將為市場擴張鋪平新的途徑,同時醫療保健基礎設施也將得到顯著改善。
緊急護理應用程序市場按產品、臨床領域和地區進行細分。從產品的角度來看,市場分為緊急護理分診應用程序、院內通信應用程序和院後應用程序。根據臨床領域,市場分為創傷、中風、心臟和其他。按地區劃分,北美(美國、瑪雅達、墨西哥)、歐洲(德國、法國、英國、意大利、西班牙、其他歐洲地區)、亞太地區(日本、中國、澳大利亞、印度、韓國、其他亞太地區)地區),我們正在亞太地區(巴西、南非、沙特阿拉伯和南美洲其他地區)進行研究。本報告中介紹的主要公司包括 AlayaCare、Allm Inc、Argusoft、Brave Care Inc、Epic Systems Corporation、Johnson & Johnson、Stryker Corporation、Teladoc Health, Inc、TigerConnect、Zocdoc, Inc。
目錄
第 1 章 簡介
第二章執行摘要
第三章市場概況
- 市場定義和範圍
- 主要發現
- 影響因素
- 主要投資機會
- 波特五力分析
- 供應商的議價能力
- 買方議價能力
- 替代品的威脅
- 新進入者的威脅
- 競爭強度
- 市場動態
- 促進者
- 智能手機使用量增加
- 4G 和 5G 網絡的滲透率提高
- 日益關注以患者為中心的醫療保健服務
- 阻礙因素
- 新興國家的互聯網連接較差
- 機會
- 人們對遠程醫療應用程序的認知度不斷提高
- 促進者
- COVID-19 市場影響分析
4. 緊急護理應用市場(按產品)
- 概述
- 市場規模及預測
- 緊急護理分診應用程序
- 主要市場趨勢、增長動力和機遇
- 市場規模/預測:按地區
- 市場份額分析:按國家分類
- 院內通訊應用程序
- 主要市場趨勢、增長動力和機遇
- 市場規模/預測:按地區
- 市場份額分析:按國家分類
- 醫院後應用程序
- 主要市場趨勢、增長動力和機遇
- 市場規模/預測:按地區
- 市場份額分析:按國家分類
5 緊急護理應用程序市場:按治療領域
- 概述
- 市場規模和預測
- 創傷
- 主要市場趨勢、增長動力和機遇
- 市場規模/預測:按地區
- 市場份額分析:按國家分類
- 中風
- 主要市場趨勢、增長動力和機遇
- 市場規模/預測:按地區
- 市場份額分析:按國家分類
- 心臟疾病
- 主要市場趨勢、增長動力和機遇
- 市場規模/預測:按地區
- 市場份額分析:按國家分類
- 其他
- 主要市場趨勢、增長動力和機遇
- 市場規模/預測:按地區
- 市場份額分析:按國家分類
6. 按地區劃分的緊急護理應用市場
- 概述
- 市場規模/預測:按地區
- 北美
- 主要趨勢和機遇
- 市場規模/預測:按產品分類
- 市場規模/預測:按臨床領域
- 市場規模/預測:按國家
- 美國
- 主要市場趨勢、增長動力和機遇
- 市場規模/預測:按產品分類
- 市場規模/預測:按臨床領域
- 加拿大
- 主要市場趨勢、增長動力和機遇
- 市場規模/預測:按產品分類
- 市場規模/預測:按臨床領域
- 墨西哥
- 主要市場趨勢、增長動力和機遇
- 市場規模/預測:按產品分類
- 市場規模/預測:按臨床領域
- 歐洲
- 主要趨勢和機遇
- 市場規模/預測:按產品分類
- 市場規模/預測:按臨床領域
- 市場規模/預測:按國家
- 德國
- 主要市場趨勢、增長動力和機遇
- 市場規模/預測:按產品分類
- 市場規模/預測:按臨床領域
- 法國
- 主要市場趨勢、增長動力和機遇
- 市場規模/預測:按產品分類
- 市場規模/預測:按臨床領域
- 英國
- 主要市場趨勢、增長動力和機遇
- 市場規模/預測:按產品分類
- 市場規模/預測:按臨床領域
- 意大利
- 主要市場趨勢、增長動力和機遇
- 市場規模/預測:按產品分類
- 市場規模/預測:按臨床領域
- 西班牙
- 主要市場趨勢、增長動力和機遇
- 市場規模/預測:按產品分類
- 市場規模/預測:按臨床領域
- 歐洲其他地區
- 主要市場趨勢、增長動力和機遇
- 市場規模/預測:按產品分類
- 市場規模/預測:按臨床領域
- 亞太地區
- 主要趨勢和機遇
- 市場規模/預測:按產品分類
- 市場規模/預測:按臨床領域
- 市場規模/預測:按國家
- 中國
- 主要市場趨勢、增長動力和機遇
- 市場規模/預測:按產品分類
- 市場規模/預測:按臨床領域
- 日本
- 主要市場趨勢、增長動力和機遇
- 市場規模/預測:按產品分類
- 市場規模/預測:按臨床領域
- 印度
- 主要市場趨勢、增長動力和機遇
- 市場規模/預測:按產品分類
- 市場規模/預測:按臨床領域
- 澳大利亞
- 主要市場趨勢、增長動力和機遇
- 市場規模/預測:按產品分類
- 市場規模/預測:按臨床領域
- 韓國
- 主要市場趨勢、增長動力和機遇
- 市場規模/預測:按產品分類
- 市場規模/預測:按臨床領域
- 亞太其他地區
- 主要市場趨勢、增長動力和機遇
- 市場規模/預測:按產品分類
- 市場規模/預測:按臨床領域
- 拉丁美洲/中東/非洲
- 主要趨勢和機遇
- 市場規模/預測:按產品分類
- 市場規模/預測:按臨床領域
- 市場規模/預測:按國家
- 巴西
- 主要市場趨勢、增長動力和機遇
- 市場規模/預測:按產品分類
- 市場規模/預測:按臨床領域
- 沙特阿拉伯
- 主要市場趨勢、增長動力和機遇
- 市場規模/預測:按產品分類
- 市場規模/預測:按臨床領域
- 南非
- 主要市場趨勢、增長動力和機遇
- 市場規模/預測:按產品分類
- 市場規模/預測:按臨床領域
- 其他地區
- 主要市場趨勢、增長動力和機遇
- 市場規模/預測:按產品分類
- 市場規模/預測:按臨床領域
第7章 競爭格局
- 介紹
- 關鍵成功策略
- 10大公司產品圖
- 比賽儀表板
- 比賽熱圖
- 2022 年頂級公司定位
第八章公司簡介
- Allm Inc.
- Stryker Corporation
- Johnson & Johnson
- AlayaCare
- TigerConnect
- Teladoc Health, Inc.
- Argusoft
- Zocdoc, Inc.
- Brave Care, Inc
- Epic Systems Corporation
The Urgent Care Apps Market valued for $1.4 billion in 2022 and is estimated to reach $23.5 billion by 2032, exhibiting a CAGR of 32.5% from 2023 to 2032. Urgent care apps are beneficial in handling medical conditions that need an immediate response. They function as a pathway for medical conditions that require instant actions.
Moreover, they offer low-cost options for health conditions, such as cardiac diseases and pregnancy. The majority of healthcare organizations make the best use of urgent care apps for delivering the best services to patients, and arranging the appointment at the earliest, to provide the best care to patients. These apps shift consumers from traditional treatment to digital devices. The increase in severe conditions such as trauma and other diseases has improved the use of urgent care apps. The benefits offered by these apps for the medicinal dosage and check-ups contribute to the growth of the healthcare sector. These apps are useful, especially for older people who need immediate help during emergencies.
The growth of the urgent care apps market is driven by surge in incidence of chronic diseases, increase in availability & affordability of apps, and rise in number of advanced product launches. Moreover, large healthcare IT firms all over the world increasingly focus on acquiring companies that provide solutions for the tests, which is expected to notably contribute toward the market growth. For instance, in March 2022, ICV Partners, LLC, a leading investment firm focused on lower middle market companies in business services, announced the acquisition of Urgent Care Group (UCG) and its combination with portfolio company Total Access Urgent Care (TAUC).
Furthermore, the global urgent care apps market growth is largely driven by factors such as significant applications of urgent care apps in digital world, various initiatives & funding from government & private bodies for large-scale urgent care apps projects, rise in adoption of the 3G, 4G, and 5G networks and the increase in penetration of the smartphones among the population. Prominent players in the global urgent care apps market have opted various strategies such as product launches, acquisition, and investments in R&D for advancement in urgent care apps to strengthen their position in the market and sustain the competitive environment.
An alarming increase in prevalence of diseases across the globe is one of the key factors that drive the growth of the market. However, the poor internet connectivity in developing countries restricts market growth. Conversely, the increase in population of smart phone users and the awareness about medication management apps, especially among patients in emerging nations, are expected to provide lucrative opportunities for the growth of the market in the near future. Extensive R&D activities in the field of healthcare IT along with significant improvement in healthcare infrastructure are anticipated to open new avenues for the expansion of the market.
The urgent care apps market is segmented on the basis of product, clinical area, and region. On the basis of product, the market is categorized into emergency care triage apps, in-hospital communication apps and post-hospital apps. On the basis of clinical area, the market is classified into trauma, stroke, cardiac conditions, others. On the basis of region, the market is studied across North America (the U.S., Mayada, and Mexico), Europe (Germany, France, the UK, Italy, Spain, and Rest of Europe), Asia-Pacific (Japan, China, Australia, India, South Korea, and Rest of Asia-Pacific), and LAMEA (Brazil, South Africa, Saudi Arabia, and rest of LAMEA). Major companies profiled in the report include AlayaCare, Allm Inc, Argusoft, Brave Care Inc, Epic Systems Corporation, Johnson & Johnson, Stryker Corporation, Teladoc Health, Inc., TigerConnect, and Zocdoc, Inc.
Key Benefits For Stakeholders
- This report provides a quantitative analysis of the market segments, current trends, estimations, and dynamics of the urgent care apps market analysis from 2022 to 2032 to identify the prevailing urgent care apps market opportunities.
- The market research is offered along with information related to key drivers, restraints, and opportunities.
- Porter's five forces analysis highlights the potency of buyers and suppliers to enable stakeholders make profit-oriented business decisions and strengthen their supplier-buyer network.
- In-depth analysis of the urgent care apps market segmentation assists to determine the prevailing market opportunities.
- Major countries in each region are mapped according to their revenue contribution to the global market.
- Market player positioning facilitates benchmarking and provides a clear understanding of the present position of the market players.
- The report includes the analysis of the regional as well as global urgent care apps market trends, key players, market segments, application areas, and market growth strategies.
Key Market Segments
By Clinical area
- Trauma
- Stroke
- Cardiac Conditions
- Others
By Product
- Emergency Care Triage Apps
- In-hospital Communication Apps
- Post-hospital Apps
By Region
- North America
- U.S.
- Canada
- Mexico
- Europe
- Germany
- France
- UK
- Italy
- Spain
- Rest of Europe
- Asia-Pacific
- China
- Japan
- India
- Australia
- South Korea
- Rest of Asia-Pacific
- LAMEA
- Brazil
- Saudi Arabia
- South Africa
- Rest of LAMEA
Key Market Players:
- AlayaCare
- Allm Inc.
- Argusoft
- Brave Care, Inc
- Epic Systems Corporation
- Johnson & Johnson
- Stryker Corporation
- Teladoc Health, Inc.
- TigerConnect
- Zocdoc, Inc.
TABLE OF CONTENTS
CHAPTER 1: INTRODUCTION
- 1.1. Report description
- 1.2. Key market segments
- 1.3. Key benefits to the stakeholders
- 1.4. Research Methodology
- 1.4.1. Primary research
- 1.4.2. Secondary research
- 1.4.3. Analyst tools and models
CHAPTER 2: EXECUTIVE SUMMARY
- 2.1. CXO Perspective
CHAPTER 3: MARKET OVERVIEW
- 3.1. Market definition and scope
- 3.2. Key findings
- 3.2.1. Top impacting factors
- 3.2.2. Top investment pockets
- 3.3. Porter's five forces analysis
- 3.3.1. Bargaining power of suppliers
- 3.3.2. Bargaining power of buyers
- 3.3.3. Threat of substitutes
- 3.3.4. Threat of new entrants
- 3.3.5. Intensity of rivalry
- 3.4. Market dynamics
- 3.4.1. Drivers
- 3.4.1.1. Increase in use of smartphones
- 3.4.1.2. Growth in penetration of 4G and 5G networks
- 3.4.1.3. Rise in focus on patient-centric healthcare delivery
- 3.4.1. Drivers
- 3.4.2. Restraints
- 3.4.2.1. The poor internet connectivity in developing countries
- 3.4.3. Opportunities
- 3.4.3.1. Surge in awareness about telehealth apps
- 3.5. COVID-19 Impact Analysis on the market
CHAPTER 4: URGENT CARE APPS MARKET, BY PRODUCT
- 4.1. Overview
- 4.1.1. Market size and forecast
- 4.2. Emergency Care Triage Apps
- 4.2.1. Key market trends, growth factors and opportunities
- 4.2.2. Market size and forecast, by region
- 4.2.3. Market share analysis by country
- 4.3. In-hospital Communication Apps
- 4.3.1. Key market trends, growth factors and opportunities
- 4.3.2. Market size and forecast, by region
- 4.3.3. Market share analysis by country
- 4.4. Post-hospital Apps
- 4.4.1. Key market trends, growth factors and opportunities
- 4.4.2. Market size and forecast, by region
- 4.4.3. Market share analysis by country
CHAPTER 5: URGENT CARE APPS MARKET, BY CLINICAL AREA
- 5.1. Overview
- 5.1.1. Market size and forecast
- 5.2. Trauma
- 5.2.1. Key market trends, growth factors and opportunities
- 5.2.2. Market size and forecast, by region
- 5.2.3. Market share analysis by country
- 5.3. Stroke
- 5.3.1. Key market trends, growth factors and opportunities
- 5.3.2. Market size and forecast, by region
- 5.3.3. Market share analysis by country
- 5.4. Cardiac Conditions
- 5.4.1. Key market trends, growth factors and opportunities
- 5.4.2. Market size and forecast, by region
- 5.4.3. Market share analysis by country
- 5.5. Others
- 5.5.1. Key market trends, growth factors and opportunities
- 5.5.2. Market size and forecast, by region
- 5.5.3. Market share analysis by country
CHAPTER 6: URGENT CARE APPS MARKET, BY REGION
- 6.1. Overview
- 6.1.1. Market size and forecast By Region
- 6.2. North America
- 6.2.1. Key trends and opportunities
- 6.2.2. Market size and forecast, by Product
- 6.2.3. Market size and forecast, by Clinical area
- 6.2.4. Market size and forecast, by country
- 6.2.4.1. U.S.
- 6.2.4.1.1. Key market trends, growth factors and opportunities
- 6.2.4.1.2. Market size and forecast, by Product
- 6.2.4.1.3. Market size and forecast, by Clinical area
- 6.2.4.2. Canada
- 6.2.4.2.1. Key market trends, growth factors and opportunities
- 6.2.4.2.2. Market size and forecast, by Product
- 6.2.4.2.3. Market size and forecast, by Clinical area
- 6.2.4.3. Mexico
- 6.2.4.3.1. Key market trends, growth factors and opportunities
- 6.2.4.3.2. Market size and forecast, by Product
- 6.2.4.3.3. Market size and forecast, by Clinical area
- 6.3. Europe
- 6.3.1. Key trends and opportunities
- 6.3.2. Market size and forecast, by Product
- 6.3.3. Market size and forecast, by Clinical area
- 6.3.4. Market size and forecast, by country
- 6.3.4.1. Germany
- 6.3.4.1.1. Key market trends, growth factors and opportunities
- 6.3.4.1.2. Market size and forecast, by Product
- 6.3.4.1.3. Market size and forecast, by Clinical area
- 6.3.4.2. France
- 6.3.4.2.1. Key market trends, growth factors and opportunities
- 6.3.4.2.2. Market size and forecast, by Product
- 6.3.4.2.3. Market size and forecast, by Clinical area
- 6.3.4.3. UK
- 6.3.4.3.1. Key market trends, growth factors and opportunities
- 6.3.4.3.2. Market size and forecast, by Product
- 6.3.4.3.3. Market size and forecast, by Clinical area
- 6.3.4.4. Italy
- 6.3.4.4.1. Key market trends, growth factors and opportunities
- 6.3.4.4.2. Market size and forecast, by Product
- 6.3.4.4.3. Market size and forecast, by Clinical area
- 6.3.4.5. Spain
- 6.3.4.5.1. Key market trends, growth factors and opportunities
- 6.3.4.5.2. Market size and forecast, by Product
- 6.3.4.5.3. Market size and forecast, by Clinical area
- 6.3.4.6. Rest of Europe
- 6.3.4.6.1. Key market trends, growth factors and opportunities
- 6.3.4.6.2. Market size and forecast, by Product
- 6.3.4.6.3. Market size and forecast, by Clinical area
- 6.4. Asia-Pacific
- 6.4.1. Key trends and opportunities
- 6.4.2. Market size and forecast, by Product
- 6.4.3. Market size and forecast, by Clinical area
- 6.4.4. Market size and forecast, by country
- 6.4.4.1. China
- 6.4.4.1.1. Key market trends, growth factors and opportunities
- 6.4.4.1.2. Market size and forecast, by Product
- 6.4.4.1.3. Market size and forecast, by Clinical area
- 6.4.4.2. Japan
- 6.4.4.2.1. Key market trends, growth factors and opportunities
- 6.4.4.2.2. Market size and forecast, by Product
- 6.4.4.2.3. Market size and forecast, by Clinical area
- 6.4.4.3. India
- 6.4.4.3.1. Key market trends, growth factors and opportunities
- 6.4.4.3.2. Market size and forecast, by Product
- 6.4.4.3.3. Market size and forecast, by Clinical area
- 6.4.4.4. Australia
- 6.4.4.4.1. Key market trends, growth factors and opportunities
- 6.4.4.4.2. Market size and forecast, by Product
- 6.4.4.4.3. Market size and forecast, by Clinical area
- 6.4.4.5. South Korea
- 6.4.4.5.1. Key market trends, growth factors and opportunities
- 6.4.4.5.2. Market size and forecast, by Product
- 6.4.4.5.3. Market size and forecast, by Clinical area
- 6.4.4.6. Rest of Asia-Pacific
- 6.4.4.6.1. Key market trends, growth factors and opportunities
- 6.4.4.6.2. Market size and forecast, by Product
- 6.4.4.6.3. Market size and forecast, by Clinical area
- 6.5. LAMEA
- 6.5.1. Key trends and opportunities
- 6.5.2. Market size and forecast, by Product
- 6.5.3. Market size and forecast, by Clinical area
- 6.5.4. Market size and forecast, by country
- 6.5.4.1. Brazil
- 6.5.4.1.1. Key market trends, growth factors and opportunities
- 6.5.4.1.2. Market size and forecast, by Product
- 6.5.4.1.3. Market size and forecast, by Clinical area
- 6.5.4.2. Saudi Arabia
- 6.5.4.2.1. Key market trends, growth factors and opportunities
- 6.5.4.2.2. Market size and forecast, by Product
- 6.5.4.2.3. Market size and forecast, by Clinical area
- 6.5.4.3. South Africa
- 6.5.4.3.1. Key market trends, growth factors and opportunities
- 6.5.4.3.2. Market size and forecast, by Product
- 6.5.4.3.3. Market size and forecast, by Clinical area
- 6.5.4.4. Rest of LAMEA
- 6.5.4.4.1. Key market trends, growth factors and opportunities
- 6.5.4.4.2. Market size and forecast, by Product
- 6.5.4.4.3. Market size and forecast, by Clinical area
CHAPTER 7: COMPETITIVE LANDSCAPE
- 7.1. Introduction
- 7.2. Top winning strategies
- 7.3. Product Mapping of Top 10 Player
- 7.4. Competitive Dashboard
- 7.5. Competitive Heatmap
- 7.6. Top player positioning, 2022
CHAPTER 8: COMPANY PROFILES
- 8.1. Allm Inc.
- 8.1.1. Company overview
- 8.1.2. Key Executives
- 8.1.3. Company snapshot
- 8.1.4. Operating business segments
- 8.1.5. Product portfolio
- 8.2. Stryker Corporation
- 8.2.1. Company overview
- 8.2.2. Key Executives
- 8.2.3. Company snapshot
- 8.2.4. Operating business segments
- 8.2.5. Product portfolio
- 8.2.6. Business performance
- 8.2.7. Key strategic moves and developments
- 8.3. Johnson & Johnson
- 8.3.1. Company overview
- 8.3.2. Key Executives
- 8.3.3. Company snapshot
- 8.3.4. Operating business segments
- 8.3.5. Product portfolio
- 8.3.6. Business performance
- 8.4. AlayaCare
- 8.4.1. Company overview
- 8.4.2. Key Executives
- 8.4.3. Company snapshot
- 8.4.4. Operating business segments
- 8.4.5. Product portfolio
- 8.4.6. Key strategic moves and developments
- 8.5. TigerConnect
- 8.5.1. Company overview
- 8.5.2. Key Executives
- 8.5.3. Company snapshot
- 8.5.4. Operating business segments
- 8.5.5. Product portfolio
- 8.5.6. Key strategic moves and developments
- 8.6. Teladoc Health, Inc.
- 8.6.1. Company overview
- 8.6.2. Key Executives
- 8.6.3. Company snapshot
- 8.6.4. Operating business segments
- 8.6.5. Product portfolio
- 8.6.6. Business performance
- 8.6.7. Key strategic moves and developments
- 8.7. Argusoft
- 8.7.1. Company overview
- 8.7.2. Key Executives
- 8.7.3. Company snapshot
- 8.7.4. Operating business segments
- 8.7.5. Product portfolio
- 8.8. Zocdoc, Inc.
- 8.8.1. Company overview
- 8.8.2. Key Executives
- 8.8.3. Company snapshot
- 8.8.4. Operating business segments
- 8.8.5. Product portfolio
- 8.9. Brave Care, Inc
- 8.9.1. Company overview
- 8.9.2. Key Executives
- 8.9.3. Company snapshot
- 8.9.4. Operating business segments
- 8.9.5. Product portfolio
- 8.10. Epic Systems Corporation
- 8.10.1. Company overview
- 8.10.2. Key Executives
- 8.10.3. Company snapshot
- 8.10.4. Operating business segments
- 8.10.5. Product portfolio
LIST OF TABLES
- TABLE 01. GLOBAL URGENT CARE APPS MARKET, BY PRODUCT, 2022-2032 ($MILLION)
- TABLE 02. URGENT CARE APPS MARKET FOR EMERGENCY CARE TRIAGE APPS, BY REGION, 2022-2032 ($MILLION)
- TABLE 03. URGENT CARE APPS MARKET FOR IN-HOSPITAL COMMUNICATION APPS, BY REGION, 2022-2032 ($MILLION)
- TABLE 04. URGENT CARE APPS MARKET FOR POST-HOSPITAL APPS, BY REGION, 2022-2032 ($MILLION)
- TABLE 05. GLOBAL URGENT CARE APPS MARKET, BY CLINICAL AREA, 2022-2032 ($MILLION)
- TABLE 06. URGENT CARE APPS MARKET FOR TRAUMA, BY REGION, 2022-2032 ($MILLION)
- TABLE 07. URGENT CARE APPS MARKET FOR STROKE, BY REGION, 2022-2032 ($MILLION)
- TABLE 08. URGENT CARE APPS MARKET FOR CARDIAC CONDITIONS, BY REGION, 2022-2032 ($MILLION)
- TABLE 09. URGENT CARE APPS MARKET FOR OTHERS, BY REGION, 2022-2032 ($MILLION)
- TABLE 10. URGENT CARE APPS MARKET, BY REGION, 2022-2032 ($MILLION)
- TABLE 11. NORTH AMERICA URGENT CARE APPS MARKET, BY PRODUCT, 2022-2032 ($MILLION)
- TABLE 12. NORTH AMERICA URGENT CARE APPS MARKET, BY CLINICAL AREA, 2022-2032 ($MILLION)
- TABLE 13. NORTH AMERICA URGENT CARE APPS MARKET, BY COUNTRY, 2022-2032 ($MILLION)
- TABLE 14. U.S. URGENT CARE APPS MARKET, BY PRODUCT, 2022-2032 ($MILLION)
- TABLE 15. U.S. URGENT CARE APPS MARKET, BY CLINICAL AREA, 2022-2032 ($MILLION)
- TABLE 16. CANADA URGENT CARE APPS MARKET, BY PRODUCT, 2022-2032 ($MILLION)
- TABLE 17. CANADA URGENT CARE APPS MARKET, BY CLINICAL AREA, 2022-2032 ($MILLION)
- TABLE 18. MEXICO URGENT CARE APPS MARKET, BY PRODUCT, 2022-2032 ($MILLION)
- TABLE 19. MEXICO URGENT CARE APPS MARKET, BY CLINICAL AREA, 2022-2032 ($MILLION)
- TABLE 20. EUROPE URGENT CARE APPS MARKET, BY PRODUCT, 2022-2032 ($MILLION)
- TABLE 21. EUROPE URGENT CARE APPS MARKET, BY CLINICAL AREA, 2022-2032 ($MILLION)
- TABLE 22. EUROPE URGENT CARE APPS MARKET, BY COUNTRY, 2022-2032 ($MILLION)
- TABLE 23. GERMANY URGENT CARE APPS MARKET, BY PRODUCT, 2022-2032 ($MILLION)
- TABLE 24. GERMANY URGENT CARE APPS MARKET, BY CLINICAL AREA, 2022-2032 ($MILLION)
- TABLE 25. FRANCE URGENT CARE APPS MARKET, BY PRODUCT, 2022-2032 ($MILLION)
- TABLE 26. FRANCE URGENT CARE APPS MARKET, BY CLINICAL AREA, 2022-2032 ($MILLION)
- TABLE 27. UK URGENT CARE APPS MARKET, BY PRODUCT, 2022-2032 ($MILLION)
- TABLE 28. UK URGENT CARE APPS MARKET, BY CLINICAL AREA, 2022-2032 ($MILLION)
- TABLE 29. ITALY URGENT CARE APPS MARKET, BY PRODUCT, 2022-2032 ($MILLION)
- TABLE 30. ITALY URGENT CARE APPS MARKET, BY CLINICAL AREA, 2022-2032 ($MILLION)
- TABLE 31. SPAIN URGENT CARE APPS MARKET, BY PRODUCT, 2022-2032 ($MILLION)
- TABLE 32. SPAIN URGENT CARE APPS MARKET, BY CLINICAL AREA, 2022-2032 ($MILLION)
- TABLE 33. REST OF EUROPE URGENT CARE APPS MARKET, BY PRODUCT, 2022-2032 ($MILLION)
- TABLE 34. REST OF EUROPE URGENT CARE APPS MARKET, BY CLINICAL AREA, 2022-2032 ($MILLION)
- TABLE 35. ASIA-PACIFIC URGENT CARE APPS MARKET, BY PRODUCT, 2022-2032 ($MILLION)
- TABLE 36. ASIA-PACIFIC URGENT CARE APPS MARKET, BY CLINICAL AREA, 2022-2032 ($MILLION)
- TABLE 37. ASIA-PACIFIC URGENT CARE APPS MARKET, BY COUNTRY, 2022-2032 ($MILLION)
- TABLE 38. CHINA URGENT CARE APPS MARKET, BY PRODUCT, 2022-2032 ($MILLION)
- TABLE 39. CHINA URGENT CARE APPS MARKET, BY CLINICAL AREA, 2022-2032 ($MILLION)
- TABLE 40. JAPAN URGENT CARE APPS MARKET, BY PRODUCT, 2022-2032 ($MILLION)
- TABLE 41. JAPAN URGENT CARE APPS MARKET, BY CLINICAL AREA, 2022-2032 ($MILLION)
- TABLE 42. INDIA URGENT CARE APPS MARKET, BY PRODUCT, 2022-2032 ($MILLION)
- TABLE 43. INDIA URGENT CARE APPS MARKET, BY CLINICAL AREA, 2022-2032 ($MILLION)
- TABLE 44. AUSTRALIA URGENT CARE APPS MARKET, BY PRODUCT, 2022-2032 ($MILLION)
- TABLE 45. AUSTRALIA URGENT CARE APPS MARKET, BY CLINICAL AREA, 2022-2032 ($MILLION)
- TABLE 46. SOUTH KOREA URGENT CARE APPS MARKET, BY PRODUCT, 2022-2032 ($MILLION)
- TABLE 47. SOUTH KOREA URGENT CARE APPS MARKET, BY CLINICAL AREA, 2022-2032 ($MILLION)
- TABLE 48. REST OF ASIA-PACIFIC URGENT CARE APPS MARKET, BY PRODUCT, 2022-2032 ($MILLION)
- TABLE 49. REST OF ASIA-PACIFIC URGENT CARE APPS MARKET, BY CLINICAL AREA, 2022-2032 ($MILLION)
- TABLE 50. LAMEA URGENT CARE APPS MARKET, BY PRODUCT, 2022-2032 ($MILLION)
- TABLE 51. LAMEA URGENT CARE APPS MARKET, BY CLINICAL AREA, 2022-2032 ($MILLION)
- TABLE 52. LAMEA URGENT CARE APPS MARKET, BY COUNTRY, 2022-2032 ($MILLION)
- TABLE 53. BRAZIL URGENT CARE APPS MARKET, BY PRODUCT, 2022-2032 ($MILLION)
- TABLE 54. BRAZIL URGENT CARE APPS MARKET, BY CLINICAL AREA, 2022-2032 ($MILLION)
- TABLE 55. SAUDI ARABIA URGENT CARE APPS MARKET, BY PRODUCT, 2022-2032 ($MILLION)
- TABLE 56. SAUDI ARABIA URGENT CARE APPS MARKET, BY CLINICAL AREA, 2022-2032 ($MILLION)
- TABLE 57. SOUTH AFRICA URGENT CARE APPS MARKET, BY PRODUCT, 2022-2032 ($MILLION)
- TABLE 58. SOUTH AFRICA URGENT CARE APPS MARKET, BY CLINICAL AREA, 2022-2032 ($MILLION)
- TABLE 59. REST OF LAMEA URGENT CARE APPS MARKET, BY PRODUCT, 2022-2032 ($MILLION)
- TABLE 60. REST OF LAMEA URGENT CARE APPS MARKET, BY CLINICAL AREA, 2022-2032 ($MILLION)
- TABLE 61. ALLM INC.: KEY EXECUTIVES
- TABLE 62. ALLM INC.: COMPANY SNAPSHOT
- TABLE 63. ALLM INC.: SERVICE SEGMENTS
- TABLE 64. ALLM INC.: PRODUCT PORTFOLIO
- TABLE 65. STRYKER CORPORATION: KEY EXECUTIVES
- TABLE 66. STRYKER CORPORATION: COMPANY SNAPSHOT
- TABLE 67. STRYKER CORPORATION: PRODUCT SEGMENTS
- TABLE 68. STRYKER CORPORATION: PRODUCT PORTFOLIO
- TABLE 69. STRYKER CORPORATION: KEY STRATERGIES
- TABLE 70. JOHNSON & JOHNSON: KEY EXECUTIVES
- TABLE 71. JOHNSON & JOHNSON: COMPANY SNAPSHOT
- TABLE 72. JOHNSON & JOHNSON: PRODUCT SEGMENTS
- TABLE 73. JOHNSON & JOHNSON: PRODUCT PORTFOLIO
- TABLE 74. ALAYACARE: KEY EXECUTIVES
- TABLE 75. ALAYACARE: COMPANY SNAPSHOT
- TABLE 76. ALAYACARE: PRODUCT SEGMENTS
- TABLE 77. ALAYACARE: PRODUCT PORTFOLIO
- TABLE 78. ALAYACARE: KEY STRATERGIES
- TABLE 79. TIGERCONNECT: KEY EXECUTIVES
- TABLE 80. TIGERCONNECT: COMPANY SNAPSHOT
- TABLE 81. TIGERCONNECT: PRODUCT SEGMENTS
- TABLE 82. TIGERCONNECT: PRODUCT PORTFOLIO
- TABLE 83. TIGERCONNECT: KEY STRATERGIES
- TABLE 84. TELADOC HEALTH, INC.: KEY EXECUTIVES
- TABLE 85. TELADOC HEALTH, INC.: COMPANY SNAPSHOT
- TABLE 86. TELADOC HEALTH, INC.: PRODUCT SEGMENTS
- TABLE 87. TELADOC HEALTH, INC.: PRODUCT PORTFOLIO
- TABLE 88. TELADOC HEALTH, INC.: KEY STRATERGIES
- TABLE 89. ARGUSOFT: KEY EXECUTIVES
- TABLE 90. ARGUSOFT: COMPANY SNAPSHOT
- TABLE 91. ARGUSOFT: SERVICE SEGMENTS
- TABLE 92. ARGUSOFT: PRODUCT PORTFOLIO
- TABLE 93. ZOCDOC, INC.: KEY EXECUTIVES
- TABLE 94. ZOCDOC, INC.: COMPANY SNAPSHOT
- TABLE 95. ZOCDOC, INC.: SERVICE SEGMENTS
- TABLE 96. ZOCDOC, INC.: PRODUCT PORTFOLIO
- TABLE 97. BRAVE CARE, INC: KEY EXECUTIVES
- TABLE 98. BRAVE CARE, INC: COMPANY SNAPSHOT
- TABLE 99. BRAVE CARE, INC: SERVICE SEGMENTS
- TABLE 100. BRAVE CARE, INC: PRODUCT PORTFOLIO
- TABLE 101. EPIC SYSTEMS CORPORATION: KEY EXECUTIVES
- TABLE 102. EPIC SYSTEMS CORPORATION: COMPANY SNAPSHOT
- TABLE 103. EPIC SYSTEMS CORPORATION: SERVICE SEGMENTS
- TABLE 104. EPIC SYSTEMS CORPORATION: PRODUCT PORTFOLIO
LIST OF FIGURES
- FIGURE 01. URGENT CARE APPS MARKET, 2022-2032
- FIGURE 02. SEGMENTATION OF URGENT CARE APPS MARKET, 2022-2032
- FIGURE 03. TOP INVESTMENT POCKETS IN URGENT CARE APPS MARKET (2023-2032)
- FIGURE 04. MODERATE BARGAINING POWER OF SUPPLIERS
- FIGURE 05. MODERATE BARGAINING POWER OF BUYERS
- FIGURE 06. MODERATE THREAT OF SUBSTITUTES
- FIGURE 07. MODERATE THREAT OF NEW ENTRANTS
- FIGURE 08. MODERATE INTENSITY OF RIVALRY
- FIGURE 09. DRIVERS, RESTRAINTS AND OPPORTUNITIES: GLOBALURGENT CARE APPS MARKET
- FIGURE 10. URGENT CARE APPS MARKET, BY PRODUCT, 2022(%)
- FIGURE 11. COMPARATIVE SHARE ANALYSIS OF URGENT CARE APPS MARKET FOR EMERGENCY CARE TRIAGE APPS, BY COUNTRY 2022 AND 2032(%)
- FIGURE 12. COMPARATIVE SHARE ANALYSIS OF URGENT CARE APPS MARKET FOR IN-HOSPITAL COMMUNICATION APPS, BY COUNTRY 2022 AND 2032(%)
- FIGURE 13. COMPARATIVE SHARE ANALYSIS OF URGENT CARE APPS MARKET FOR POST-HOSPITAL APPS, BY COUNTRY 2022 AND 2032(%)
- FIGURE 14. URGENT CARE APPS MARKET, BY CLINICAL AREA, 2022(%)
- FIGURE 15. COMPARATIVE SHARE ANALYSIS OF URGENT CARE APPS MARKET FOR TRAUMA, BY COUNTRY 2022 AND 2032(%)
- FIGURE 16. COMPARATIVE SHARE ANALYSIS OF URGENT CARE APPS MARKET FOR STROKE, BY COUNTRY 2022 AND 2032(%)
- FIGURE 17. COMPARATIVE SHARE ANALYSIS OF URGENT CARE APPS MARKET FOR CARDIAC CONDITIONS, BY COUNTRY 2022 AND 2032(%)
- FIGURE 18. COMPARATIVE SHARE ANALYSIS OF URGENT CARE APPS MARKET FOR OTHERS, BY COUNTRY 2022 AND 2032(%)
- FIGURE 19. URGENT CARE APPS MARKET BY REGION, 2022
- FIGURE 20. U.S. URGENT CARE APPS MARKET, 2022-2032 ($MILLION)
- FIGURE 21. CANADA URGENT CARE APPS MARKET, 2022-2032 ($MILLION)
- FIGURE 22. MEXICO URGENT CARE APPS MARKET, 2022-2032 ($MILLION)
- FIGURE 23. GERMANY URGENT CARE APPS MARKET, 2022-2032 ($MILLION)
- FIGURE 24. FRANCE URGENT CARE APPS MARKET, 2022-2032 ($MILLION)
- FIGURE 25. UK URGENT CARE APPS MARKET, 2022-2032 ($MILLION)
- FIGURE 26. ITALY URGENT CARE APPS MARKET, 2022-2032 ($MILLION)
- FIGURE 27. SPAIN URGENT CARE APPS MARKET, 2022-2032 ($MILLION)
- FIGURE 28. REST OF EUROPE URGENT CARE APPS MARKET, 2022-2032 ($MILLION)
- FIGURE 29. CHINA URGENT CARE APPS MARKET, 2022-2032 ($MILLION)
- FIGURE 30. JAPAN URGENT CARE APPS MARKET, 2022-2032 ($MILLION)
- FIGURE 31. INDIA URGENT CARE APPS MARKET, 2022-2032 ($MILLION)
- FIGURE 32. AUSTRALIA URGENT CARE APPS MARKET, 2022-2032 ($MILLION)
- FIGURE 33. SOUTH KOREA URGENT CARE APPS MARKET, 2022-2032 ($MILLION)
- FIGURE 34. REST OF ASIA-PACIFIC URGENT CARE APPS MARKET, 2022-2032 ($MILLION)
- FIGURE 35. BRAZIL URGENT CARE APPS MARKET, 2022-2032 ($MILLION)
- FIGURE 36. SAUDI ARABIA URGENT CARE APPS MARKET, 2022-2032 ($MILLION)
- FIGURE 37. SOUTH AFRICA URGENT CARE APPS MARKET, 2022-2032 ($MILLION)
- FIGURE 38. REST OF LAMEA URGENT CARE APPS MARKET, 2022-2032 ($MILLION)
- FIGURE 39. TOP WINNING STRATEGIES, BY YEAR
- FIGURE 40. TOP WINNING STRATEGIES, BY DEVELOPMENT
- FIGURE 41. TOP WINNING STRATEGIES, BY COMPANY
- FIGURE 42. PRODUCT MAPPING OF TOP 10 PLAYERS
- FIGURE 43. COMPETITIVE DASHBOARD
- FIGURE 44. COMPETITIVE HEATMAP: URGENT CARE APPS MARKET
- FIGURE 45. TOP PLAYER POSITIONING, 2022
- FIGURE 46. STRYKER CORPORATION: NET REVENUE, 2019-2021 ($MILLION)
- FIGURE 47. STRYKER CORPORATION: REVENUE SHARE BY SEGMENT, 2021 (%)
- FIGURE 48. STRYKER CORPORATION: REVENUE SHARE BY REGION, 2021 (%)
- FIGURE 49. JOHNSON & JOHNSON: NET SALES, 2020-2022 ($MILLION)
- FIGURE 50. JOHNSON & JOHNSON: REVENUE SHARE BY SEGMENT, 2022 (%)
- FIGURE 51. JOHNSON & JOHNSON: REVENUE SHARE BY REGION, 2022 (%)
- FIGURE 52. TELADOC HEALTH, INC.: NET REVENUE, 2019-2021 ($MILLION)
- FIGURE 53. TELADOC HEALTH, INC.: REVENUE SHARE BY REGION, 2021 (%)
 2024 年全球緊急醫療護理應用市場報告
 緊急醫療應用程式市場:按實踐領域、應用程式類型和部署分類 - COVID-19、俄羅斯-烏克蘭衝突和高通膨的累積影響 - 2023-2030 年全球預測
 急救醫療應用程式市場:現狀分析及預測(2022年~2028年)