


 |
市場調查報告書
商品編碼
1298243
血漿蛋白治療市場:按產品類型、按應用、按最終用戶:2022-2031 年全球機會分析和行業預測Plasma Protein Therapeutics Market By Product type, By Application, By End user : Global Opportunity Analysis and Industry Forecast, 2022-2031 |
||||||
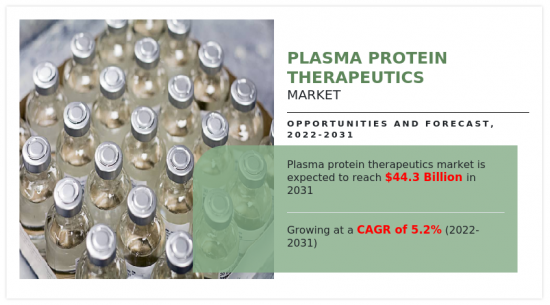
2021 年全球血漿蛋白治療市場價值將達到 265 億美元,預計 2022 年至 2031 年復合年增長率為 5.2%,到 2031 年達到 443 億美元。
血漿蛋白療法是由人血漿製成的生物製藥的一個子類別,用於治療多種疾病。 血液中存在稱為血漿蛋白的天然成分,對於維持身體健康和預防疾病至關重要。 血漿蛋白治療類別中包括各種化合物,包括免疫球蛋白、凝血因子、白蛋白和其他專門的血漿蛋白。 這些藥物用於治療多種疾病,包括川崎病、免疫缺陷、血液疾病、肝臟疾病、自身免疫性疾病以及慢性多發性神經炎等神經系統疾病。
血漿蛋白治療市場受到需求未滿足的慢性病患病率增加、人口老齡化加劇、蛋白質治療技術進步以及血漿蛋白領域研發活動增加等因素推動。 由於慢性免疫疾病的患病率不斷上升,特別是在發展中國家,對這些產品的需求預計將繼續增長。 此外,新產品開發和新產品批准是推動血漿蛋白治療市場增長的重要因素。 例如,2020年2月,CSL貝林宣布美國食品藥品監督管理局(FDA)批准Pribigenne(靜脈注射免疫球蛋白(人),10%液體)作為治療系統性硬化症(SSc)的孤兒藥。被指定。 此外,市場進入者與大學、研究機構和其他組織建立戰略夥伴關係並進行合作也正在推動市場增長。 此外,公司正在收購中小企業以擴大其產品組合、提高市場佔有率並進入新市場。 因此,主要市場參與者越來越多地採用併購、產品創新和分銷網絡擴張等戰略,正在推動血漿蛋白治療市場的增長。
隨著患者和醫療保健專業人員更喜歡針對各種疾病(包括免疫和自身免疫性疾病)更有效和更具體的治療方法,對血漿蛋白療法的需求正在增加。 與傳統療法相比,血漿蛋白療法具有許多優勢,包括提高療效、減少副作用以及靶向特定疾病相關分子的能力。
內容
第一章簡介
第 2 章執行摘要
第三章市場概述
- 市場定義和範圍
- 主要發現
- 影響因素
- 主要投資機會
- 波特五力分析
- 供應商的議價能力
- 買家的議價能力
- 替代品的威脅
- 新進入者的威脅
- 競爭強度
- 市場動態
- 協調員
- 對先進治療藥物的需求不斷增長
- 主要市場參與者的戰略採用率上升
- 增加產品審批和產品開發
- 阻礙因素
- 有關血漿蛋白產品處理的嚴格規定
- 機會
- 技術進步
- 協調員
- 新冠肺炎 (COVID-19),市場影響分析
第 4 章血漿蛋白治療市場,按產品類型
- 概述
- 市場規模和預測
- 免疫球蛋白
- 主要市場趨勢、增長因素、增長機會
- 市場規模和預測:按地區劃分
- 市場份額分析:按國家/地區劃分
- 白蛋白
- 主要市場趨勢、增長動力和機遇
- 市場規模和預測:按地區劃分
- 市場份額分析:按國家/地區劃分
- 血漿衍生因子 VIII
- 主要市場趨勢、增長因素和機遇
- 市場規模和預測:按地區劃分
- 市場份額分析:按國家/地區劃分
- 其他
- 主要市場趨勢、增長因素和機遇
- 市場規模和預測:按地區劃分
- 市場份額分析:按國家/地區劃分
第 5 章血漿蛋白治療市場:按應用劃分
- 概述
- 市場規模和預測
- 血友病
- 主要市場趨勢、增長因素、增長機會
- 市場規模和預測:按地區劃分
- 市場份額分析:按國家/地區劃分
- 特發性血小板減少性紫癜
- 主要市場趨勢、增長因素和機遇
- 市場規模和預測:按地區劃分
- 市場份額分析:按國家/地區劃分
- 原發性免疫缺陷
- 主要市場趨勢、增長動力和機遇
- 市場規模和預測:按地區劃分
- 市場份額分析:按國家/地區劃分
- 其他
- 主要市場趨勢、增長因素和機遇
- 市場規模和預測:按地區劃分
- 市場份額分析:按國家/地區劃分
第 6 章血漿蛋白治療市場:按最終用戶劃分
- 概述
- 市場規模和預測
- 醫院
- 主要市場趨勢、增長因素和增長機會
- 市場規模和預測:按地區劃分
- 市場份額分析:按國家/地區劃分
- 其他
- 主要市場趨勢、增長因素和機遇
- 市場規模和預測:按地區劃分
- 市場份額分析:按國家/地區劃分
第 7 章血漿蛋白治療市場:按地區
- 概述
- 市場規模和預測:按地區劃分
- 北美
- 主要趨勢和機遇
- 市場規模和預測:按產品類型劃分
- 市場規模和預測:按應用分類
- 市場規模和預測:按最終用戶劃分
- 市場規模/預測:按國家/地區劃分
- 美國
- 主要市場趨勢、增長因素、增長機會
- 市場規模和預測:按產品類型劃分
- 市場規模和預測:按應用分類
- 市場規模和預測:按最終用戶劃分
- 加拿大
- 主要市場趨勢、增長動力和機遇
- 市場規模和預測:按產品類型劃分
- 市場規模和預測:按應用分類
- 市場規模和預測:按最終用戶劃分
- 墨西哥
- 主要市場趨勢、增長動力和機遇
- 市場規模和預測:按產品類型劃分
- 市場規模和預測:按應用分類
- 市場規模和預測:按最終用戶劃分
- 歐洲
- 主要趨勢和機遇
- 市場規模和預測:按產品類型劃分
- 市場規模和預測:按應用分類
- 市場規模和預測:按最終用戶劃分
- 市場規模/預測:按國家/地區劃分
- 德國
- 主要市場趨勢、增長因素、增長機會
- 市場規模和預測:按產品類型劃分
- 市場規模和預測:按應用分類
- 市場規模和預測:按最終用戶劃分
- 法國
- 主要市場趨勢、增長動力和機遇
- 市場規模和預測:按產品類型劃分
- 市場規模和預測:按應用分類
- 市場規模和預測:按最終用戶劃分
- 英國
- 主要市場趨勢、增長動力和機遇
- 市場規模和預測:按產品類型劃分
- 市場規模和預測:按應用分類
- 市場規模和預測:按最終用戶劃分
- 意大利
- 主要市場趨勢、增長動力和機遇
- 市場規模和預測:按產品類型劃分
- 市場規模和預測:按應用分類
- 市場規模和預測:按最終用戶劃分
- 西班牙
- 主要市場趨勢、增長動力和機遇
- 市場規模和預測:按產品類型劃分
- 市場規模和預測:按應用分類
- 市場規模和預測:按最終用戶劃分
- 歐洲其他地區
- 主要市場趨勢、增長動力和機遇
- 市場規模和預測:按產品類型劃分
- 市場規模和預測:按應用分類
- 市場規模和預測:按最終用戶劃分
- 亞太地區
- 主要趨勢和機遇
- 市場規模和預測:按產品類型劃分
- 市場規模和預測:按應用分類
- 市場規模和預測:按最終用戶劃分
- 市場規模/預測:按國家/地區劃分
- 日本
- 主要市場趨勢、增長因素、增長機會
- 市場規模和預測:按產品類型劃分
- 市場規模和預測:按應用分類
- 市場規模和預測:按最終用戶劃分
- 中國
- 主要市場趨勢、增長因素、增長機會
- 市場規模和預測:按產品類型劃分
- 市場規模和預測:按應用分類
- 市場規模和預測:按最終用戶劃分
- 印度
- 主要市場趨勢、增長動力和機遇
- 市場規模和預測:按產品類型劃分
- 市場規模和預測:按應用分類
- 市場規模和預測:按最終用戶劃分
- 澳大利亞
- 主要市場趨勢、增長動力和機遇
- 市場規模和預測:按產品類型劃分
- 市場規模和預測:按應用分類
- 市場規模和預測:按最終用戶劃分
- 韓國
- 主要市場趨勢、增長動力和機遇
- 市場規模和預測:按產品類型劃分
- 市場規模和預測:按應用分類
- 市場規模和預測:按最終用戶劃分
- 亞太地區其他地區
- 主要市場趨勢、增長動力和機遇
- 市場規模和預測:按產品類型劃分
- 市場規模和預測:按應用分類
- 市場規模和預測:按最終用戶劃分
- 拉丁美洲/中東/非洲
- 主要趨勢和機遇
- 市場規模和預測:按產品類型劃分
- 市場規模和預測:按應用分類
- 市場規模和預測:按最終用戶劃分
- 市場規模/預測:按國家/地區劃分
- 巴西
- 主要市場趨勢、增長因素、增長機會
- 市場規模和預測:按產品類型劃分
- 市場規模和預測:按應用分類
- 市場規模和預測:按最終用戶劃分
- 沙特阿拉伯
- 主要市場趨勢、增長動力和機遇
- 市場規模和預測:按產品類型劃分
- 市場規模和預測:按應用分類
- 市場規模和預測:按最終用戶劃分
- 南非
- 主要市場趨勢、增長動力和機遇
- 市場規模和預測:按產品類型劃分
- 市場規模和預測:按應用分類
- 市場規模和預測:按最終用戶劃分
- 其他地區
- 主要市場趨勢、增長動力和機遇
- 市場規模和預測:按產品類型劃分
- 市場規模和預測:按應用分類
- 市場規模和預測:按最終用戶劃分
第 8 章競爭格局
- 簡介
- 關鍵成功策略
- 10家主要公司的產品圖譜
- 競賽儀表板
- 比賽熱圖
- 頂級公司定位(2021 年)
第 9 章公司簡介
- Octapharma AG
- Grifols, S.A.
- Baxter International Inc.
- ADMA Biologics Inc
- Bio Products Laboratory Ltd
- Takeda Pharmaceutical Company Limited
- CSL Limited
- Kedrion, SpA
- Taibang Biological Group Co., Ltd
- Bayer AG
The global plasma protein therapeutics market was valued at $26.5 billion in 2021, and is projected to reach $44.3 billion by 2031, growing at a CAGR of 5.2% from 2022 to 2031.
Plasma protein therapeutics are a subcategory of biopharmaceuticals made from human blood plasma and are used to treat a range of diseases. Natural components called plasma proteins are present in blood and are essential for preserving good health and preventing disease. Various compounds, such as immunoglobulin, clotting factors, albumin, and other specialized plasma proteins, are included in the category of plasma protein therapies. These medicines are used to treat a range of illnesses, such as Kawasaki disease, immunological deficiencies, blood problems, liver ailments, autoimmune diseases, and neurological disorders such as chronic polyneuropathy.
The market for plasma protein therapeutics is driven by factors such as an increase in the prevalence of chronic diseases with unmet needs, rise in an aging population, and advancements in protein therapies technology and rise in R&D in the plasma protein field. The demand for these products is expected to continue to grow due to an increase in the incidence of chronic immunological diseases, particularly in developing countries. In addition, new product development and new product approval are significant drivers of growth for the plasma protein therapeutics market. For an instance, in February 2020 CSL Behring announced that the U.S. Food and Drug Administration (FDA) has granted Privigenne (Immune Globulin Intravenous (Human),10% Liquid) orphan-drug designation as an investigational therapy in the treatment of Systemic Sclerosis (SSc). Moreover, market growth is also driven by market participants forming strategic alliances and working together with universities, research facilities, and other organizations. Furthermore, companies are acquiring smaller players to expand their product portfolio, increase their market presence, and gain access to new markets. Thus, the rise in adoption of strategies by key market players, such as mergers and acquisitions, product innovation, and expanding distribution networks, is driving the growth of the plasma protein therapeutics market.
There is an increase in the demand for plasma protein therapeutics as patients and medical professionals prefer more effective and specific treatments for a variety of diseases, including immunological disorders and autoimmune disorders. They offer a variety of advantages over traditional treatment, including improved efficacy, fewer side effects, and the ability to target specific disease-related molecules.
In addition, plasma protein therapeutics have been gaining significant attention in recent years due to their potential to treat a wide range of medical conditions, including immune disorders, and bleeding disorders. Rise in demand for advanced therapeutics, as patients and healthcare professionals look for more effective and focused therapies for various diseases also drives the market growth.
However, stringent guidelines for storage, testing, and collection from donors, of plasma is expected to restrain the growth of the plasma protein therapeutics market. On the other hand, development of targeted plasma protein therapies that can be used to treat specific disorders has been made possible by modifications in analytical and diagnostic technologies. Research and technological advancements have made it possible to create novel plasma protein therapies that improve patient outcomes. Thus, technological advancements in the field of plasma protein therapeutics offer a significant opportunity for market growth.
The plasma protein therapeutics market is segmented into product type, application, end user and region. By product type, the market is categorized into immunoglobulin, albumin, plasma factor derived VIII, and others. By application, the market is segregated into hemophilia, idiopathic thrombocytopenic purpura , primary immunodeficiency, and others. By end user, the market is categorized into hospitals and others. Region wise, the market is analyzed across North America (the U.S., Canada, and Mexico), Europe (Germany, France, the UK, Italy, Spain, and rest of Europe), Asia-Pacific (Japan, China, Australia, India, South Korea, and rest of Asia-Pacific), and LAMEA (Brazil, South Africa, Saudi Arabia, and rest of LAMEA).
Major key players that operate in the global plasma protein therapeutics market are: ADMA Biologics Inc, Bayer AG, Bio products laboratory, Baxter International, CSL Limited, Grifsols, Kedrion SpA, Octapharma USA Inc, Taibang Biological Group Co. Ltd, and Takeda Pharmaceutical Company Limited.
Key Benefits For Stakeholders
- This report provides a quantitative analysis of the market segments, current trends, estimations, and dynamics of the plasma protein therapeutics market analysis from 2021 to 2031 to identify the prevailing plasma protein therapeutics market opportunities.
- The market research is offered along with information related to key drivers, restraints, and opportunities.
- Porter's five forces analysis highlights the potency of buyers and suppliers to enable stakeholders make profit-oriented business decisions and strengthen their supplier-buyer network.
- In-depth analysis of the plasma protein therapeutics market segmentation assists to determine the prevailing market opportunities.
- Major countries in each region are mapped according to their revenue contribution to the global market.
- Market player positioning facilitates benchmarking and provides a clear understanding of the present position of the market players.
- The report includes the analysis of the regional as well as global plasma protein therapeutics market trends, key players, market segments, application areas, and market growth strategies.
Key Market Segments
By Product type
- Immunoglobulin
- Albumin
- Plasma derived factor VIII
- Others
By Application
- Hemophilia
- Idiopathic thrombocytopenic purpura
- Primary immunodeficiency disorder
- Others
By End user
- Hospitals
- Others
By Region
- North America
- U.S.
- Canada
- Mexico
- Europe
- Germany
- France
- UK
- Italy
- Spain
- Rest of Europe
- Asia-Pacific
- Japan
- China
- India
- Australia
- South Korea
- Rest of Asia-Pacific
- LAMEA
- Brazil
- Saudi Arabia
- South Africa
- Rest of LAMEA
Key Market Players:
- Bayer AG
- Bio Products Laboratory Ltd
- Takeda Pharmaceutical Company Limited
- Grifols, S.A.
- Baxter International Inc.
- Kedrion, SpA
- Octapharma AG
- CSL Limited
- ADMA Biologics Inc
- Taibang Biological Group Co., Ltd
TABLE OF CONTENTS
CHAPTER 1: INTRODUCTION
- 1.1. Report description
- 1.2. Key market segments
- 1.3. Key benefits to the stakeholders
- 1.4. Research Methodology
- 1.4.1. Primary research
- 1.4.2. Secondary research
- 1.4.3. Analyst tools and models
CHAPTER 2: EXECUTIVE SUMMARY
- 2.1. CXO Perspective
CHAPTER 3: MARKET OVERVIEW
- 3.1. Market definition and scope
- 3.2. Key findings
- 3.2.1. Top impacting factors
- 3.2.2. Top investment pockets
- 3.3. Porter's five forces analysis
- 3.3.1. Bargaining power of suppliers
- 3.3.2. Bargaining power of buyers
- 3.3.3. Threat of substitutes
- 3.3.4. Threat of new entrants
- 3.3.5. Intensity of rivalry
- 3.4. Market dynamics
- 3.4.1. Drivers
- 3.4.1.1. Rise in demand for advanced therapeutics
- 3.4.1.2. Rise in adoption of strategies by key market players
- 3.4.1.3. Increase in product approval and product development
- 3.4.1. Drivers
- 3.4.2. Restraints
- 3.4.2.1. Strict regulation for handling plasma protein products
- 3.4.3. Opportunities
- 3.4.3.1. Technological advancements
- 3.5. COVID-19 Impact Analysis on the market
CHAPTER 4: PLASMA PROTEIN THERAPEUTICS MARKET, BY PRODUCT TYPE
- 4.1. Overview
- 4.1.1. Market size and forecast
- 4.2. Immunoglobulin
- 4.2.1. Key market trends, growth factors and opportunities
- 4.2.2. Market size and forecast, by region
- 4.2.3. Market share analysis by country
- 4.3. Albumin
- 4.3.1. Key market trends, growth factors and opportunities
- 4.3.2. Market size and forecast, by region
- 4.3.3. Market share analysis by country
- 4.4. Plasma derived factor VIII
- 4.4.1. Key market trends, growth factors and opportunities
- 4.4.2. Market size and forecast, by region
- 4.4.3. Market share analysis by country
- 4.5. Others
- 4.5.1. Key market trends, growth factors and opportunities
- 4.5.2. Market size and forecast, by region
- 4.5.3. Market share analysis by country
CHAPTER 5: PLASMA PROTEIN THERAPEUTICS MARKET, BY APPLICATION
- 5.1. Overview
- 5.1.1. Market size and forecast
- 5.2. Hemophilia
- 5.2.1. Key market trends, growth factors and opportunities
- 5.2.2. Market size and forecast, by region
- 5.2.3. Market share analysis by country
- 5.3. Idiopathic thrombocytopenic purpura
- 5.3.1. Key market trends, growth factors and opportunities
- 5.3.2. Market size and forecast, by region
- 5.3.3. Market share analysis by country
- 5.4. Primary immunodeficiency disorder
- 5.4.1. Key market trends, growth factors and opportunities
- 5.4.2. Market size and forecast, by region
- 5.4.3. Market share analysis by country
- 5.5. Others
- 5.5.1. Key market trends, growth factors and opportunities
- 5.5.2. Market size and forecast, by region
- 5.5.3. Market share analysis by country
CHAPTER 6: PLASMA PROTEIN THERAPEUTICS MARKET, BY END USER
- 6.1. Overview
- 6.1.1. Market size and forecast
- 6.2. Hospitals
- 6.2.1. Key market trends, growth factors and opportunities
- 6.2.2. Market size and forecast, by region
- 6.2.3. Market share analysis by country
- 6.3. Others
- 6.3.1. Key market trends, growth factors and opportunities
- 6.3.2. Market size and forecast, by region
- 6.3.3. Market share analysis by country
CHAPTER 7: PLASMA PROTEIN THERAPEUTICS MARKET, BY REGION
- 7.1. Overview
- 7.1.1. Market size and forecast By Region
- 7.2. North America
- 7.2.1. Key trends and opportunities
- 7.2.2. Market size and forecast, by Product type
- 7.2.3. Market size and forecast, by Application
- 7.2.4. Market size and forecast, by End user
- 7.2.5. Market size and forecast, by country
- 7.2.5.1. U.S.
- 7.2.5.1.1. Key market trends, growth factors and opportunities
- 7.2.5.1.2. Market size and forecast, by Product type
- 7.2.5.1.3. Market size and forecast, by Application
- 7.2.5.1.4. Market size and forecast, by End user
- 7.2.5.2. Canada
- 7.2.5.2.1. Key market trends, growth factors and opportunities
- 7.2.5.2.2. Market size and forecast, by Product type
- 7.2.5.2.3. Market size and forecast, by Application
- 7.2.5.2.4. Market size and forecast, by End user
- 7.2.5.3. Mexico
- 7.2.5.3.1. Key market trends, growth factors and opportunities
- 7.2.5.3.2. Market size and forecast, by Product type
- 7.2.5.3.3. Market size and forecast, by Application
- 7.2.5.3.4. Market size and forecast, by End user
- 7.3. Europe
- 7.3.1. Key trends and opportunities
- 7.3.2. Market size and forecast, by Product type
- 7.3.3. Market size and forecast, by Application
- 7.3.4. Market size and forecast, by End user
- 7.3.5. Market size and forecast, by country
- 7.3.5.1. Germany
- 7.3.5.1.1. Key market trends, growth factors and opportunities
- 7.3.5.1.2. Market size and forecast, by Product type
- 7.3.5.1.3. Market size and forecast, by Application
- 7.3.5.1.4. Market size and forecast, by End user
- 7.3.5.2. France
- 7.3.5.2.1. Key market trends, growth factors and opportunities
- 7.3.5.2.2. Market size and forecast, by Product type
- 7.3.5.2.3. Market size and forecast, by Application
- 7.3.5.2.4. Market size and forecast, by End user
- 7.3.5.3. UK
- 7.3.5.3.1. Key market trends, growth factors and opportunities
- 7.3.5.3.2. Market size and forecast, by Product type
- 7.3.5.3.3. Market size and forecast, by Application
- 7.3.5.3.4. Market size and forecast, by End user
- 7.3.5.4. Italy
- 7.3.5.4.1. Key market trends, growth factors and opportunities
- 7.3.5.4.2. Market size and forecast, by Product type
- 7.3.5.4.3. Market size and forecast, by Application
- 7.3.5.4.4. Market size and forecast, by End user
- 7.3.5.5. Spain
- 7.3.5.5.1. Key market trends, growth factors and opportunities
- 7.3.5.5.2. Market size and forecast, by Product type
- 7.3.5.5.3. Market size and forecast, by Application
- 7.3.5.5.4. Market size and forecast, by End user
- 7.3.5.6. Rest of Europe
- 7.3.5.6.1. Key market trends, growth factors and opportunities
- 7.3.5.6.2. Market size and forecast, by Product type
- 7.3.5.6.3. Market size and forecast, by Application
- 7.3.5.6.4. Market size and forecast, by End user
- 7.4. Asia-Pacific
- 7.4.1. Key trends and opportunities
- 7.4.2. Market size and forecast, by Product type
- 7.4.3. Market size and forecast, by Application
- 7.4.4. Market size and forecast, by End user
- 7.4.5. Market size and forecast, by country
- 7.4.5.1. Japan
- 7.4.5.1.1. Key market trends, growth factors and opportunities
- 7.4.5.1.2. Market size and forecast, by Product type
- 7.4.5.1.3. Market size and forecast, by Application
- 7.4.5.1.4. Market size and forecast, by End user
- 7.4.5.2. China
- 7.4.5.2.1. Key market trends, growth factors and opportunities
- 7.4.5.2.2. Market size and forecast, by Product type
- 7.4.5.2.3. Market size and forecast, by Application
- 7.4.5.2.4. Market size and forecast, by End user
- 7.4.5.3. India
- 7.4.5.3.1. Key market trends, growth factors and opportunities
- 7.4.5.3.2. Market size and forecast, by Product type
- 7.4.5.3.3. Market size and forecast, by Application
- 7.4.5.3.4. Market size and forecast, by End user
- 7.4.5.4. Australia
- 7.4.5.4.1. Key market trends, growth factors and opportunities
- 7.4.5.4.2. Market size and forecast, by Product type
- 7.4.5.4.3. Market size and forecast, by Application
- 7.4.5.4.4. Market size and forecast, by End user
- 7.4.5.5. South Korea
- 7.4.5.5.1. Key market trends, growth factors and opportunities
- 7.4.5.5.2. Market size and forecast, by Product type
- 7.4.5.5.3. Market size and forecast, by Application
- 7.4.5.5.4. Market size and forecast, by End user
- 7.4.5.6. Rest of Asia-Pacific
- 7.4.5.6.1. Key market trends, growth factors and opportunities
- 7.4.5.6.2. Market size and forecast, by Product type
- 7.4.5.6.3. Market size and forecast, by Application
- 7.4.5.6.4. Market size and forecast, by End user
- 7.5. LAMEA
- 7.5.1. Key trends and opportunities
- 7.5.2. Market size and forecast, by Product type
- 7.5.3. Market size and forecast, by Application
- 7.5.4. Market size and forecast, by End user
- 7.5.5. Market size and forecast, by country
- 7.5.5.1. Brazil
- 7.5.5.1.1. Key market trends, growth factors and opportunities
- 7.5.5.1.2. Market size and forecast, by Product type
- 7.5.5.1.3. Market size and forecast, by Application
- 7.5.5.1.4. Market size and forecast, by End user
- 7.5.5.2. Saudi Arabia
- 7.5.5.2.1. Key market trends, growth factors and opportunities
- 7.5.5.2.2. Market size and forecast, by Product type
- 7.5.5.2.3. Market size and forecast, by Application
- 7.5.5.2.4. Market size and forecast, by End user
- 7.5.5.3. South Africa
- 7.5.5.3.1. Key market trends, growth factors and opportunities
- 7.5.5.3.2. Market size and forecast, by Product type
- 7.5.5.3.3. Market size and forecast, by Application
- 7.5.5.3.4. Market size and forecast, by End user
- 7.5.5.4. Rest of LAMEA
- 7.5.5.4.1. Key market trends, growth factors and opportunities
- 7.5.5.4.2. Market size and forecast, by Product type
- 7.5.5.4.3. Market size and forecast, by Application
- 7.5.5.4.4. Market size and forecast, by End user
CHAPTER 8: COMPETITIVE LANDSCAPE
- 8.1. Introduction
- 8.2. Top winning strategies
- 8.3. Product Mapping of Top 10 Player
- 8.4. Competitive Dashboard
- 8.5. Competitive Heatmap
- 8.6. Top player positioning, 2021
CHAPTER 9: COMPANY PROFILES
- 9.1. Octapharma AG
- 9.1.1. Company overview
- 9.1.2. Key Executives
- 9.1.3. Company snapshot
- 9.1.4. Operating business segments
- 9.1.5. Product portfolio
- 9.1.6. Business performance
- 9.1.7. Key strategic moves and developments
- 9.2. Grifols, S.A.
- 9.2.1. Company overview
- 9.2.2. Key Executives
- 9.2.3. Company snapshot
- 9.2.4. Operating business segments
- 9.2.5. Product portfolio
- 9.2.6. Business performance
- 9.2.7. Key strategic moves and developments
- 9.3. Baxter International Inc.
- 9.3.1. Company overview
- 9.3.2. Key Executives
- 9.3.3. Company snapshot
- 9.3.4. Operating business segments
- 9.3.5. Product portfolio
- 9.3.6. Business performance
- 9.4. ADMA Biologics Inc
- 9.4.1. Company overview
- 9.4.2. Key Executives
- 9.4.3. Company snapshot
- 9.4.4. Operating business segments
- 9.4.5. Product portfolio
- 9.4.6. Business performance
- 9.4.7. Key strategic moves and developments
- 9.5. Bio Products Laboratory Ltd
- 9.5.1. Company overview
- 9.5.2. Key Executives
- 9.5.3. Company snapshot
- 9.5.4. Operating business segments
- 9.5.5. Product portfolio
- 9.5.6. Key strategic moves and developments
- 9.6. Takeda Pharmaceutical Company Limited
- 9.6.1. Company overview
- 9.6.2. Key Executives
- 9.6.3. Company snapshot
- 9.6.4. Operating business segments
- 9.6.5. Product portfolio
- 9.6.6. Business performance
- 9.6.7. Key strategic moves and developments
- 9.7. CSL Limited
- 9.7.1. Company overview
- 9.7.2. Key Executives
- 9.7.3. Company snapshot
- 9.7.4. Operating business segments
- 9.7.5. Product portfolio
- 9.7.6. Business performance
- 9.7.7. Key strategic moves and developments
- 9.8. Kedrion, SpA
- 9.8.1. Company overview
- 9.8.2. Key Executives
- 9.8.3. Company snapshot
- 9.8.4. Operating business segments
- 9.8.5. Product portfolio
- 9.8.6. Business performance
- 9.8.7. Key strategic moves and developments
- 9.9. Taibang Biological Group Co., Ltd
- 9.9.1. Company overview
- 9.9.2. Key Executives
- 9.9.3. Company snapshot
- 9.9.4. Operating business segments
- 9.9.5. Product portfolio
- 9.10. Bayer AG
- 9.10.1. Company overview
- 9.10.2. Key Executives
- 9.10.3. Company snapshot
- 9.10.4. Operating business segments
- 9.10.5. Product portfolio
- 9.10.6. Business performance
LIST OF TABLES
- TABLE 01. GLOBAL PLASMA PROTEIN THERAPEUTICS MARKET, BY PRODUCT TYPE, 2021-2031 ($MILLION)
- TABLE 02. PLASMA PROTEIN THERAPEUTICS MARKET FOR IMMUNOGLOBULIN, BY REGION, 2021-2031 ($MILLION)
- TABLE 03. PLASMA PROTEIN THERAPEUTICS MARKET FOR ALBUMIN, BY REGION, 2021-2031 ($MILLION)
- TABLE 04. PLASMA PROTEIN THERAPEUTICS MARKET FOR PLASMA DERIVED FACTOR VIII, BY REGION, 2021-2031 ($MILLION)
- TABLE 05. PLASMA PROTEIN THERAPEUTICS MARKET FOR OTHERS, BY REGION, 2021-2031 ($MILLION)
- TABLE 06. GLOBAL PLASMA PROTEIN THERAPEUTICS MARKET, BY APPLICATION, 2021-2031 ($MILLION)
- TABLE 07. PLASMA PROTEIN THERAPEUTICS MARKET FOR HEMOPHILIA, BY REGION, 2021-2031 ($MILLION)
- TABLE 08. PLASMA PROTEIN THERAPEUTICS MARKET FOR IDIOPATHIC THROMBOCYTOPENIC PURPURA, BY REGION, 2021-2031 ($MILLION)
- TABLE 09. PLASMA PROTEIN THERAPEUTICS MARKET FOR PRIMARY IMMUNODEFICIENCY DISORDER, BY REGION, 2021-2031 ($MILLION)
- TABLE 10. PLASMA PROTEIN THERAPEUTICS MARKET FOR OTHERS, BY REGION, 2021-2031 ($MILLION)
- TABLE 11. GLOBAL PLASMA PROTEIN THERAPEUTICS MARKET, BY END USER, 2021-2031 ($MILLION)
- TABLE 12. PLASMA PROTEIN THERAPEUTICS MARKET FOR HOSPITALS, BY REGION, 2021-2031 ($MILLION)
- TABLE 13. PLASMA PROTEIN THERAPEUTICS MARKET FOR OTHERS, BY REGION, 2021-2031 ($MILLION)
- TABLE 14. PLASMA PROTEIN THERAPEUTICS MARKET, BY REGION, 2021-2031 ($MILLION)
- TABLE 15. NORTH AMERICA PLASMA PROTEIN THERAPEUTICS MARKET, BY PRODUCT TYPE, 2021-2031 ($MILLION)
- TABLE 16. NORTH AMERICA PLASMA PROTEIN THERAPEUTICS MARKET, BY APPLICATION, 2021-2031 ($MILLION)
- TABLE 17. NORTH AMERICA PLASMA PROTEIN THERAPEUTICS MARKET, BY END USER, 2021-2031 ($MILLION)
- TABLE 18. NORTH AMERICA PLASMA PROTEIN THERAPEUTICS MARKET, BY COUNTRY, 2021-2031 ($MILLION)
- TABLE 19. U.S. PLASMA PROTEIN THERAPEUTICS MARKET, BY PRODUCT TYPE, 2021-2031 ($MILLION)
- TABLE 20. U.S. PLASMA PROTEIN THERAPEUTICS MARKET, BY APPLICATION, 2021-2031 ($MILLION)
- TABLE 21. U.S. PLASMA PROTEIN THERAPEUTICS MARKET, BY END USER, 2021-2031 ($MILLION)
- TABLE 22. CANADA PLASMA PROTEIN THERAPEUTICS MARKET, BY PRODUCT TYPE, 2021-2031 ($MILLION)
- TABLE 23. CANADA PLASMA PROTEIN THERAPEUTICS MARKET, BY APPLICATION, 2021-2031 ($MILLION)
- TABLE 24. CANADA PLASMA PROTEIN THERAPEUTICS MARKET, BY END USER, 2021-2031 ($MILLION)
- TABLE 25. MEXICO PLASMA PROTEIN THERAPEUTICS MARKET, BY PRODUCT TYPE, 2021-2031 ($MILLION)
- TABLE 26. MEXICO PLASMA PROTEIN THERAPEUTICS MARKET, BY APPLICATION, 2021-2031 ($MILLION)
- TABLE 27. MEXICO PLASMA PROTEIN THERAPEUTICS MARKET, BY END USER, 2021-2031 ($MILLION)
- TABLE 28. EUROPE PLASMA PROTEIN THERAPEUTICS MARKET, BY PRODUCT TYPE, 2021-2031 ($MILLION)
- TABLE 29. EUROPE PLASMA PROTEIN THERAPEUTICS MARKET, BY APPLICATION, 2021-2031 ($MILLION)
- TABLE 30. EUROPE PLASMA PROTEIN THERAPEUTICS MARKET, BY END USER, 2021-2031 ($MILLION)
- TABLE 31. EUROPE PLASMA PROTEIN THERAPEUTICS MARKET, BY COUNTRY, 2021-2031 ($MILLION)
- TABLE 32. GERMANY PLASMA PROTEIN THERAPEUTICS MARKET, BY PRODUCT TYPE, 2021-2031 ($MILLION)
- TABLE 33. GERMANY PLASMA PROTEIN THERAPEUTICS MARKET, BY APPLICATION, 2021-2031 ($MILLION)
- TABLE 34. GERMANY PLASMA PROTEIN THERAPEUTICS MARKET, BY END USER, 2021-2031 ($MILLION)
- TABLE 35. FRANCE PLASMA PROTEIN THERAPEUTICS MARKET, BY PRODUCT TYPE, 2021-2031 ($MILLION)
- TABLE 36. FRANCE PLASMA PROTEIN THERAPEUTICS MARKET, BY APPLICATION, 2021-2031 ($MILLION)
- TABLE 37. FRANCE PLASMA PROTEIN THERAPEUTICS MARKET, BY END USER, 2021-2031 ($MILLION)
- TABLE 38. UK PLASMA PROTEIN THERAPEUTICS MARKET, BY PRODUCT TYPE, 2021-2031 ($MILLION)
- TABLE 39. UK PLASMA PROTEIN THERAPEUTICS MARKET, BY APPLICATION, 2021-2031 ($MILLION)
- TABLE 40. UK PLASMA PROTEIN THERAPEUTICS MARKET, BY END USER, 2021-2031 ($MILLION)
- TABLE 41. ITALY PLASMA PROTEIN THERAPEUTICS MARKET, BY PRODUCT TYPE, 2021-2031 ($MILLION)
- TABLE 42. ITALY PLASMA PROTEIN THERAPEUTICS MARKET, BY APPLICATION, 2021-2031 ($MILLION)
- TABLE 43. ITALY PLASMA PROTEIN THERAPEUTICS MARKET, BY END USER, 2021-2031 ($MILLION)
- TABLE 44. SPAIN PLASMA PROTEIN THERAPEUTICS MARKET, BY PRODUCT TYPE, 2021-2031 ($MILLION)
- TABLE 45. SPAIN PLASMA PROTEIN THERAPEUTICS MARKET, BY APPLICATION, 2021-2031 ($MILLION)
- TABLE 46. SPAIN PLASMA PROTEIN THERAPEUTICS MARKET, BY END USER, 2021-2031 ($MILLION)
- TABLE 47. REST OF EUROPE PLASMA PROTEIN THERAPEUTICS MARKET, BY PRODUCT TYPE, 2021-2031 ($MILLION)
- TABLE 48. REST OF EUROPE PLASMA PROTEIN THERAPEUTICS MARKET, BY APPLICATION, 2021-2031 ($MILLION)
- TABLE 49. REST OF EUROPE PLASMA PROTEIN THERAPEUTICS MARKET, BY END USER, 2021-2031 ($MILLION)
- TABLE 50. ASIA-PACIFIC PLASMA PROTEIN THERAPEUTICS MARKET, BY PRODUCT TYPE, 2021-2031 ($MILLION)
- TABLE 51. ASIA-PACIFIC PLASMA PROTEIN THERAPEUTICS MARKET, BY APPLICATION, 2021-2031 ($MILLION)
- TABLE 52. ASIA-PACIFIC PLASMA PROTEIN THERAPEUTICS MARKET, BY END USER, 2021-2031 ($MILLION)
- TABLE 53. ASIA-PACIFIC PLASMA PROTEIN THERAPEUTICS MARKET, BY COUNTRY, 2021-2031 ($MILLION)
- TABLE 54. JAPAN PLASMA PROTEIN THERAPEUTICS MARKET, BY PRODUCT TYPE, 2021-2031 ($MILLION)
- TABLE 55. JAPAN PLASMA PROTEIN THERAPEUTICS MARKET, BY APPLICATION, 2021-2031 ($MILLION)
- TABLE 56. JAPAN PLASMA PROTEIN THERAPEUTICS MARKET, BY END USER, 2021-2031 ($MILLION)
- TABLE 57. CHINA PLASMA PROTEIN THERAPEUTICS MARKET, BY PRODUCT TYPE, 2021-2031 ($MILLION)
- TABLE 58. CHINA PLASMA PROTEIN THERAPEUTICS MARKET, BY APPLICATION, 2021-2031 ($MILLION)
- TABLE 59. CHINA PLASMA PROTEIN THERAPEUTICS MARKET, BY END USER, 2021-2031 ($MILLION)
- TABLE 60. INDIA PLASMA PROTEIN THERAPEUTICS MARKET, BY PRODUCT TYPE, 2021-2031 ($MILLION)
- TABLE 61. INDIA PLASMA PROTEIN THERAPEUTICS MARKET, BY APPLICATION, 2021-2031 ($MILLION)
- TABLE 62. INDIA PLASMA PROTEIN THERAPEUTICS MARKET, BY END USER, 2021-2031 ($MILLION)
- TABLE 63. AUSTRALIA PLASMA PROTEIN THERAPEUTICS MARKET, BY PRODUCT TYPE, 2021-2031 ($MILLION)
- TABLE 64. AUSTRALIA PLASMA PROTEIN THERAPEUTICS MARKET, BY APPLICATION, 2021-2031 ($MILLION)
- TABLE 65. AUSTRALIA PLASMA PROTEIN THERAPEUTICS MARKET, BY END USER, 2021-2031 ($MILLION)
- TABLE 66. SOUTH KOREA PLASMA PROTEIN THERAPEUTICS MARKET, BY PRODUCT TYPE, 2021-2031 ($MILLION)
- TABLE 67. SOUTH KOREA PLASMA PROTEIN THERAPEUTICS MARKET, BY APPLICATION, 2021-2031 ($MILLION)
- TABLE 68. SOUTH KOREA PLASMA PROTEIN THERAPEUTICS MARKET, BY END USER, 2021-2031 ($MILLION)
- TABLE 69. REST OF ASIA-PACIFIC PLASMA PROTEIN THERAPEUTICS MARKET, BY PRODUCT TYPE, 2021-2031 ($MILLION)
- TABLE 70. REST OF ASIA-PACIFIC PLASMA PROTEIN THERAPEUTICS MARKET, BY APPLICATION, 2021-2031 ($MILLION)
- TABLE 71. REST OF ASIA-PACIFIC PLASMA PROTEIN THERAPEUTICS MARKET, BY END USER, 2021-2031 ($MILLION)
- TABLE 72. LAMEA PLASMA PROTEIN THERAPEUTICS MARKET, BY PRODUCT TYPE, 2021-2031 ($MILLION)
- TABLE 73. LAMEA PLASMA PROTEIN THERAPEUTICS MARKET, BY APPLICATION, 2021-2031 ($MILLION)
- TABLE 74. LAMEA PLASMA PROTEIN THERAPEUTICS MARKET, BY END USER, 2021-2031 ($MILLION)
- TABLE 75. LAMEA PLASMA PROTEIN THERAPEUTICS MARKET, BY COUNTRY, 2021-2031 ($MILLION)
- TABLE 76. BRAZIL PLASMA PROTEIN THERAPEUTICS MARKET, BY PRODUCT TYPE, 2021-2031 ($MILLION)
- TABLE 77. BRAZIL PLASMA PROTEIN THERAPEUTICS MARKET, BY APPLICATION, 2021-2031 ($MILLION)
- TABLE 78. BRAZIL PLASMA PROTEIN THERAPEUTICS MARKET, BY END USER, 2021-2031 ($MILLION)
- TABLE 79. SAUDI ARABIA PLASMA PROTEIN THERAPEUTICS MARKET, BY PRODUCT TYPE, 2021-2031 ($MILLION)
- TABLE 80. SAUDI ARABIA PLASMA PROTEIN THERAPEUTICS MARKET, BY APPLICATION, 2021-2031 ($MILLION)
- TABLE 81. SAUDI ARABIA PLASMA PROTEIN THERAPEUTICS MARKET, BY END USER, 2021-2031 ($MILLION)
- TABLE 82. SOUTH AFRICA PLASMA PROTEIN THERAPEUTICS MARKET, BY PRODUCT TYPE, 2021-2031 ($MILLION)
- TABLE 83. SOUTH AFRICA PLASMA PROTEIN THERAPEUTICS MARKET, BY APPLICATION, 2021-2031 ($MILLION)
- TABLE 84. SOUTH AFRICA PLASMA PROTEIN THERAPEUTICS MARKET, BY END USER, 2021-2031 ($MILLION)
- TABLE 85. REST OF LAMEA PLASMA PROTEIN THERAPEUTICS MARKET, BY PRODUCT TYPE, 2021-2031 ($MILLION)
- TABLE 86. REST OF LAMEA PLASMA PROTEIN THERAPEUTICS MARKET, BY APPLICATION, 2021-2031 ($MILLION)
- TABLE 87. REST OF LAMEA PLASMA PROTEIN THERAPEUTICS MARKET, BY END USER, 2021-2031 ($MILLION)
- TABLE 88. OCTAPHARMA AG: KEY EXECUTIVES
- TABLE 89. OCTAPHARMA AG: COMPANY SNAPSHOT
- TABLE 90. OCTAPHARMA AG: PRODUCT SEGMENTS
- TABLE 91. OCTAPHARMA AG: PRODUCT PORTFOLIO
- TABLE 92. OCTAPHARMA AG: KEY STRATERGIES
- TABLE 93. GRIFOLS, S.A.: KEY EXECUTIVES
- TABLE 94. GRIFOLS, S.A.: COMPANY SNAPSHOT
- TABLE 95. GRIFOLS, S.A.: PRODUCT SEGMENTS
- TABLE 96. GRIFOLS, S.A.: PRODUCT PORTFOLIO
- TABLE 97. GRIFOLS, S.A.: KEY STRATERGIES
- TABLE 98. BAXTER INTERNATIONAL INC.: KEY EXECUTIVES
- TABLE 99. BAXTER INTERNATIONAL INC.: COMPANY SNAPSHOT
- TABLE 100. BAXTER INTERNATIONAL INC.: PRODUCT SEGMENTS
- TABLE 101. BAXTER INTERNATIONAL INC.: PRODUCT PORTFOLIO
- TABLE 102. ADMA BIOLOGICS INC: KEY EXECUTIVES
- TABLE 103. ADMA BIOLOGICS INC: COMPANY SNAPSHOT
- TABLE 104. ADMA BIOLOGICS INC: PRODUCT SEGMENTS
- TABLE 105. ADMA BIOLOGICS INC: PRODUCT PORTFOLIO
- TABLE 106. ADMA BIOLOGICS INC: KEY STRATERGIES
- TABLE 107. BIO PRODUCTS LABORATORY LTD: KEY EXECUTIVES
- TABLE 108. BIO PRODUCTS LABORATORY LTD: COMPANY SNAPSHOT
- TABLE 109. BIO PRODUCTS LABORATORY LTD: PRODUCT SEGMENTS
- TABLE 110. BIO PRODUCTS LABORATORY LTD: PRODUCT PORTFOLIO
- TABLE 111. BIO PRODUCTS LABORATORY LTD: KEY STRATERGIES
- TABLE 112. TAKEDA PHARMACEUTICAL COMPANY LIMITED: KEY EXECUTIVES
- TABLE 113. TAKEDA PHARMACEUTICAL COMPANY LIMITED: COMPANY SNAPSHOT
- TABLE 114. TAKEDA PHARMACEUTICAL COMPANY LIMITED: PRODUCT SEGMENTS
- TABLE 115. TAKEDA PHARMACEUTICAL COMPANY LIMITED: PRODUCT PORTFOLIO
- TABLE 116. TAKEDA PHARMACEUTICAL COMPANY LIMITED: KEY STRATERGIES
- TABLE 117. CSL LIMITED: KEY EXECUTIVES
- TABLE 118. CSL LIMITED: COMPANY SNAPSHOT
- TABLE 119. CSL LIMITED: PRODUCT SEGMENTS
- TABLE 120. CSL LIMITED: PRODUCT PORTFOLIO
- TABLE 121. CSL LIMITED: KEY STRATERGIES
- TABLE 122. KEDRION, SPA: KEY EXECUTIVES
- TABLE 123. KEDRION, SPA: COMPANY SNAPSHOT
- TABLE 124. KEDRION, SPA: PRODUCT SEGMENTS
- TABLE 125. KEDRION, SPA: PRODUCT PORTFOLIO
- TABLE 126. KEDRION, SPA: KEY STRATERGIES
- TABLE 127. TAIBANG BIOLOGICAL GROUP CO., LTD: KEY EXECUTIVES
- TABLE 128. TAIBANG BIOLOGICAL GROUP CO., LTD: COMPANY SNAPSHOT
- TABLE 129. TAIBANG BIOLOGICAL GROUP CO., LTD: PRODUCT SEGMENTS
- TABLE 130. TAIBANG BIOLOGICAL GROUP CO., LTD: PRODUCT PORTFOLIO
- TABLE 131. BAYER AG: KEY EXECUTIVES
- TABLE 132. BAYER AG: COMPANY SNAPSHOT
- TABLE 133. BAYER AG: PRODUCT SEGMENTS
- TABLE 134. BAYER AG: PRODUCT PORTFOLIO
LIST OF FIGURES
- FIGURE 01. PLASMA PROTEIN THERAPEUTICS MARKET, 2021-2031
- FIGURE 02. SEGMENTATION OF PLASMA PROTEIN THERAPEUTICS MARKET, 2021-2031
- FIGURE 03. TOP INVESTMENT POCKETS IN PLASMA PROTEIN THERAPEUTICS MARKET (2022-2031)
- FIGURE 04. HIGH BARGAINING POWER OF SUPPLIERS
- FIGURE 05. MODERATE BARGAINING POWER OF BUYERS
- FIGURE 06. MODERATE THREAT OF SUBSTITUTES
- FIGURE 07. HIGH THREAT OF NEW ENTRANTS
- FIGURE 08. HIGH INTENSITY OF RIVALRY
- FIGURE 09. DRIVERS, RESTRAINTS AND OPPORTUNITIES: GLOBALPLASMA PROTEIN THERAPEUTICS MARKET
- FIGURE 10. PLASMA PROTEIN THERAPEUTICS MARKET, BY PRODUCT TYPE, 2021(%)
- FIGURE 11. COMPARATIVE SHARE ANALYSIS OF PLASMA PROTEIN THERAPEUTICS MARKET FOR IMMUNOGLOBULIN, BY COUNTRY 2021 AND 2031(%)
- FIGURE 12. COMPARATIVE SHARE ANALYSIS OF PLASMA PROTEIN THERAPEUTICS MARKET FOR ALBUMIN, BY COUNTRY 2021 AND 2031(%)
- FIGURE 13. COMPARATIVE SHARE ANALYSIS OF PLASMA PROTEIN THERAPEUTICS MARKET FOR PLASMA DERIVED FACTOR VIII, BY COUNTRY 2021 AND 2031(%)
- FIGURE 14. COMPARATIVE SHARE ANALYSIS OF PLASMA PROTEIN THERAPEUTICS MARKET FOR OTHERS, BY COUNTRY 2021 AND 2031(%)
- FIGURE 15. PLASMA PROTEIN THERAPEUTICS MARKET, BY APPLICATION, 2021(%)
- FIGURE 16. COMPARATIVE SHARE ANALYSIS OF PLASMA PROTEIN THERAPEUTICS MARKET FOR HEMOPHILIA, BY COUNTRY 2021 AND 2031(%)
- FIGURE 17. COMPARATIVE SHARE ANALYSIS OF PLASMA PROTEIN THERAPEUTICS MARKET FOR IDIOPATHIC THROMBOCYTOPENIC PURPURA, BY COUNTRY 2021 AND 2031(%)
- FIGURE 18. COMPARATIVE SHARE ANALYSIS OF PLASMA PROTEIN THERAPEUTICS MARKET FOR PRIMARY IMMUNODEFICIENCY DISORDER, BY COUNTRY 2021 AND 2031(%)
- FIGURE 19. COMPARATIVE SHARE ANALYSIS OF PLASMA PROTEIN THERAPEUTICS MARKET FOR OTHERS, BY COUNTRY 2021 AND 2031(%)
- FIGURE 20. PLASMA PROTEIN THERAPEUTICS MARKET, BY END USER, 2021(%)
- FIGURE 21. COMPARATIVE SHARE ANALYSIS OF PLASMA PROTEIN THERAPEUTICS MARKET FOR HOSPITALS, BY COUNTRY 2021 AND 2031(%)
- FIGURE 22. COMPARATIVE SHARE ANALYSIS OF PLASMA PROTEIN THERAPEUTICS MARKET FOR OTHERS, BY COUNTRY 2021 AND 2031(%)
- FIGURE 23. PLASMA PROTEIN THERAPEUTICS MARKET BY REGION, 2021
- FIGURE 24. U.S. PLASMA PROTEIN THERAPEUTICS MARKET, 2021-2031 ($MILLION)
- FIGURE 25. CANADA PLASMA PROTEIN THERAPEUTICS MARKET, 2021-2031 ($MILLION)
- FIGURE 26. MEXICO PLASMA PROTEIN THERAPEUTICS MARKET, 2021-2031 ($MILLION)
- FIGURE 27. GERMANY PLASMA PROTEIN THERAPEUTICS MARKET, 2021-2031 ($MILLION)
- FIGURE 28. FRANCE PLASMA PROTEIN THERAPEUTICS MARKET, 2021-2031 ($MILLION)
- FIGURE 29. UK PLASMA PROTEIN THERAPEUTICS MARKET, 2021-2031 ($MILLION)
- FIGURE 30. ITALY PLASMA PROTEIN THERAPEUTICS MARKET, 2021-2031 ($MILLION)
- FIGURE 31. SPAIN PLASMA PROTEIN THERAPEUTICS MARKET, 2021-2031 ($MILLION)
- FIGURE 32. REST OF EUROPE PLASMA PROTEIN THERAPEUTICS MARKET, 2021-2031 ($MILLION)
- FIGURE 33. JAPAN PLASMA PROTEIN THERAPEUTICS MARKET, 2021-2031 ($MILLION)
- FIGURE 34. CHINA PLASMA PROTEIN THERAPEUTICS MARKET, 2021-2031 ($MILLION)
- FIGURE 35. INDIA PLASMA PROTEIN THERAPEUTICS MARKET, 2021-2031 ($MILLION)
- FIGURE 36. AUSTRALIA PLASMA PROTEIN THERAPEUTICS MARKET, 2021-2031 ($MILLION)
- FIGURE 37. SOUTH KOREA PLASMA PROTEIN THERAPEUTICS MARKET, 2021-2031 ($MILLION)
- FIGURE 38. REST OF ASIA-PACIFIC PLASMA PROTEIN THERAPEUTICS MARKET, 2021-2031 ($MILLION)
- FIGURE 39. BRAZIL PLASMA PROTEIN THERAPEUTICS MARKET, 2021-2031 ($MILLION)
- FIGURE 40. SAUDI ARABIA PLASMA PROTEIN THERAPEUTICS MARKET, 2021-2031 ($MILLION)
- FIGURE 41. SOUTH AFRICA PLASMA PROTEIN THERAPEUTICS MARKET, 2021-2031 ($MILLION)
- FIGURE 42. REST OF LAMEA PLASMA PROTEIN THERAPEUTICS MARKET, 2021-2031 ($MILLION)
- FIGURE 43. TOP WINNING STRATEGIES, BY YEAR
- FIGURE 44. TOP WINNING STRATEGIES, BY DEVELOPMENT
- FIGURE 45. TOP WINNING STRATEGIES, BY COMPANY
- FIGURE 46. PRODUCT MAPPING OF TOP 10 PLAYERS
- FIGURE 47. COMPETITIVE DASHBOARD
- FIGURE 48. COMPETITIVE HEATMAP: PLASMA PROTEIN THERAPEUTICS MARKET
- FIGURE 49. TOP PLAYER POSITIONING, 2021
- FIGURE 50. OCTAPHARMA AG: SALES REVENUE, 2020-2022 ($MILLION)
- FIGURE 51. GRIFOLS, S.A.: NET REVENUE, 2020-2022 ($MILLION)
- FIGURE 52. GRIFOLS, S.A.: REVENUE SHARE BY SEGMENT, 2022 (%)
- FIGURE 53. GRIFOLS, S.A.: REVENUE SHARE BY REGION, 2022 (%)
- FIGURE 54. BAXTER INTERNATIONAL INC.: NET SALES, 2020-2022 ($MILLION)
- FIGURE 55. BAXTER INTERNATIONAL INC.: REVENUE SHARE BY SEGMENT, 2022 (%)
- FIGURE 56. BAXTER INTERNATIONAL INC.: REVENUE SHARE BY REGION, 2022 (%)
- FIGURE 57. ADMA BIOLOGICS INC: NET REVENUE, 2019-2021 ($MILLION)
- FIGURE 58. ADMA BIOLOGICS INC: REVENUE SHARE BY SEGMENT, 2021 (%)
- FIGURE 59. ADMA BIOLOGICS INC: REVENUE SHARE BY REGION, 2021 (%)
- FIGURE 60. TAKEDA PHARMACEUTICAL COMPANY LIMITED: NET REVENUE, 2019-2021 ($MILLION)
- FIGURE 61. CSL LIMITED: SALES REVENUE, 2020-2022 ($MILLION)
- FIGURE 62. CSL LIMITED: REVENUE SHARE BY SEGMENT, 2022 (%)
- FIGURE 63. CSL LIMITED: REVENUE SHARE BY REGION, 2022 (%)
- FIGURE 64. KEDRION, SPA: NET REVENUE, 2019-2021 ($MILLION)
- FIGURE 65. BAYER AG: NET SALES, 2020-2022 ($MILLION)
- FIGURE 66. BAYER AG: REVENUE SHARE BY SEGMENT, 2022 (%)
- FIGURE 67. BAYER AG: REVENUE SHARE BY REGION, 2022 (%)
 血漿蛋白治療市場,按產品類型、按應用、國家和地區 - 2024-2032 年行業分析、市場規模、市場佔有率和預測
 全球血漿蛋白治療市場:按產品類型、按應用、按最終用戶、按地區
 血漿蛋白治療市場規模、佔有率和趨勢分析報告:按產品、按用途、按地區和細分趨勢,2023-2030
 血漿蛋白治療市場:依產品、依用途- 2023-2030 年全球預測
 全球血漿蛋白治療市場規模、份額和行業趨勢分析報告:按最終用戶、按產品類型(免疫球蛋白、白蛋白、血漿衍生因子 VIII、其他)、按應用、按地區展望和預測,2023-2029 年
 2022-2029 年全球血漿蛋白治療市場規模研究與預測按產品類型,應用和地區分析
 血漿蛋白質治療的全球市場 - 成長,未來預測,競爭分析(2023年~2031年)
 重組血漿蛋白質治療的全球市場-成長,未來展望,競爭分析(2022年~2030年)
 全球血漿蛋白療法市場分析(2022-2032):產品/應用預測、區域/主要國家分析、主要公司、COVID-19恢復情景