


 |
市場調查報告書
商品編碼
1298226
壓力變送器市場:按類型(絕壓,表壓,差壓,多變量),最終用途行業(石油和天然氣,水和廢水處理,金屬和採礦,製藥,其他)2021-2031全球機會分析和行業預測Pressure Transmitter Market By Type (Absolute, Gauge, Differential, Multivariable), By End-use Industry (Oil & Gas, Water & Wastewater Treatment, Metals & Mining, Pharmaceutical, Others): Global Opportunity Analysis & Industry Forecast, 2021-2031 |
||||||
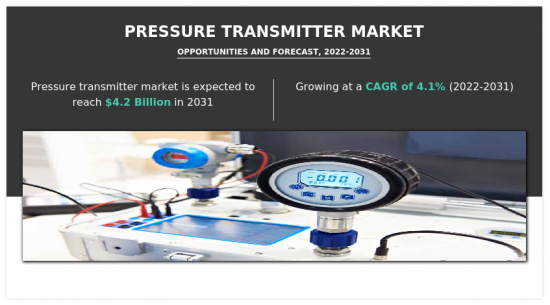
2021 年全球壓力變送器市場價值為 28.428 億美元,預計 2022 年至 2031 年復合年增長率為 4.12%,到 2031 年將達到 42.1918 億美元。
壓力變送器是一種傳感器,用於測量施加到液體,流體或氣體的壓力大小。 該裝置可以快速檢測壓力的變化,並通過壓力傳感器和電子放大器將其轉換為電信號。 壓力變送器通常與其他設備結合使用,測量深度,水流,高度和壓降等變量,並可以監測工業設備是否洩漏。 這些發射器具有很強的抗輻射和電磁場能力,非常適合化學,石油和天然氣,發電,食品和飲料,金屬和採礦等多種行業。
近年來,對工業自動化和過程優化的重視增加了對精確壓力測量和控制解決方案的需求。 這就是我們推出新的創新產品的原因。 市場上有各種各樣的壓力傳感器,例如絕壓傳感器,表壓傳感器和差壓傳感器,有有線和無線兩種型號。
壓力變送器市場按類型,最終用途行業和地區細分。 按類型劃分,市場分為絕壓,表壓,差壓和多元壓力。 按最終用途行業,可分為石油和天然氣,水和廢水處理,金屬和採礦,製藥和其他行業。 按地區劃分,北美(美國,加拿大,墨西哥),歐洲(英國,德國,法國,歐洲其他地區),亞太地區(中國,日本,印度,韓國,亞太地區其他地區),拉丁美洲(拉丁美洲,中東)□非洲)。
內容
第1章簡介
第 2 章執行摘要
第3章市場概述
- 市場定義和範圍
- 主要發現
- 影響因素
- 主要投資機會
- 波特五力分析
- 供應商的議價能力
- 買家的議價能力
- 替代品的威脅
- 新進入者的威脅
- 競爭強度
- 市場動態
- 驅動程序
- 更加關注工業自動化以優化資源利用
- 最終用途行業對準確可靠的壓力測量的需求
- 制約因素
- 需要維護和頻繁的軟件更新
- 機會
- 對多變量壓力傳感器的需求不斷增長
- 驅動程序
- COVID-19 對市場的影響分析
第 4 章壓力變送器市場,按類型
- 概述
- 市場規模和預測
- 絕對壓力
- 主要市場趨勢,增長因素,增長機會
- 市場規模和預測:按地區劃分
- 市場份額分析:按國家/地區劃分
- 表壓
- 主要市場趨勢,增長動力和機遇
- 市場規模和預測:按地區劃分
- 市場份額分析:按國家/地區劃分
- 差異化
- 主要市場趨勢,增長因素和機遇
- 市場規模和預測:按地區劃分
- 市場份額分析:按國家/地區劃分
- 多變量
- 主要市場趨勢,增長因素和機遇
- 市場規模和預測:按地區劃分
- 市場份額分析:按國家/地區劃分
第 5 章壓力變送器市場:按最終用途行業劃分
- 概述
- 市場規模和預測
- 石油和天然氣
- 主要市場趨勢,增長因素,增長機會
- 市場規模和預測:按地區劃分
- 市場份額分析:按國家/地區劃分
- 水和污水處理
- 主要市場趨勢,增長因素和機遇
- 市場規模和預測:按地區劃分
- 市場份額分析:按國家/地區劃分
- 金屬與採礦
- 主要市場趨勢,增長因素和機遇
- 市場規模和預測:按地區劃分
- 市場份額分析:按國家/地區劃分
- 藥品
- 主要市場趨勢,增長動力和機遇
- 市場規模和預測:按地區劃分
- 市場份額分析:按國家/地區劃分
- 其他
- 主要市場趨勢,增長因素和機遇
- 市場規模和預測:按地區劃分
- 市場份額分析:按國家/地區劃分
第 6 章壓力變送器市場:按地區
- 概述
- 市場規模和預測:按地區劃分
- 北美
- 主要趨勢和機遇
- 市場規模/預測:按類型
- 市場規模和預測:按最終用途行業劃分
- 市場規模/預測:按國家/地區劃分
- 美國
- 主要市場趨勢,增長因素和機遇
- 市場規模/預測:按類型
- 市場規模和預測:按最終用途行業劃分
- 加拿大
- 主要市場趨勢,增長動力和機遇
- 市場規模/預測:按類型
- 市場規模和預測:按最終用途行業劃分
- 墨西哥
- 主要市場趨勢,增長動力和機遇
- 市場規模/預測:按類型
- 市場規模和預測:按最終用途行業劃分
- 歐洲
- 主要趨勢和機遇
- 市場規模/預測:按類型
- 市場規模和預測:按最終用途行業劃分
- 市場規模/預測:按國家/地區劃分
- 英國
- 主要市場趨勢,增長因素,增長機會
- 市場規模/預測:按類型
- 市場規模和預測:按最終用途行業劃分
- 德國
- 主要市場趨勢,增長動力和機遇
- 市場規模/預測:按類型
- 市場規模和預測:按最終用途行業劃分
- 法國
- 主要市場趨勢,增長動力和機遇
- 市場規模/預測:按類型
- 市場規模和預測:按最終用途行業劃分
- 歐洲其他地區
- 主要市場趨勢,增長動力和機遇
- 市場規模/預測:按類型
- 市場規模和預測:按最終用途行業劃分
- 亞太地區
- 主要趨勢和機遇
- 市場規模/預測:按類型
- 市場規模和預測:按最終用途行業劃分
- 市場規模/預測:按國家/地區劃分
- 中國
- 主要市場趨勢,增長因素,增長機會
- 市場規模/預測:按類型
- 市場規模和預測:按最終用途行業劃分
- 日本
- 主要市場趨勢,增長因素,增長機會
- 市場規模/預測:按類型
- 市場規模和預測:按最終用途行業劃分
- 印度
- 主要市場趨勢,增長動力和機遇
- 市場規模/預測:按類型
- 市場規模和預測:按最終用途行業劃分
- 韓國
- 主要市場趨勢,增長動力和機遇
- 市場規模/預測:按類型
- 市場規模和預測:按最終用途行業劃分
- 亞太地區其他地區
- 主要市場趨勢,增長動力和機遇
- 市場規模/預測:按類型
- 市場規模和預測:按最終用途行業劃分
- 拉丁美洲/中東/非洲
- 主要趨勢和機遇
- 市場規模/預測:按類型
- 市場規模和預測:按最終用途行業劃分
- 市場規模/預測:按國家/地區劃分
- 拉丁美洲
- 主要市場趨勢,增長因素,增長機會
- 市場規模/預測:按類型
- 市場規模和預測:按最終用途行業劃分
- 中東
- 主要市場趨勢,增長動力和機遇
- 市場規模/預測:按類型
- 市場規模和預測:按最終用途行業劃分
- 非洲
- 主要市場趨勢,增長動力和機遇
- 市場規模/預測:按類型
- 市場規模和預測:按最終用途行業劃分
第7章競爭格局
- 簡介
- 關鍵成功策略
- 10家主要公司的產品圖譜
- 競賽儀表板
- 比賽熱圖
- 2021 年關鍵人物定位
第8章公司簡介
- Emerson Electric Co.
- ABB Ltd.
- Yokogawa India Ltd.
- Schneider Electric
- Siemens
- Omega Engineering, Inc.
- Danfoss
- Dwyer Instruments Inc
- WIKA Instruments India Pvt. Ltd.
- Honeywell Process Solutions
The global pressure transmitter market was valued at $2,842.8 million in 2021, and is projected to reach $4,219.18 million by 2031, registering a CAGR of 4.12% from 2022 to 2031.
A pressure transmitter is a type of sensor that measures the amount of pressure applied to a liquid, fluid, or gas. The device is capable of quickly detecting changes in pressure, which are then converted into electrical signals by the pressure transducer and electronic amplifier. The pressure transmitter is frequently utilized in conjunction with other devices to measure variables such as depth, water flow, altitude, and pressure loss, allowing industrial equipment to be monitored for any leaks. These transmitters are highly resistant to radiation and electromagnetic fields, making them ideal for a variety of industries including chemical, oil & gas, power generation, food & beverage, and metals & mining.
In recent years, there has been a significant emphasis on industrial automation and process optimization, driving the demand for accurate pressure measurement and control solutions. This has led to the introduction of new and innovative products. The market includes a wide range of pressure transmitters, including absolute, gauge, and differential pressure transmitters, available in both wired and wireless models.
The pressure transmitter market is segmented based on type, end-use industry, and region. By type, the market is divided into absolute, gauge, differential, and multivariable. By end-use industry, the market is categorized into oil & gas, water & wastewater treatment, metals & mining, pharmaceutical, and other industries. In terms of region, the market is analyzed across North America (U.S., Canada, and Mexico), Europe (UK, Germany, France, and rest of Europe), Asia-Pacific (China, Japan, India, South Korea, and rest of Asia-Pacific) and LAMEA (Latin America, the Middle East, and Africa).
The key players profiled in the pressure transmitter industry include: Schneider Electric, Siemens, ABB Ltd., Danfoss, Omega Engineering, Inc., Honeywell Process Solutions, Emerson Electric Co., Dwyer Instruments Inc., Yokogawa Electric Corporation, and WIKA Instruments India Pvt. Ltd.
Key Benefits For Stakeholders
- This report provides a quantitative analysis of the market segments, current trends, estimations, and dynamics of the pressure transmitter market analysis from 2021 to 2031 to identify the prevailing pressure transmitter market opportunities.
- The market research is offered along with information related to key drivers, restraints, and opportunities.
- Porter's five forces analysis highlights the potency of buyers and suppliers to enable stakeholders make profit-oriented business decisions and strengthen their supplier-buyer network.
- In-depth analysis of the pressure transmitter market segmentation assists to determine the prevailing market opportunities.
- Major countries in each region are mapped according to their revenue contribution to the global market.
- Market player positioning facilitates benchmarking and provides a clear understanding of the present position of the market players.
- The report includes the analysis of the regional as well as global pressure transmitter market trends, key players, market segments, application areas, and market growth strategies.
Key Market Segments
By End-use Industry
- Oil and Gas
- Water and Wastewater Treatment
- Metals and Mining
- Pharmaceutical
- Others
By Type
- Absolute
- Gauge
- Differential
- Multivariable
By Region
- North America
- U.S.
- Canada
- Mexico
- Europe
- UK
- Germany
- France
- Rest of Europe
- Asia-Pacific
- China
- Japan
- India
- South Korea
- Rest of Asia-Pacific
- LAMEA
- Latin America
- Middle East
- Africa
Key Market Players:
- Honeywell Process Solutions
- Omega Engineering, Inc.
- Schneider Electric
- Siemens
- ABB Ltd.
- Danfoss
- Emerson Electric Co.
- Dwyer Instruments Inc
- Yokogawa India Ltd.
- WIKA Instruments India Pvt. Ltd.
TABLE OF CONTENTS
CHAPTER 1: INTRODUCTION
- 1.1. Report description
- 1.2. Key market segments
- 1.3. Key benefits to the stakeholders
- 1.4. Research Methodology
- 1.4.1. Primary research
- 1.4.2. Secondary research
- 1.4.3. Analyst tools and models
CHAPTER 2: EXECUTIVE SUMMARY
- 2.1. CXO Perspective
CHAPTER 3: MARKET OVERVIEW
- 3.1. Market definition and scope
- 3.2. Key findings
- 3.2.1. Top impacting factors
- 3.2.2. Top investment pockets
- 3.3. Porter's five forces analysis
- 3.3.1. Bargaining power of suppliers
- 3.3.2. Bargaining power of buyers
- 3.3.3. Threat of substitutes
- 3.3.4. Threat of new entrants
- 3.3.5. Intensity of rivalry
- 3.4. Market dynamics
- 3.4.1. Drivers
- 3.4.1.1. Increasing focus on industrial automation for optimal use of resources
- 3.4.1.2. Need for accurate and reliable pressure measurement in end-use industries
- 3.4.1. Drivers
- 3.4.2. Restraints
- 3.4.2.1. The need for maintenance and frequent software updates
- 3.4.3. Opportunities
- 3.4.3.1. Rise in demand for multivariable pressure transmitters
- 3.5. COVID-19 Impact Analysis on the market
CHAPTER 4: PRESSURE TRANSMITTER MARKET, BY TYPE
- 4.1. Overview
- 4.1.1. Market size and forecast
- 4.2. Absolute
- 4.2.1. Key market trends, growth factors and opportunities
- 4.2.2. Market size and forecast, by region
- 4.2.3. Market share analysis by country
- 4.3. Gauge
- 4.3.1. Key market trends, growth factors and opportunities
- 4.3.2. Market size and forecast, by region
- 4.3.3. Market share analysis by country
- 4.4. Differential
- 4.4.1. Key market trends, growth factors and opportunities
- 4.4.2. Market size and forecast, by region
- 4.4.3. Market share analysis by country
- 4.5. Multivariable
- 4.5.1. Key market trends, growth factors and opportunities
- 4.5.2. Market size and forecast, by region
- 4.5.3. Market share analysis by country
CHAPTER 5: PRESSURE TRANSMITTER MARKET, BY END-USE INDUSTRY
- 5.1. Overview
- 5.1.1. Market size and forecast
- 5.2. Oil and Gas
- 5.2.1. Key market trends, growth factors and opportunities
- 5.2.2. Market size and forecast, by region
- 5.2.3. Market share analysis by country
- 5.3. Water and Wastewater Treatment
- 5.3.1. Key market trends, growth factors and opportunities
- 5.3.2. Market size and forecast, by region
- 5.3.3. Market share analysis by country
- 5.4. Metals and Mining
- 5.4.1. Key market trends, growth factors and opportunities
- 5.4.2. Market size and forecast, by region
- 5.4.3. Market share analysis by country
- 5.5. Pharmaceutical
- 5.5.1. Key market trends, growth factors and opportunities
- 5.5.2. Market size and forecast, by region
- 5.5.3. Market share analysis by country
- 5.6. Others
- 5.6.1. Key market trends, growth factors and opportunities
- 5.6.2. Market size and forecast, by region
- 5.6.3. Market share analysis by country
CHAPTER 6: PRESSURE TRANSMITTER MARKET, BY REGION
- 6.1. Overview
- 6.1.1. Market size and forecast By Region
- 6.2. North America
- 6.2.1. Key trends and opportunities
- 6.2.2. Market size and forecast, by Type
- 6.2.3. Market size and forecast, by End-use Industry
- 6.2.4. Market size and forecast, by country
- 6.2.4.1. U.S.
- 6.2.4.1.1. Key market trends, growth factors and opportunities
- 6.2.4.1.2. Market size and forecast, by Type
- 6.2.4.1.3. Market size and forecast, by End-use Industry
- 6.2.4.2. Canada
- 6.2.4.2.1. Key market trends, growth factors and opportunities
- 6.2.4.2.2. Market size and forecast, by Type
- 6.2.4.2.3. Market size and forecast, by End-use Industry
- 6.2.4.3. Mexico
- 6.2.4.3.1. Key market trends, growth factors and opportunities
- 6.2.4.3.2. Market size and forecast, by Type
- 6.2.4.3.3. Market size and forecast, by End-use Industry
- 6.3. Europe
- 6.3.1. Key trends and opportunities
- 6.3.2. Market size and forecast, by Type
- 6.3.3. Market size and forecast, by End-use Industry
- 6.3.4. Market size and forecast, by country
- 6.3.4.1. UK
- 6.3.4.1.1. Key market trends, growth factors and opportunities
- 6.3.4.1.2. Market size and forecast, by Type
- 6.3.4.1.3. Market size and forecast, by End-use Industry
- 6.3.4.2. Germany
- 6.3.4.2.1. Key market trends, growth factors and opportunities
- 6.3.4.2.2. Market size and forecast, by Type
- 6.3.4.2.3. Market size and forecast, by End-use Industry
- 6.3.4.3. France
- 6.3.4.3.1. Key market trends, growth factors and opportunities
- 6.3.4.3.2. Market size and forecast, by Type
- 6.3.4.3.3. Market size and forecast, by End-use Industry
- 6.3.4.4. Rest of Europe
- 6.3.4.4.1. Key market trends, growth factors and opportunities
- 6.3.4.4.2. Market size and forecast, by Type
- 6.3.4.4.3. Market size and forecast, by End-use Industry
- 6.4. Asia-Pacific
- 6.4.1. Key trends and opportunities
- 6.4.2. Market size and forecast, by Type
- 6.4.3. Market size and forecast, by End-use Industry
- 6.4.4. Market size and forecast, by country
- 6.4.4.1. China
- 6.4.4.1.1. Key market trends, growth factors and opportunities
- 6.4.4.1.2. Market size and forecast, by Type
- 6.4.4.1.3. Market size and forecast, by End-use Industry
- 6.4.4.2. Japan
- 6.4.4.2.1. Key market trends, growth factors and opportunities
- 6.4.4.2.2. Market size and forecast, by Type
- 6.4.4.2.3. Market size and forecast, by End-use Industry
- 6.4.4.3. India
- 6.4.4.3.1. Key market trends, growth factors and opportunities
- 6.4.4.3.2. Market size and forecast, by Type
- 6.4.4.3.3. Market size and forecast, by End-use Industry
- 6.4.4.4. South Korea
- 6.4.4.4.1. Key market trends, growth factors and opportunities
- 6.4.4.4.2. Market size and forecast, by Type
- 6.4.4.4.3. Market size and forecast, by End-use Industry
- 6.4.4.5. Rest of Asia-Pacific
- 6.4.4.5.1. Key market trends, growth factors and opportunities
- 6.4.4.5.2. Market size and forecast, by Type
- 6.4.4.5.3. Market size and forecast, by End-use Industry
- 6.5. LAMEA
- 6.5.1. Key trends and opportunities
- 6.5.2. Market size and forecast, by Type
- 6.5.3. Market size and forecast, by End-use Industry
- 6.5.4. Market size and forecast, by country
- 6.5.4.1. Latin America
- 6.5.4.1.1. Key market trends, growth factors and opportunities
- 6.5.4.1.2. Market size and forecast, by Type
- 6.5.4.1.3. Market size and forecast, by End-use Industry
- 6.5.4.2. Middle East
- 6.5.4.2.1. Key market trends, growth factors and opportunities
- 6.5.4.2.2. Market size and forecast, by Type
- 6.5.4.2.3. Market size and forecast, by End-use Industry
- 6.5.4.3. Africa
- 6.5.4.3.1. Key market trends, growth factors and opportunities
- 6.5.4.3.2. Market size and forecast, by Type
- 6.5.4.3.3. Market size and forecast, by End-use Industry
CHAPTER 7: COMPETITIVE LANDSCAPE
- 7.1. Introduction
- 7.2. Top winning strategies
- 7.3. Product Mapping of Top 10 Player
- 7.4. Competitive Dashboard
- 7.5. Competitive Heatmap
- 7.6. Top player positioning, 2021
CHAPTER 8: COMPANY PROFILES
- 8.1. Emerson Electric Co.
- 8.1.1. Company overview
- 8.1.2. Key Executives
- 8.1.3. Company snapshot
- 8.1.4. Operating business segments
- 8.1.5. Product portfolio
- 8.1.6. Business performance
- 8.1.7. Key strategic moves and developments
- 8.2. ABB Ltd.
- 8.2.1. Company overview
- 8.2.2. Key Executives
- 8.2.3. Company snapshot
- 8.2.4. Operating business segments
- 8.2.5. Product portfolio
- 8.2.6. Business performance
- 8.2.7. Key strategic moves and developments
- 8.3. Yokogawa India Ltd.
- 8.3.1. Company overview
- 8.3.2. Key Executives
- 8.3.3. Company snapshot
- 8.3.4. Operating business segments
- 8.3.5. Product portfolio
- 8.3.6. Business performance
- 8.4. Schneider Electric
- 8.4.1. Company overview
- 8.4.2. Key Executives
- 8.4.3. Company snapshot
- 8.4.4. Operating business segments
- 8.4.5. Product portfolio
- 8.4.6. Business performance
- 8.5. Siemens
- 8.5.1. Company overview
- 8.5.2. Key Executives
- 8.5.3. Company snapshot
- 8.5.4. Operating business segments
- 8.5.5. Product portfolio
- 8.5.6. Business performance
- 8.6. Omega Engineering, Inc.
- 8.6.1. Company overview
- 8.6.2. Key Executives
- 8.6.3. Company snapshot
- 8.6.4. Operating business segments
- 8.6.5. Product portfolio
- 8.6.6. Key strategic moves and developments
- 8.7. Danfoss
- 8.7.1. Company overview
- 8.7.2. Key Executives
- 8.7.3. Company snapshot
- 8.7.4. Operating business segments
- 8.7.5. Product portfolio
- 8.7.6. Key strategic moves and developments
- 8.8. Dwyer Instruments Inc
- 8.8.1. Company overview
- 8.8.2. Key Executives
- 8.8.3. Company snapshot
- 8.8.4. Operating business segments
- 8.8.5. Product portfolio
- 8.8.6. Key strategic moves and developments
- 8.9. WIKA Instruments India Pvt. Ltd.
- 8.9.1. Company overview
- 8.9.2. Key Executives
- 8.9.3. Company snapshot
- 8.9.4. Operating business segments
- 8.9.5. Product portfolio
- 8.9.6. Key strategic moves and developments
- 8.10. Honeywell Process Solutions
- 8.10.1. Company overview
- 8.10.2. Key Executives
- 8.10.3. Company snapshot
- 8.10.4. Operating business segments
- 8.10.5. Product portfolio
LIST OF TABLES
- TABLE 01. GLOBAL PRESSURE TRANSMITTER MARKET, BY TYPE, 2021-2031 ($MILLION)
- TABLE 02. PRESSURE TRANSMITTER MARKET FOR ABSOLUTE, BY REGION, 2021-2031 ($MILLION)
- TABLE 03. PRESSURE TRANSMITTER MARKET FOR GAUGE, BY REGION, 2021-2031 ($MILLION)
- TABLE 04. PRESSURE TRANSMITTER MARKET FOR DIFFERENTIAL, BY REGION, 2021-2031 ($MILLION)
- TABLE 05. PRESSURE TRANSMITTER MARKET FOR MULTIVARIABLE, BY REGION, 2021-2031 ($MILLION)
- TABLE 06. GLOBAL PRESSURE TRANSMITTER MARKET, BY END-USE INDUSTRY, 2021-2031 ($MILLION)
- TABLE 07. PRESSURE TRANSMITTER MARKET FOR OIL AND GAS, BY REGION, 2021-2031 ($MILLION)
- TABLE 08. PRESSURE TRANSMITTER MARKET FOR WATER AND WASTEWATER TREATMENT, BY REGION, 2021-2031 ($MILLION)
- TABLE 09. PRESSURE TRANSMITTER MARKET FOR METALS AND MINING, BY REGION, 2021-2031 ($MILLION)
- TABLE 10. PRESSURE TRANSMITTER MARKET FOR PHARMACEUTICAL, BY REGION, 2021-2031 ($MILLION)
- TABLE 11. PRESSURE TRANSMITTER MARKET FOR OTHERS, BY REGION, 2021-2031 ($MILLION)
- TABLE 12. PRESSURE TRANSMITTER MARKET, BY REGION, 2021-2031 ($MILLION)
- TABLE 13. NORTH AMERICA PRESSURE TRANSMITTER MARKET, BY TYPE, 2021-2031 ($MILLION)
- TABLE 14. NORTH AMERICA PRESSURE TRANSMITTER MARKET, BY END-USE INDUSTRY, 2021-2031 ($MILLION)
- TABLE 15. NORTH AMERICA PRESSURE TRANSMITTER MARKET, BY COUNTRY, 2021-2031 ($MILLION)
- TABLE 16. U.S. PRESSURE TRANSMITTER MARKET, BY TYPE, 2021-2031 ($MILLION)
- TABLE 17. U.S. PRESSURE TRANSMITTER MARKET, BY END-USE INDUSTRY, 2021-2031 ($MILLION)
- TABLE 18. CANADA PRESSURE TRANSMITTER MARKET, BY TYPE, 2021-2031 ($MILLION)
- TABLE 19. CANADA PRESSURE TRANSMITTER MARKET, BY END-USE INDUSTRY, 2021-2031 ($MILLION)
- TABLE 20. MEXICO PRESSURE TRANSMITTER MARKET, BY TYPE, 2021-2031 ($MILLION)
- TABLE 21. MEXICO PRESSURE TRANSMITTER MARKET, BY END-USE INDUSTRY, 2021-2031 ($MILLION)
- TABLE 22. EUROPE PRESSURE TRANSMITTER MARKET, BY TYPE, 2021-2031 ($MILLION)
- TABLE 23. EUROPE PRESSURE TRANSMITTER MARKET, BY END-USE INDUSTRY, 2021-2031 ($MILLION)
- TABLE 24. EUROPE PRESSURE TRANSMITTER MARKET, BY COUNTRY, 2021-2031 ($MILLION)
- TABLE 25. UK PRESSURE TRANSMITTER MARKET, BY TYPE, 2021-2031 ($MILLION)
- TABLE 26. UK PRESSURE TRANSMITTER MARKET, BY END-USE INDUSTRY, 2021-2031 ($MILLION)
- TABLE 27. GERMANY PRESSURE TRANSMITTER MARKET, BY TYPE, 2021-2031 ($MILLION)
- TABLE 28. GERMANY PRESSURE TRANSMITTER MARKET, BY END-USE INDUSTRY, 2021-2031 ($MILLION)
- TABLE 29. FRANCE PRESSURE TRANSMITTER MARKET, BY TYPE, 2021-2031 ($MILLION)
- TABLE 30. FRANCE PRESSURE TRANSMITTER MARKET, BY END-USE INDUSTRY, 2021-2031 ($MILLION)
- TABLE 31. REST OF EUROPE PRESSURE TRANSMITTER MARKET, BY TYPE, 2021-2031 ($MILLION)
- TABLE 32. REST OF EUROPE PRESSURE TRANSMITTER MARKET, BY END-USE INDUSTRY, 2021-2031 ($MILLION)
- TABLE 33. ASIA-PACIFIC PRESSURE TRANSMITTER MARKET, BY TYPE, 2021-2031 ($MILLION)
- TABLE 34. ASIA-PACIFIC PRESSURE TRANSMITTER MARKET, BY END-USE INDUSTRY, 2021-2031 ($MILLION)
- TABLE 35. ASIA-PACIFIC PRESSURE TRANSMITTER MARKET, BY COUNTRY, 2021-2031 ($MILLION)
- TABLE 36. CHINA PRESSURE TRANSMITTER MARKET, BY TYPE, 2021-2031 ($MILLION)
- TABLE 37. CHINA PRESSURE TRANSMITTER MARKET, BY END-USE INDUSTRY, 2021-2031 ($MILLION)
- TABLE 38. JAPAN PRESSURE TRANSMITTER MARKET, BY TYPE, 2021-2031 ($MILLION)
- TABLE 39. JAPAN PRESSURE TRANSMITTER MARKET, BY END-USE INDUSTRY, 2021-2031 ($MILLION)
- TABLE 40. INDIA PRESSURE TRANSMITTER MARKET, BY TYPE, 2021-2031 ($MILLION)
- TABLE 41. INDIA PRESSURE TRANSMITTER MARKET, BY END-USE INDUSTRY, 2021-2031 ($MILLION)
- TABLE 42. SOUTH KOREA PRESSURE TRANSMITTER MARKET, BY TYPE, 2021-2031 ($MILLION)
- TABLE 43. SOUTH KOREA PRESSURE TRANSMITTER MARKET, BY END-USE INDUSTRY, 2021-2031 ($MILLION)
- TABLE 44. REST OF ASIA-PACIFIC PRESSURE TRANSMITTER MARKET, BY TYPE, 2021-2031 ($MILLION)
- TABLE 45. REST OF ASIA-PACIFIC PRESSURE TRANSMITTER MARKET, BY END-USE INDUSTRY, 2021-2031 ($MILLION)
- TABLE 46. LAMEA PRESSURE TRANSMITTER MARKET, BY TYPE, 2021-2031 ($MILLION)
- TABLE 47. LAMEA PRESSURE TRANSMITTER MARKET, BY END-USE INDUSTRY, 2021-2031 ($MILLION)
- TABLE 48. LAMEA PRESSURE TRANSMITTER MARKET, BY COUNTRY, 2021-2031 ($MILLION)
- TABLE 49. LATIN AMERICA PRESSURE TRANSMITTER MARKET, BY TYPE, 2021-2031 ($MILLION)
- TABLE 50. LATIN AMERICA PRESSURE TRANSMITTER MARKET, BY END-USE INDUSTRY, 2021-2031 ($MILLION)
- TABLE 51. MIDDLE EAST PRESSURE TRANSMITTER MARKET, BY TYPE, 2021-2031 ($MILLION)
- TABLE 52. MIDDLE EAST PRESSURE TRANSMITTER MARKET, BY END-USE INDUSTRY, 2021-2031 ($MILLION)
- TABLE 53. AFRICA PRESSURE TRANSMITTER MARKET, BY TYPE, 2021-2031 ($MILLION)
- TABLE 54. AFRICA PRESSURE TRANSMITTER MARKET, BY END-USE INDUSTRY, 2021-2031 ($MILLION)
- TABLE 55. EMERSON ELECTRIC CO.: KEY EXECUTIVES
- TABLE 56. EMERSON ELECTRIC CO.: COMPANY SNAPSHOT
- TABLE 57. EMERSON ELECTRIC CO.: PRODUCT SEGMENTS
- TABLE 58. EMERSON ELECTRIC CO.: PRODUCT PORTFOLIO
- TABLE 59. EMERSON ELECTRIC CO.: KEY STRATERGIES
- TABLE 60. ABB LTD.: KEY EXECUTIVES
- TABLE 61. ABB LTD.: COMPANY SNAPSHOT
- TABLE 62. ABB LTD.: PRODUCT SEGMENTS
- TABLE 63. ABB LTD.: PRODUCT PORTFOLIO
- TABLE 64. ABB LTD.: KEY STRATERGIES
- TABLE 65. YOKOGAWA INDIA LTD.: KEY EXECUTIVES
- TABLE 66. YOKOGAWA INDIA LTD.: COMPANY SNAPSHOT
- TABLE 67. YOKOGAWA INDIA LTD.: PRODUCT SEGMENTS
- TABLE 68. YOKOGAWA INDIA LTD.: PRODUCT PORTFOLIO
- TABLE 69. SCHNEIDER ELECTRIC: KEY EXECUTIVES
- TABLE 70. SCHNEIDER ELECTRIC: COMPANY SNAPSHOT
- TABLE 71. SCHNEIDER ELECTRIC: PRODUCT SEGMENTS
- TABLE 72. SCHNEIDER ELECTRIC: PRODUCT PORTFOLIO
- TABLE 73. SIEMENS: KEY EXECUTIVES
- TABLE 74. SIEMENS: COMPANY SNAPSHOT
- TABLE 75. SIEMENS: PRODUCT SEGMENTS
- TABLE 76. SIEMENS: PRODUCT PORTFOLIO
- TABLE 77. OMEGA ENGINEERING, INC.: KEY EXECUTIVES
- TABLE 78. OMEGA ENGINEERING, INC.: COMPANY SNAPSHOT
- TABLE 79. OMEGA ENGINEERING, INC.: PRODUCT SEGMENTS
- TABLE 80. OMEGA ENGINEERING, INC.: PRODUCT PORTFOLIO
- TABLE 81. OMEGA ENGINEERING, INC.: KEY STRATERGIES
- TABLE 82. DANFOSS: KEY EXECUTIVES
- TABLE 83. DANFOSS: COMPANY SNAPSHOT
- TABLE 84. DANFOSS: PRODUCT SEGMENTS
- TABLE 85. DANFOSS: PRODUCT PORTFOLIO
- TABLE 86. DANFOSS: KEY STRATERGIES
- TABLE 87. DWYER INSTRUMENTS INC: KEY EXECUTIVES
- TABLE 88. DWYER INSTRUMENTS INC: COMPANY SNAPSHOT
- TABLE 89. DWYER INSTRUMENTS INC: PRODUCT SEGMENTS
- TABLE 90. DWYER INSTRUMENTS INC: PRODUCT PORTFOLIO
- TABLE 91. DWYER INSTRUMENTS INC: KEY STRATERGIES
- TABLE 92. WIKA INSTRUMENTS INDIA PVT. LTD.: KEY EXECUTIVES
- TABLE 93. WIKA INSTRUMENTS INDIA PVT. LTD.: COMPANY SNAPSHOT
- TABLE 94. WIKA INSTRUMENTS INDIA PVT. LTD.: PRODUCT SEGMENTS
- TABLE 95. WIKA INSTRUMENTS INDIA PVT. LTD.: PRODUCT PORTFOLIO
- TABLE 96. WIKA INSTRUMENTS INDIA PVT. LTD.: KEY STRATERGIES
- TABLE 97. HONEYWELL PROCESS SOLUTIONS: KEY EXECUTIVES
- TABLE 98. HONEYWELL PROCESS SOLUTIONS: COMPANY SNAPSHOT
- TABLE 99. HONEYWELL PROCESS SOLUTIONS: PRODUCT SEGMENTS
- TABLE 100. HONEYWELL PROCESS SOLUTIONS: PRODUCT PORTFOLIO
LIST OF FIGURES
- FIGURE 01. PRESSURE TRANSMITTER MARKET, 2021-2031
- FIGURE 02. SEGMENTATION OF PRESSURE TRANSMITTER MARKET, 2021-2031
- FIGURE 03. TOP INVESTMENT POCKETS IN PRESSURE TRANSMITTER MARKET (2022-2031)
- FIGURE 04. MODERATE BARGAINING POWER OF SUPPLIERS
- FIGURE 05. MODERATE TO HIGH BARGAINING POWER OF BUYERS
- FIGURE 06. LOW THREAT OF SUBSTITUTES
- FIGURE 07. MODERATE THREAT OF NEW ENTRANTS
- FIGURE 08. MODERATE TO HIGH INTENSITY OF RIVALRY
- FIGURE 09. DRIVERS, RESTRAINTS AND OPPORTUNITIES: GLOBALPRESSURE TRANSMITTER MARKET
- FIGURE 10. PRESSURE TRANSMITTER MARKET, BY TYPE, 2021(%)
- FIGURE 11. COMPARATIVE SHARE ANALYSIS OF PRESSURE TRANSMITTER MARKET FOR ABSOLUTE, BY COUNTRY 2021 AND 2031(%)
- FIGURE 12. COMPARATIVE SHARE ANALYSIS OF PRESSURE TRANSMITTER MARKET FOR GAUGE, BY COUNTRY 2021 AND 2031(%)
- FIGURE 13. COMPARATIVE SHARE ANALYSIS OF PRESSURE TRANSMITTER MARKET FOR DIFFERENTIAL, BY COUNTRY 2021 AND 2031(%)
- FIGURE 14. COMPARATIVE SHARE ANALYSIS OF PRESSURE TRANSMITTER MARKET FOR MULTIVARIABLE, BY COUNTRY 2021 AND 2031(%)
- FIGURE 15. PRESSURE TRANSMITTER MARKET, BY END-USE INDUSTRY, 2021(%)
- FIGURE 16. COMPARATIVE SHARE ANALYSIS OF PRESSURE TRANSMITTER MARKET FOR OIL AND GAS, BY COUNTRY 2021 AND 2031(%)
- FIGURE 17. COMPARATIVE SHARE ANALYSIS OF PRESSURE TRANSMITTER MARKET FOR WATER AND WASTEWATER TREATMENT, BY COUNTRY 2021 AND 2031(%)
- FIGURE 18. COMPARATIVE SHARE ANALYSIS OF PRESSURE TRANSMITTER MARKET FOR METALS AND MINING, BY COUNTRY 2021 AND 2031(%)
- FIGURE 19. COMPARATIVE SHARE ANALYSIS OF PRESSURE TRANSMITTER MARKET FOR PHARMACEUTICAL, BY COUNTRY 2021 AND 2031(%)
- FIGURE 20. COMPARATIVE SHARE ANALYSIS OF PRESSURE TRANSMITTER MARKET FOR OTHERS, BY COUNTRY 2021 AND 2031(%)
- FIGURE 21. PRESSURE TRANSMITTER MARKET BY REGION, 2021
- FIGURE 22. U.S. PRESSURE TRANSMITTER MARKET, 2021-2031 ($MILLION)
- FIGURE 23. CANADA PRESSURE TRANSMITTER MARKET, 2021-2031 ($MILLION)
- FIGURE 24. MEXICO PRESSURE TRANSMITTER MARKET, 2021-2031 ($MILLION)
- FIGURE 25. UK PRESSURE TRANSMITTER MARKET, 2021-2031 ($MILLION)
- FIGURE 26. GERMANY PRESSURE TRANSMITTER MARKET, 2021-2031 ($MILLION)
- FIGURE 27. FRANCE PRESSURE TRANSMITTER MARKET, 2021-2031 ($MILLION)
- FIGURE 28. REST OF EUROPE PRESSURE TRANSMITTER MARKET, 2021-2031 ($MILLION)
- FIGURE 29. CHINA PRESSURE TRANSMITTER MARKET, 2021-2031 ($MILLION)
- FIGURE 30. JAPAN PRESSURE TRANSMITTER MARKET, 2021-2031 ($MILLION)
- FIGURE 31. INDIA PRESSURE TRANSMITTER MARKET, 2021-2031 ($MILLION)
- FIGURE 32. SOUTH KOREA PRESSURE TRANSMITTER MARKET, 2021-2031 ($MILLION)
- FIGURE 33. REST OF ASIA-PACIFIC PRESSURE TRANSMITTER MARKET, 2021-2031 ($MILLION)
- FIGURE 34. LATIN AMERICA PRESSURE TRANSMITTER MARKET, 2021-2031 ($MILLION)
- FIGURE 35. MIDDLE EAST PRESSURE TRANSMITTER MARKET, 2021-2031 ($MILLION)
- FIGURE 36. AFRICA PRESSURE TRANSMITTER MARKET, 2021-2031 ($MILLION)
- FIGURE 37. TOP WINNING STRATEGIES, BY YEAR
- FIGURE 38. TOP WINNING STRATEGIES, BY DEVELOPMENT
- FIGURE 39. TOP WINNING STRATEGIES, BY COMPANY
- FIGURE 40. PRODUCT MAPPING OF TOP 10 PLAYERS
- FIGURE 41. COMPETITIVE DASHBOARD
- FIGURE 42. COMPETITIVE HEATMAP: PRESSURE TRANSMITTER MARKET
- FIGURE 43. TOP PLAYER POSITIONING, 2021
- FIGURE 44. EMERSON ELECTRIC CO.: NET SALES, 2020-2022 ($MILLION)
- FIGURE 45. EMERSON ELECTRIC CO.: RESEARCH & DEVELOPMENT EXPENDITURE, 2020-2022 ($MILLION)
- FIGURE 46. EMERSON ELECTRIC CO.: REVENUE SHARE BY SEGMENT, 2021 (%)
- FIGURE 47. EMERSON ELECTRIC CO.: REVENUE SHARE BY REGION, 2021 (%)
- FIGURE 48. ABB: NET REVENUE, 2020-2022 ($MILLION)
- FIGURE 49. ABB: RESEARCH & DEVELOPMENT EXPENDITURE, 2020-2022 ($MILLION)
- FIGURE 50. ABB: REVENUE SHARE BY SEGMENT, 2022 (%)
- FIGURE 51. ABB: REVENUE SHARE BY REGION, 2022 (%)
- FIGURE 52. YOKOGAWA INDIA LTD.: NET SALES, 2019-2021 ($MILLION)
- FIGURE 53. YOKOGAWA INDIA LTD.: RESEARCH & DEVELOPMENT EXPENDITURE, 2019-2021 ($MILLION)
- FIGURE 54. YOKOGAWA INDIA LTD.: REVENUE SHARE BY SEGMENT, 2021 (%)
- FIGURE 55. YOKOGAWA INDIA LTD.: REVENUE SHARE BY REGION, 2021 (%)
- FIGURE 56. SCHNEIDER ELECTRIC: NET REVENUE, 2019-2021 ($MILLION)
- FIGURE 57. SCHNEIDER ELECTRIC: REVENUE SHARE BY SEGMENT, 2021 (%)
- FIGURE 58. SCHNEIDER ELECTRIC: REVENUE SHARE BY REGION, 2021 (%)
- FIGURE 59. SIEMENS: NET REVENUE, 2020-2022 ($MILLION)
- FIGURE 60. SIEMENS: REVENUE SHARE BY SEGMENT, 2022 (%)
- FIGURE 61. SIEMENS: REVENUE SHARE BY REGION, 2022 (%)
 2024-2032 年按類型、感測技術、流體類型、應用、最終用途產業和地區分類的壓力變送器市場報告
 全球壓力感測器市場
 壓力變送器市場:2023-2028年全球行業趨勢、佔有率、規模、成長、機會及預測
 到 2028 年的壓力變送器市場預測 - 按類型、流體類型、傳感技術、技術、應用、最終用戶和地區分列的全球分析
 壓力傳送器的全球市場-佔有率,規模,趨勢,產業分析:各液體類型(液體,氣體·蒸氣),各用途,各類型,各最終用途,各地區;各市場區隔預測(2022年~2030年)
 壓力傳送器的全球市場:預測(2022年~2027年)
 壓力傳送器的全球市場-市場規模,佔有率,產業趨勢:各類型,各應用領域,各液體類型,各業界,各地區-展望及預測(2022年~2028年)
 壓力變送器全球市場:傳感技術,類型(絕壓,表壓,差壓,多變量),流體類型(液體,氣體,蒸汽),應用(液位,壓力,流量),行業,地區到2027年