


 |
市場調查報告書
商品編碼
1298197
安全激光掃描儀市場:按類型、最終用途:2021-2031 年全球機會分析和行業預測Safety Laser Scanner Market By Type, By End Use : Global Opportunity Analysis and Industry Forecast, 2021-2031 |
||||||
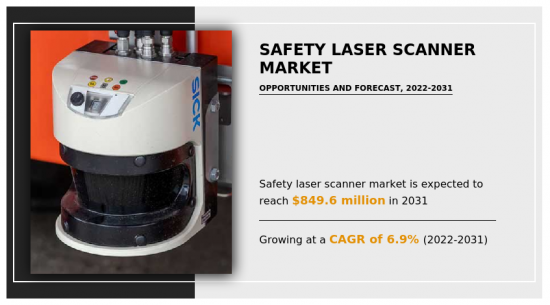
2021 年全球安全激光掃描儀市場價值為 4.367 億美元,2031 年將達到 8.496 億美元,預計 2022 年至 2031 年復合年增長率為 6.9%。
安全激光掃描儀是檢測物體並提供安全措施以防止事故發生的光電設備。 它發射激光束並旋轉,在監控區域周圍形成一個保護區域。 當物體或人進入受保護區域時,掃描儀會檢測到障礙物並向控制系統發出信號以停止或減慢該區域內的機器或設備。
全球安全激光掃描儀市場主要由機器安全系統的技術進步和對工人安全的日益關注推動。 此外,工業自動化的擴展預計將推動市場增長。 然而,安全激光掃描儀的高成本仍然是全球行業的主要製約因素。 相比之下,新興國家對工業安全解決方案日益增長的需求預計將為預測期內的安全激光掃描儀行業提供誘人的前景。
安全激光掃描儀市場按類型、最終用途和地區進行細分。 按類型劃分,安全激光掃描儀市場分為移動式和固定式。 按最終用途劃分,市場分為汽車、食品和飲料、醫療保健和製藥、消費電子產品等。 按地區劃分:北美(美國、加拿大、墨西哥)、歐洲(英國、德國、法國、意大利、其他歐洲地區)、亞太地區(中國、印度、日本、韓國、其他亞太地區)、拉丁美洲/中東東部/在非洲進行分析。 市場上主要運營公司:歐姆龍公司、松下公司、SICK AG、基恩士公司、Hans Turck GmbH & Co. KG、Hokuyo Automation Co. Ltd、Arcus、Banner Engineering、Leuze electronics GmbH Co. KG、IDEC Corporation、Pepper+ Fuchs SE 和羅克韋爾自動化公司
目錄
第一章簡介
第 2 章執行摘要
第三章市場概述
- 市場定義和範圍
- 主要發現
- 影響因素
- 主要投資領域
- 波特五力分析
- 供應商的議價能力
- 買家的議價能力
- 替代品的威脅
- 新進入者的威脅
- 競爭強度
- 市場動態
- 協調員
- 工業自動化的發展
- 更加重視工作場所
- 機器安全系統的技術進步
- 阻礙因素
- 安全激光掃描儀成本高昂
- 機會
- 新興國家對工業安全解決方案的需求激增
- 協調員
- COVID-19:市場影響分析
第 4 章安全激光掃描儀市場(按類型)
- 概述
- 市場規模和預測
- 移動安全激光掃描儀
- 主要市場趨勢、增長動力和機遇
- 市場規模和預測:按地區劃分
- 市場份額分析:按國家/地區劃分
- 固定式安全激光掃描儀
- 主要市場趨勢、增長因素和機遇
- 市場規模和預測:按地區劃分
- 市場份額分析:按國家/地區劃分
第 5 章安全激光掃描儀市場:按最終用途劃分
- 概述
- 市場規模和預測
- 汽車
- 主要市場趨勢、增長動力和機遇
- 市場規模和預測:按地區劃分
- 市場份額分析:按國家/地區劃分
- 食品和飲料
- 主要市場趨勢、增長因素和機遇
- 市場規模和預測:按地區劃分
- 市場份額分析:按國家/地區劃分
- 醫療保健/藥品
- 主要市場趨勢、增長動力和機遇
- 市場規模和預測:按地區劃分
- 市場份額分析:按國家/地區劃分
- 消費電子產品
- 主要市場趨勢、增長動力和機遇
- 市場規模和預測:按地區劃分
- 市場份額分析:按國家/地區劃分
- 其他
- 主要市場趨勢、增長動力和機遇
- 市場規模和預測:按地區劃分
- 市場份額分析:按國家/地區劃分
第 6 章安全激光掃描儀市場:按地區
- 概述
- 市場規模和預測:按地區劃分
- 北美
- 主要趨勢和機遇
- 市場規模/預測:按類型
- 市場規模和預測:按最終用途分類
- 市場規模/預測:按國家/地區劃分
- 美國
- 主要市場趨勢、增長動力和機遇
- 市場規模/預測:按類型
- 市場規模和預測:按最終用途分類
- 加拿大
- 主要市場趨勢、增長動力和機遇
- 市場規模/預測:按類型
- 市場規模和預測:按最終用途分類
- 墨西哥
- 主要市場趨勢、增長動力和機遇
- 市場規模/預測:按類型
- 市場規模和預測:按最終用途分類
- 歐洲
- 主要趨勢和機遇
- 市場規模/預測:按類型
- 市場規模和預測:按最終用途分類
- 市場規模/預測:按國家/地區劃分
- 英國
- 主要市場趨勢、增長動力和機遇
- 市場規模/預測:按類型
- 市場規模和預測:按最終用途分類
- 德國
- 主要市場趨勢、增長動力和機遇
- 市場規模/預測:按類型
- 市場規模和預測:按最終用途分類
- 法國
- 主要市場趨勢、增長動力和機遇
- 市場規模/預測:按類型
- 市場規模和預測:按最終用途分類
- 意大利
- 主要市場趨勢、增長動力和機遇
- 市場規模/預測:按類型
- 市場規模和預測:按最終用途分類
- 歐洲其他地區
- 主要市場趨勢、增長動力和機遇
- 市場規模/預測:按類型
- 市場規模和預測:按最終用途分類
- 亞太地區
- 主要趨勢和機遇
- 市場規模/預測:按類型
- 市場規模和預測:按最終用途分類
- 市場規模/預測:按國家/地區劃分
- 中國
- 主要市場趨勢、增長動力和機遇
- 市場規模/預測:按類型
- 市場規模和預測:按最終用途分類
- 日本
- 主要市場趨勢、增長動力和機遇
- 市場規模/預測:按類型
- 市場規模和預測:按最終用途分類
- 印度
- 主要市場趨勢、增長動力和機遇
- 市場規模/預測:按類型
- 市場規模和預測:按最終用途分類
- 韓國
- 主要市場趨勢、增長動力和機遇
- 市場規模/預測:按類型
- 市場規模和預測:按最終用途分類
- 亞太地區其他地區
- 主要市場趨勢、增長動力和機遇
- 市場規模/預測:按類型
- 市場規模和預測:按最終用途分類
- 拉丁美洲/中東/非洲
- 主要趨勢和機遇
- 市場規模/預測:按類型
- 市場規模和預測:按最終用途分類
- 市場規模/預測:按國家/地區劃分
- 拉丁美洲
- 主要市場趨勢、增長動力和機遇
- 市場規模/預測:按類型
- 市場規模和預測:按最終用途分類
- 中東
- 主要市場趨勢、增長動力和機遇
- 市場規模/預測:按類型
- 市場規模和預測:按最終用途分類
- 非洲
- 主要市場趨勢、增長動力和機遇
- 市場規模/預測:按類型
- 市場規模和預測:按最終用途分類
第7章競爭格局
- 簡介
- 關鍵成功策略
- 10家主要公司的產品圖譜
- 競賽儀表板
- 比賽熱圖
- 頂級公司定位(2021 年)
第8章公司簡介
- Leuze electronic GmbH Co. KG
- OMRON Corporation
- Panasonic Corporation
- Rockwell Automation Inc.
- SICK AG
- Banner Engineering
- Hans Turck GmbH & Co. KG
- HOKUYO AUTOMATIC CO.LTD
- IDEC Corporation
- KEYENCE CORPORATION
- Arcus
- PepperlFuchs SE
The global safety laser scanner market was valued at $436.7 million in 2021, and is projected to reach $849.6 million by 2031, growing at a CAGR of 6.9% from 2022 to 2031. A safety laser scanner is an optoelectronic device that detects things and provides safety measures to prevent accidents. It emits a laser beam that rotates and creates a protective field around the area that is under surveillance. If an object or person enters the protected field, the scanner detects the disruption and sends a signal to the control system, which causes the machinery or equipment in the area to halt or slow down.
The global safety laser scanner market is being pushed primarily by technical advancements in machine safety systems, coupled with an increased emphasis on worker safety. Moreover, the expansion of industrial automation is projected to fuel market growth. However, the high cost of safety laser scanners is a prime limitation of the global industry. In contrast, the rise in the need for industrial safety solutions in emerging nations is expected to present attractive prospects for the safety laser scanner industry throughout the projected period.
The safety laser scanner market is segmented based on type, end-use, and region. By type, the safety laser scanner market is divided into mobile safety laser scanners. By end use, the market is classified into automotive, food & beverage, healthcare & pharmaceuticals, consumer electronics, and others. Region-wise, the AC-DC Power Adapter Supply market trends are analyzed across North America (the U.S., Canada, and Mexico), Europe (UK, Germany, France, Italy, and the Rest of Europe), Asia-Pacific (China, India, Japan, South Korea, and Rest of Asia-Pacific), and LAMEA (Latin America, Middle East, and Africa). The key players operating in the market include OMRON Corporation, Panasonic Corporation, SICK AG, Keyence Corporation, Hans Turck GmbH & Co. KG, Hokuyo Automatic Co. Ltd, Arcus, Banner Engineering, Leuze electronic GmbH Co. KG, IDEC Corporation, Pepper+Fuchs SE, and Rockwell Automation Inc.
Key Benefits For Stakeholders
- This report provides a quantitative analysis of the market segments, current trends, estimations, and dynamics of the safety laser scanner market analysis from 2021 to 2031 to identify the prevailing safety laser scanner market opportunities.
- Market research is offered along with information related to key drivers, restraints, and opportunities.
- Porter's five forces analysis highlights the potency of buyers and suppliers to enable stakeholders to make profit-oriented business decisions and strengthen their supplier-buyer network.
- An in-depth analysis of the safety laser scanner market segmentation assists to determine the prevailing market opportunities.
- Major countries in each region are mapped according to their revenue contribution to the global market.
- Market player positioning facilitates benchmarking and provides a clear understanding of the present position of the market players.
- The report includes an analysis of the regional as well as global safety laser scanner market trends, key players, market segments, application areas, and market growth strategies.
Key Market Segments
By Type
- Mobile Safety Laser Scanner
- Stationary Safety Laser Scanner
By End Use
- Automotive
- Food and Beverages
- Healthcare and Pharmaceuticals
- Consumer Electronics
- Others
By Region
- North America
- U.S.
- Canada
- Mexico
- Europe
- UK
- Germany
- France
- Italy
- Rest of Europe
- Asia-Pacific
- China
- Japan
- India
- South Korea
- Rest of Asia-Pacific
- LAMEA
- Latin America
- Middle East
- Africa
Key Market Players:
- Arcus
- SICK AG
- KEYENCE CORPORATION
- OMRON Corporation
- Hans Turck GmbH & Co. KG
- HOKUYO AUTOMATIC CO.LTD
- Rockwell Automation Inc.
- IDEC Corporation
- Panasonic Corporation
- Banner Engineering
- Leuze electronic GmbH Co. KG
- PepperlFuchs SE
TABLE OF CONTENTS
CHAPTER 1: INTRODUCTION
- 1.1. Report description
- 1.2. Key market segments
- 1.3. Key benefits to the stakeholders
- 1.4. Research Methodology
- 1.4.1. Primary research
- 1.4.2. Secondary research
- 1.4.3. Analyst tools and models
CHAPTER 2: EXECUTIVE SUMMARY
- 2.1. CXO Perspective
CHAPTER 3: MARKET OVERVIEW
- 3.1. Market definition and scope
- 3.2. Key findings
- 3.2.1. Top impacting factors
- 3.2.2. Top investment pockets
- 3.3. Porter's five forces analysis
- 3.3.1. Bargaining power of suppliers
- 3.3.2. Bargaining power of buyers
- 3.3.3. Threat of substitutes
- 3.3.4. Threat of new entrants
- 3.3.5. Intensity of rivalry
- 3.4. Market dynamics
- 3.4.1. Drivers
- 3.4.1.1. Growth in industrial automation
- 3.4.1.2. Rise in emphasis on workplaces
- 3.4.1.3. Technological advancement in machine safety systems
- 3.4.1. Drivers
- 3.4.2. Restraints
- 3.4.2.1. High cost associated with the safety laser scanners
- 3.4.3. Opportunities
- 3.4.3.1. The surge in demand for industrial safety solutions in emerging economies
- 3.5. COVID-19 Impact Analysis on the market
CHAPTER 4: SAFETY LASER SCANNER MARKET, BY TYPE
- 4.1. Overview
- 4.1.1. Market size and forecast
- 4.2. Mobile Safety Laser Scanner
- 4.2.1. Key market trends, growth factors and opportunities
- 4.2.2. Market size and forecast, by region
- 4.2.3. Market share analysis by country
- 4.3. Stationary Safety Laser Scanner
- 4.3.1. Key market trends, growth factors and opportunities
- 4.3.2. Market size and forecast, by region
- 4.3.3. Market share analysis by country
CHAPTER 5: SAFETY LASER SCANNER MARKET, BY END USE
- 5.1. Overview
- 5.1.1. Market size and forecast
- 5.2. Automotive
- 5.2.1. Key market trends, growth factors and opportunities
- 5.2.2. Market size and forecast, by region
- 5.2.3. Market share analysis by country
- 5.3. Food and Beverages
- 5.3.1. Key market trends, growth factors and opportunities
- 5.3.2. Market size and forecast, by region
- 5.3.3. Market share analysis by country
- 5.4. Healthcare and Pharmaceuticals
- 5.4.1. Key market trends, growth factors and opportunities
- 5.4.2. Market size and forecast, by region
- 5.4.3. Market share analysis by country
- 5.5. Consumer Electronics
- 5.5.1. Key market trends, growth factors and opportunities
- 5.5.2. Market size and forecast, by region
- 5.5.3. Market share analysis by country
- 5.6. Others
- 5.6.1. Key market trends, growth factors and opportunities
- 5.6.2. Market size and forecast, by region
- 5.6.3. Market share analysis by country
CHAPTER 6: SAFETY LASER SCANNER MARKET, BY REGION
- 6.1. Overview
- 6.1.1. Market size and forecast By Region
- 6.2. North America
- 6.2.1. Key trends and opportunities
- 6.2.2. Market size and forecast, by Type
- 6.2.3. Market size and forecast, by End Use
- 6.2.4. Market size and forecast, by country
- 6.2.4.1. U.S.
- 6.2.4.1.1. Key market trends, growth factors and opportunities
- 6.2.4.1.2. Market size and forecast, by Type
- 6.2.4.1.3. Market size and forecast, by End Use
- 6.2.4.2. Canada
- 6.2.4.2.1. Key market trends, growth factors and opportunities
- 6.2.4.2.2. Market size and forecast, by Type
- 6.2.4.2.3. Market size and forecast, by End Use
- 6.2.4.3. Mexico
- 6.2.4.3.1. Key market trends, growth factors and opportunities
- 6.2.4.3.2. Market size and forecast, by Type
- 6.2.4.3.3. Market size and forecast, by End Use
- 6.3. Europe
- 6.3.1. Key trends and opportunities
- 6.3.2. Market size and forecast, by Type
- 6.3.3. Market size and forecast, by End Use
- 6.3.4. Market size and forecast, by country
- 6.3.4.1. UK
- 6.3.4.1.1. Key market trends, growth factors and opportunities
- 6.3.4.1.2. Market size and forecast, by Type
- 6.3.4.1.3. Market size and forecast, by End Use
- 6.3.4.2. Germany
- 6.3.4.2.1. Key market trends, growth factors and opportunities
- 6.3.4.2.2. Market size and forecast, by Type
- 6.3.4.2.3. Market size and forecast, by End Use
- 6.3.4.3. France
- 6.3.4.3.1. Key market trends, growth factors and opportunities
- 6.3.4.3.2. Market size and forecast, by Type
- 6.3.4.3.3. Market size and forecast, by End Use
- 6.3.4.4. Italy
- 6.3.4.4.1. Key market trends, growth factors and opportunities
- 6.3.4.4.2. Market size and forecast, by Type
- 6.3.4.4.3. Market size and forecast, by End Use
- 6.3.4.5. Rest of Europe
- 6.3.4.5.1. Key market trends, growth factors and opportunities
- 6.3.4.5.2. Market size and forecast, by Type
- 6.3.4.5.3. Market size and forecast, by End Use
- 6.4. Asia-Pacific
- 6.4.1. Key trends and opportunities
- 6.4.2. Market size and forecast, by Type
- 6.4.3. Market size and forecast, by End Use
- 6.4.4. Market size and forecast, by country
- 6.4.4.1. China
- 6.4.4.1.1. Key market trends, growth factors and opportunities
- 6.4.4.1.2. Market size and forecast, by Type
- 6.4.4.1.3. Market size and forecast, by End Use
- 6.4.4.2. Japan
- 6.4.4.2.1. Key market trends, growth factors and opportunities
- 6.4.4.2.2. Market size and forecast, by Type
- 6.4.4.2.3. Market size and forecast, by End Use
- 6.4.4.3. India
- 6.4.4.3.1. Key market trends, growth factors and opportunities
- 6.4.4.3.2. Market size and forecast, by Type
- 6.4.4.3.3. Market size and forecast, by End Use
- 6.4.4.4. South Korea
- 6.4.4.4.1. Key market trends, growth factors and opportunities
- 6.4.4.4.2. Market size and forecast, by Type
- 6.4.4.4.3. Market size and forecast, by End Use
- 6.4.4.5. Rest of Asia-Pacific
- 6.4.4.5.1. Key market trends, growth factors and opportunities
- 6.4.4.5.2. Market size and forecast, by Type
- 6.4.4.5.3. Market size and forecast, by End Use
- 6.5. LAMEA
- 6.5.1. Key trends and opportunities
- 6.5.2. Market size and forecast, by Type
- 6.5.3. Market size and forecast, by End Use
- 6.5.4. Market size and forecast, by country
- 6.5.4.1. Latin America
- 6.5.4.1.1. Key market trends, growth factors and opportunities
- 6.5.4.1.2. Market size and forecast, by Type
- 6.5.4.1.3. Market size and forecast, by End Use
- 6.5.4.2. Middle East
- 6.5.4.2.1. Key market trends, growth factors and opportunities
- 6.5.4.2.2. Market size and forecast, by Type
- 6.5.4.2.3. Market size and forecast, by End Use
- 6.5.4.3. Africa
- 6.5.4.3.1. Key market trends, growth factors and opportunities
- 6.5.4.3.2. Market size and forecast, by Type
- 6.5.4.3.3. Market size and forecast, by End Use
CHAPTER 7: COMPETITIVE LANDSCAPE
- 7.1. Introduction
- 7.2. Top winning strategies
- 7.3. Product Mapping of Top 10 Player
- 7.4. Competitive Dashboard
- 7.5. Competitive Heatmap
- 7.6. Top player positioning, 2021
CHAPTER 8: COMPANY PROFILES
- 8.1. Leuze electronic GmbH Co. KG
- 8.1.1. Company overview
- 8.1.2. Key Executives
- 8.1.3. Company snapshot
- 8.1.4. Operating business segments
- 8.1.5. Product portfolio
- 8.1.6. Key strategic moves and developments
- 8.2. OMRON Corporation
- 8.2.1. Company overview
- 8.2.2. Key Executives
- 8.2.3. Company snapshot
- 8.2.4. Operating business segments
- 8.2.5. Product portfolio
- 8.2.6. Business performance
- 8.2.7. Key strategic moves and developments
- 8.3. Panasonic Corporation
- 8.3.1. Company overview
- 8.3.2. Key Executives
- 8.3.3. Company snapshot
- 8.3.4. Operating business segments
- 8.3.5. Product portfolio
- 8.3.6. Business performance
- 8.4. Rockwell Automation Inc.
- 8.4.1. Company overview
- 8.4.2. Key Executives
- 8.4.3. Company snapshot
- 8.4.4. Operating business segments
- 8.4.5. Product portfolio
- 8.4.6. Business performance
- 8.4.7. Key strategic moves and developments
- 8.5. SICK AG
- 8.5.1. Company overview
- 8.5.2. Key Executives
- 8.5.3. Company snapshot
- 8.5.4. Operating business segments
- 8.5.5. Product portfolio
- 8.5.6. Business performance
- 8.5.7. Key strategic moves and developments
- 8.6. Banner Engineering
- 8.6.1. Company overview
- 8.6.2. Key Executives
- 8.6.3. Company snapshot
- 8.6.4. Operating business segments
- 8.6.5. Product portfolio
- 8.6.6. Key strategic moves and developments
- 8.7. Hans Turck GmbH & Co. KG
- 8.7.1. Company overview
- 8.7.2. Key Executives
- 8.7.3. Company snapshot
- 8.7.4. Operating business segments
- 8.7.5. Product portfolio
- 8.7.6. Key strategic moves and developments
- 8.8. HOKUYO AUTOMATIC CO.LTD
- 8.8.1. Company overview
- 8.8.2. Key Executives
- 8.8.3. Company snapshot
- 8.8.4. Operating business segments
- 8.8.5. Product portfolio
- 8.8.6. Key strategic moves and developments
- 8.9. IDEC Corporation
- 8.9.1. Company overview
- 8.9.2. Key Executives
- 8.9.3. Company snapshot
- 8.9.4. Operating business segments
- 8.9.5. Product portfolio
- 8.9.6. Business performance
- 8.9.7. Key strategic moves and developments
- 8.10. KEYENCE CORPORATION
- 8.10.1. Company overview
- 8.10.2. Key Executives
- 8.10.3. Company snapshot
- 8.10.4. Operating business segments
- 8.10.5. Product portfolio
- 8.10.6. Business performance
- 8.10.7. Key strategic moves and developments
- 8.11. Arcus
- 8.11.1. Company overview
- 8.11.2. Key Executives
- 8.11.3. Company snapshot
- 8.11.4. Operating business segments
- 8.11.5. Product portfolio
- 8.12. PepperlFuchs SE
- 8.12.1. Company overview
- 8.12.2. Key Executives
- 8.12.3. Company snapshot
- 8.12.4. Operating business segments
- 8.12.5. Product portfolio
- 8.12.6. Key strategic moves and developments
LIST OF TABLES
- TABLE 01. GLOBAL SAFETY LASER SCANNER MARKET, BY TYPE, 2021-2031 ($MILLION)
- TABLE 02. SAFETY LASER SCANNER MARKET FOR MOBILE SAFETY LASER SCANNER, BY REGION, 2021-2031 ($MILLION)
- TABLE 03. SAFETY LASER SCANNER MARKET FOR STATIONARY SAFETY LASER SCANNER , BY REGION, 2021-2031 ($MILLION)
- TABLE 04. GLOBAL SAFETY LASER SCANNER MARKET, BY END USE, 2021-2031 ($MILLION)
- TABLE 05. SAFETY LASER SCANNER MARKET FOR AUTOMOTIVE, BY REGION, 2021-2031 ($MILLION)
- TABLE 06. SAFETY LASER SCANNER MARKET FOR FOOD AND BEVERAGES, BY REGION, 2021-2031 ($MILLION)
- TABLE 07. SAFETY LASER SCANNER MARKET FOR HEALTHCARE AND PHARMACEUTICALS, BY REGION, 2021-2031 ($MILLION)
- TABLE 08. SAFETY LASER SCANNER MARKET FOR CONSUMER ELECTRONICS , BY REGION, 2021-2031 ($MILLION)
- TABLE 09. SAFETY LASER SCANNER MARKET FOR OTHERS, BY REGION, 2021-2031 ($MILLION)
- TABLE 10. SAFETY LASER SCANNER MARKET, BY REGION, 2021-2031 ($MILLION)
- TABLE 11. NORTH AMERICA SAFETY LASER SCANNER MARKET, BY TYPE, 2021-2031 ($MILLION)
- TABLE 12. NORTH AMERICA SAFETY LASER SCANNER MARKET, BY END USE, 2021-2031 ($MILLION)
- TABLE 13. NORTH AMERICA SAFETY LASER SCANNER MARKET, BY COUNTRY, 2021-2031 ($MILLION)
- TABLE 14. U.S. SAFETY LASER SCANNER MARKET, BY TYPE, 2021-2031 ($MILLION)
- TABLE 15. U.S. SAFETY LASER SCANNER MARKET, BY END USE, 2021-2031 ($MILLION)
- TABLE 16. CANADA SAFETY LASER SCANNER MARKET, BY TYPE, 2021-2031 ($MILLION)
- TABLE 17. CANADA SAFETY LASER SCANNER MARKET, BY END USE, 2021-2031 ($MILLION)
- TABLE 18. MEXICO SAFETY LASER SCANNER MARKET, BY TYPE, 2021-2031 ($MILLION)
- TABLE 19. MEXICO SAFETY LASER SCANNER MARKET, BY END USE, 2021-2031 ($MILLION)
- TABLE 20. EUROPE SAFETY LASER SCANNER MARKET, BY TYPE, 2021-2031 ($MILLION)
- TABLE 21. EUROPE SAFETY LASER SCANNER MARKET, BY END USE, 2021-2031 ($MILLION)
- TABLE 22. EUROPE SAFETY LASER SCANNER MARKET, BY COUNTRY, 2021-2031 ($MILLION)
- TABLE 23. UK SAFETY LASER SCANNER MARKET, BY TYPE, 2021-2031 ($MILLION)
- TABLE 24. UK SAFETY LASER SCANNER MARKET, BY END USE, 2021-2031 ($MILLION)
- TABLE 25. GERMANY SAFETY LASER SCANNER MARKET, BY TYPE, 2021-2031 ($MILLION)
- TABLE 26. GERMANY SAFETY LASER SCANNER MARKET, BY END USE, 2021-2031 ($MILLION)
- TABLE 27. FRANCE SAFETY LASER SCANNER MARKET, BY TYPE, 2021-2031 ($MILLION)
- TABLE 28. FRANCE SAFETY LASER SCANNER MARKET, BY END USE, 2021-2031 ($MILLION)
- TABLE 29. ITALY SAFETY LASER SCANNER MARKET, BY TYPE, 2021-2031 ($MILLION)
- TABLE 30. ITALY SAFETY LASER SCANNER MARKET, BY END USE, 2021-2031 ($MILLION)
- TABLE 31. REST OF EUROPE SAFETY LASER SCANNER MARKET, BY TYPE, 2021-2031 ($MILLION)
- TABLE 32. REST OF EUROPE SAFETY LASER SCANNER MARKET, BY END USE, 2021-2031 ($MILLION)
- TABLE 33. ASIA-PACIFIC SAFETY LASER SCANNER MARKET, BY TYPE, 2021-2031 ($MILLION)
- TABLE 34. ASIA-PACIFIC SAFETY LASER SCANNER MARKET, BY END USE, 2021-2031 ($MILLION)
- TABLE 35. ASIA-PACIFIC SAFETY LASER SCANNER MARKET, BY COUNTRY, 2021-2031 ($MILLION)
- TABLE 36. CHINA SAFETY LASER SCANNER MARKET, BY TYPE, 2021-2031 ($MILLION)
- TABLE 37. CHINA SAFETY LASER SCANNER MARKET, BY END USE, 2021-2031 ($MILLION)
- TABLE 38. JAPAN SAFETY LASER SCANNER MARKET, BY TYPE, 2021-2031 ($MILLION)
- TABLE 39. JAPAN SAFETY LASER SCANNER MARKET, BY END USE, 2021-2031 ($MILLION)
- TABLE 40. INDIA SAFETY LASER SCANNER MARKET, BY TYPE, 2021-2031 ($MILLION)
- TABLE 41. INDIA SAFETY LASER SCANNER MARKET, BY END USE, 2021-2031 ($MILLION)
- TABLE 42. SOUTH KOREA SAFETY LASER SCANNER MARKET, BY TYPE, 2021-2031 ($MILLION)
- TABLE 43. SOUTH KOREA SAFETY LASER SCANNER MARKET, BY END USE, 2021-2031 ($MILLION)
- TABLE 44. REST OF ASIA-PACIFIC SAFETY LASER SCANNER MARKET, BY TYPE, 2021-2031 ($MILLION)
- TABLE 45. REST OF ASIA-PACIFIC SAFETY LASER SCANNER MARKET, BY END USE, 2021-2031 ($MILLION)
- TABLE 46. LAMEA SAFETY LASER SCANNER MARKET, BY TYPE, 2021-2031 ($MILLION)
- TABLE 47. LAMEA SAFETY LASER SCANNER MARKET, BY END USE, 2021-2031 ($MILLION)
- TABLE 48. LAMEA SAFETY LASER SCANNER MARKET, BY COUNTRY, 2021-2031 ($MILLION)
- TABLE 49. LATIN AMERICA SAFETY LASER SCANNER MARKET, BY TYPE, 2021-2031 ($MILLION)
- TABLE 50. LATIN AMERICA SAFETY LASER SCANNER MARKET, BY END USE, 2021-2031 ($MILLION)
- TABLE 51. MIDDLE EAST SAFETY LASER SCANNER MARKET, BY TYPE, 2021-2031 ($MILLION)
- TABLE 52. MIDDLE EAST SAFETY LASER SCANNER MARKET, BY END USE, 2021-2031 ($MILLION)
- TABLE 53. AFRICA SAFETY LASER SCANNER MARKET, BY TYPE, 2021-2031 ($MILLION)
- TABLE 54. AFRICA SAFETY LASER SCANNER MARKET, BY END USE, 2021-2031 ($MILLION)
- TABLE 55. LEUZE ELECTRONIC GMBH CO. KG: KEY EXECUTIVES
- TABLE 56. LEUZE ELECTRONIC GMBH CO. KG: COMPANY SNAPSHOT
- TABLE 57. LEUZE ELECTRONIC GMBH CO. KG: SERVICE SEGMENTS
- TABLE 58. LEUZE ELECTRONIC GMBH CO. KG: PRODUCT PORTFOLIO
- TABLE 59. LEUZE ELECTRONIC GMBH CO. KG: KEY STRATERGIES
- TABLE 60. OMRON CORPORATION: KEY EXECUTIVES
- TABLE 61. OMRON CORPORATION: COMPANY SNAPSHOT
- TABLE 62. OMRON CORPORATION: SERVICE SEGMENTS
- TABLE 63. OMRON CORPORATION: PRODUCT PORTFOLIO
- TABLE 64. OMRON CORPORATION: KEY STRATERGIES
- TABLE 65. PANASONIC CORPORATION: KEY EXECUTIVES
- TABLE 66. PANASONIC CORPORATION: COMPANY SNAPSHOT
- TABLE 67. PANASONIC CORPORATION: SERVICE SEGMENTS
- TABLE 68. PANASONIC CORPORATION: PRODUCT PORTFOLIO
- TABLE 69. ROCKWELL AUTOMATION INC.: KEY EXECUTIVES
- TABLE 70. ROCKWELL AUTOMATION INC.: COMPANY SNAPSHOT
- TABLE 71. ROCKWELL AUTOMATION INC.: SERVICE SEGMENTS
- TABLE 72. ROCKWELL AUTOMATION INC.: PRODUCT PORTFOLIO
- TABLE 73. ROCKWELL AUTOMATION INC.: KEY STRATERGIES
- TABLE 74. SICK AG: KEY EXECUTIVES
- TABLE 75. SICK AG: COMPANY SNAPSHOT
- TABLE 76. SICK AG: SERVICE SEGMENTS
- TABLE 77. SICK AG: PRODUCT PORTFOLIO
- TABLE 78. SICK AG: KEY STRATERGIES
- TABLE 79. BANNER ENGINEERING: KEY EXECUTIVES
- TABLE 80. BANNER ENGINEERING: COMPANY SNAPSHOT
- TABLE 81. BANNER ENGINEERING: SERVICE SEGMENTS
- TABLE 82. BANNER ENGINEERING: PRODUCT PORTFOLIO
- TABLE 83. BANNER ENGINEERING: KEY STRATERGIES
- TABLE 84. HANS TURCK GMBH & CO. KG: KEY EXECUTIVES
- TABLE 85. HANS TURCK GMBH & CO. KG: COMPANY SNAPSHOT
- TABLE 86. HANS TURCK GMBH & CO. KG: SERVICE SEGMENTS
- TABLE 87. HANS TURCK GMBH & CO. KG: PRODUCT PORTFOLIO
- TABLE 88. HANS TURCK GMBH & CO. KG: KEY STRATERGIES
- TABLE 89. HOKUYO AUTOMATIC CO.LTD: KEY EXECUTIVES
- TABLE 90. HOKUYO AUTOMATIC CO.LTD: COMPANY SNAPSHOT
- TABLE 91. HOKUYO AUTOMATIC CO.LTD: SERVICE SEGMENTS
- TABLE 92. HOKUYO AUTOMATIC CO.LTD: PRODUCT PORTFOLIO
- TABLE 93. HOKUYO AUTOMATIC CO.LTD: KEY STRATERGIES
- TABLE 94. IDEC CORPORATION: KEY EXECUTIVES
- TABLE 95. IDEC CORPORATION: COMPANY SNAPSHOT
- TABLE 96. IDEC CORPORATION: SERVICE SEGMENTS
- TABLE 97. IDEC CORPORATION: PRODUCT PORTFOLIO
- TABLE 98. IDEC CORPORATION: KEY STRATERGIES
- TABLE 99. KEYENCE CORPORATION: KEY EXECUTIVES
- TABLE 100. KEYENCE CORPORATION: COMPANY SNAPSHOT
- TABLE 101. KEYENCE CORPORATION: PRODUCT SEGMENTS
- TABLE 102. KEYENCE CORPORATION: PRODUCT PORTFOLIO
- TABLE 103. KEYENCE CORPORATION: KEY STRATERGIES
- TABLE 104. ARCUS: KEY EXECUTIVES
- TABLE 105. ARCUS: COMPANY SNAPSHOT
- TABLE 106. ARCUS: SERVICE SEGMENTS
- TABLE 107. ARCUS: PRODUCT PORTFOLIO
- TABLE 108. PEPPERLFUCHS SE: KEY EXECUTIVES
- TABLE 109. PEPPERLFUCHS SE: COMPANY SNAPSHOT
- TABLE 110. PEPPERLFUCHS SE: PRODUCT SEGMENTS
- TABLE 111. PEPPERLFUCHS SE: PRODUCT PORTFOLIO
- TABLE 112. PEPPERLFUCHS SE: KEY STRATERGIES
LIST OF FIGURES
- FIGURE 01. SAFETY LASER SCANNER MARKET, 2021-2031
- FIGURE 02. SEGMENTATION OF SAFETY LASER SCANNER MARKET, 2021-2031
- FIGURE 03. TOP INVESTMENT POCKETS IN SAFETY LASER SCANNER MARKET (2022-2031)
- FIGURE 04. LOW BARGAINING POWER OF SUPPLIERS
- FIGURE 05. LOW BARGAINING POWER OF BUYERS
- FIGURE 06. LOW THREAT OF SUBSTITUTES
- FIGURE 07. LOW THREAT OF NEW ENTRANTS
- FIGURE 08. LOW INTENSITY OF RIVALRY
- FIGURE 09. DRIVERS, RESTRAINTS AND OPPORTUNITIES: GLOBALSAFETY LASER SCANNER MARKET
- FIGURE 10. SAFETY LASER SCANNER MARKET, BY TYPE, 2021(%)
- FIGURE 11. COMPARATIVE SHARE ANALYSIS OF SAFETY LASER SCANNER MARKET FOR MOBILE SAFETY LASER SCANNER, BY COUNTRY 2021 AND 2031(%)
- FIGURE 12. COMPARATIVE SHARE ANALYSIS OF SAFETY LASER SCANNER MARKET FOR STATIONARY SAFETY LASER SCANNER , BY COUNTRY 2021 AND 2031(%)
- FIGURE 13. SAFETY LASER SCANNER MARKET, BY END USE, 2021(%)
- FIGURE 14. COMPARATIVE SHARE ANALYSIS OF SAFETY LASER SCANNER MARKET FOR AUTOMOTIVE, BY COUNTRY 2021 AND 2031(%)
- FIGURE 15. COMPARATIVE SHARE ANALYSIS OF SAFETY LASER SCANNER MARKET FOR FOOD AND BEVERAGES, BY COUNTRY 2021 AND 2031(%)
- FIGURE 16. COMPARATIVE SHARE ANALYSIS OF SAFETY LASER SCANNER MARKET FOR HEALTHCARE AND PHARMACEUTICALS, BY COUNTRY 2021 AND 2031(%)
- FIGURE 17. COMPARATIVE SHARE ANALYSIS OF SAFETY LASER SCANNER MARKET FOR CONSUMER ELECTRONICS , BY COUNTRY 2021 AND 2031(%)
- FIGURE 18. COMPARATIVE SHARE ANALYSIS OF SAFETY LASER SCANNER MARKET FOR OTHERS, BY COUNTRY 2021 AND 2031(%)
- FIGURE 19. SAFETY LASER SCANNER MARKET BY REGION, 2021
- FIGURE 20. U.S. SAFETY LASER SCANNER MARKET, 2021-2031 ($MILLION)
- FIGURE 21. CANADA SAFETY LASER SCANNER MARKET, 2021-2031 ($MILLION)
- FIGURE 22. MEXICO SAFETY LASER SCANNER MARKET, 2021-2031 ($MILLION)
- FIGURE 23. UK SAFETY LASER SCANNER MARKET, 2021-2031 ($MILLION)
- FIGURE 24. GERMANY SAFETY LASER SCANNER MARKET, 2021-2031 ($MILLION)
- FIGURE 25. FRANCE SAFETY LASER SCANNER MARKET, 2021-2031 ($MILLION)
- FIGURE 26. ITALY SAFETY LASER SCANNER MARKET, 2021-2031 ($MILLION)
- FIGURE 27. REST OF EUROPE SAFETY LASER SCANNER MARKET, 2021-2031 ($MILLION)
- FIGURE 28. CHINA SAFETY LASER SCANNER MARKET, 2021-2031 ($MILLION)
- FIGURE 29. JAPAN SAFETY LASER SCANNER MARKET, 2021-2031 ($MILLION)
- FIGURE 30. INDIA SAFETY LASER SCANNER MARKET, 2021-2031 ($MILLION)
- FIGURE 31. SOUTH KOREA SAFETY LASER SCANNER MARKET, 2021-2031 ($MILLION)
- FIGURE 32. REST OF ASIA-PACIFIC SAFETY LASER SCANNER MARKET, 2021-2031 ($MILLION)
- FIGURE 33. LATIN AMERICA SAFETY LASER SCANNER MARKET, 2021-2031 ($MILLION)
- FIGURE 34. MIDDLE EAST SAFETY LASER SCANNER MARKET, 2021-2031 ($MILLION)
- FIGURE 35. AFRICA SAFETY LASER SCANNER MARKET, 2021-2031 ($MILLION)
- FIGURE 36. TOP WINNING STRATEGIES, BY YEAR
- FIGURE 37. TOP WINNING STRATEGIES, BY DEVELOPMENT
- FIGURE 38. TOP WINNING STRATEGIES, BY COMPANY
- FIGURE 39. PRODUCT MAPPING OF TOP 10 PLAYERS
- FIGURE 40. COMPETITIVE DASHBOARD
- FIGURE 41. COMPETITIVE HEATMAP: SAFETY LASER SCANNER MARKET
- FIGURE 42. TOP PLAYER POSITIONING, 2021
- FIGURE 43. OMRON CORPORATION: NET REVENUE, 2020-2022 ($MILLION)
- FIGURE 44. OMRON CORPORATION: REVENUE SHARE BY SEGMENT, 2022 (%)
- FIGURE 45. OMRON CORPORATION: REVENUE SHARE BY REGION, 2022 (%)
- FIGURE 46. PANASONIC CORPORATION: NET REVENUE, 2019-2021 ($MILLION)
- FIGURE 47. PANASONIC CORPORATION: REVENUE SHARE BY REGION, 2021 (%)
- FIGURE 48. PANASONIC CORPORATION: REVENUE SHARE BY REGION, 2021 (%)
- FIGURE 49. ROCKWELL AUTOMATION INC.: NET SALES, 2020-2022 ($MILLION)
- FIGURE 50. ROCKWELL AUTOMATION INC.: REVENUE SHARE BY SEGMENT, 2022 (%)
- FIGURE 51. ROCKWELL AUTOMATION INC.: REVENUE SHARE BY REGION, 2021 (%)
- FIGURE 52. SICK AG: NET REVENUE, 2019-2021 ($MILLION)
- FIGURE 53. SICK AG: RESEARCH & DEVELOPMENT EXPENDITURE, 2019-2021
- FIGURE 54. SICK AG: REVENUE SHARE BY REGION, 2021 (%)
- FIGURE 55. SICK AG: REVENUE SHARE BY SEGMENT, 2021 (%)
- FIGURE 56. IDEC CORPORATION: NET REVENUE, 2019-2021 ($MILLION)
- FIGURE 57. IDEC CORPORATION: RESEARCH & DEVELOPMENT EXPENDITURE, 2019-2021 ($MILLION)
- FIGURE 58. IDEC CORPORATION: REVENUE SHARE BY SEGMENT, 2021 (%)
- FIGURE 59. IDEC CORPORATION: REVENUE SHARE BY REGION, 2021 (%)
- FIGURE 60. KEYENCE CORPORATION: NET REVENUE, 2020-2022 ($MILLION)
- FIGURE 61. KEYENCE CORPORATION: RESEARCH & DEVELOPMENT EXPENDITURE, 2020-2022 ($MILLION)
- FIGURE 62. KEYENCE CORPORATION: REVENUE SHARE BY REGION, 2022 (%)


