


 |
市場調查報告書
商品編碼
1298190
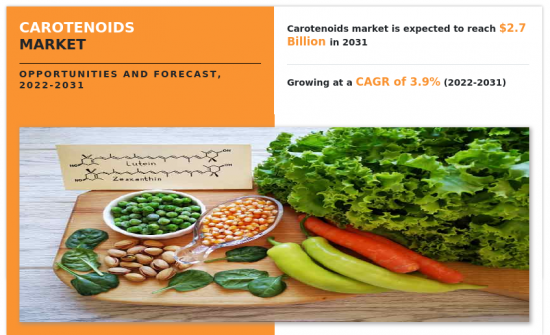
類胡蘿蔔素市場:按產品、起源和應用:2021-2031 年全球機會分析和行業預測Carotenoids Market By Product, By Source, By Application : Global Opportunity Analysis and Industry Forecast, 2021-2031 |
||||||
類胡蘿蔔素,也稱為四□類化合物,是每個分子由 40 個碳原子組成的植物色素。
類胡蘿蔔素還可以從藻類、細菌、真菌、動物脂肪中獲得或合成。 動物一般不能合成類胡蘿蔔素,因此必須消耗植物性食物來滿足日常需要。 在動物營養中,色素是從動物的飲食中獲得的,主要與類胡蘿蔔素的存在有關。 隨著動物營養的優化,類胡蘿蔔素被納入飲食中,支持動物健康和產品質量。 類胡蘿蔔素因其大量存在而成為最早研究的植物化學物質之一,並且具有廣泛的功能,從眼睛的光學增強到免疫調節和抗氧化功能。 類胡蘿蔔素具有多種健康益處,其應用範圍不斷擴大,例如動物飼料、人類食品、膳食補充劑、化妝品、藥品和水產養殖。
亞太市場的增長主要歸因於可支配收入的增加、人口增長的加速、食品消費的增加以及類胡蘿蔔素食品的市場開發。 由於功能性食品和製藥行業越來越多地使用類胡蘿蔔素製成的成分,該市場正在不斷擴大。 由於製造動物飼料成分所需的基本原材料更加便宜,C-類胡蘿蔔素也是市場的主要驅動力。 隨著消費者越來越意識到類胡蘿蔔素產品的好處,亞太市場的擴張預計將更加緩慢。
類胡蘿蔔素導致人類食品和膳食補充劑作為預防保健和膳食補充劑的消費量增加。 類胡蘿蔔素具有多種健康益處,包括預防癌症、抗炎作用、對免疫系統的影響,以及在某些情況下預防心血管疾病。 類胡蘿蔔素是強大的抗氧化劑,在中和自由基方面發揮著重要作用。 因此,類胡蘿蔔素的抗氧化特性正在增加其在化妝品中的應用。 此外,食品加工、飲料和化妝品行業對天然色素的需求不斷增加,預計將為類胡蘿蔔素製造商開闢新的途徑。
然而,對人類食品中類胡蘿蔔素使用的嚴格監管、雜質的威脅以及天然類胡蘿蔔素相對於合成類胡蘿蔔素的更高成本預計將阻礙市場增長。
內容
第一章簡介
第 2 章執行摘要
第三章市場概述
- 市場定義和範圍
- 主要發現
- 影響因素
- 主要投資領域
- 波特五力分析
- 供應商的議價能力
- 買家的議價能力
- 替代品的威脅
- 新進入者的威脅
- 競爭強度
- 市場動態
- 協調員
- 老年人對營養補充劑的需求增加
- 最終用戶應用程序的增長
- 對天然著色劑的需求增加
- 阻礙因素
- 嚴格的法規和審批標準
- 機會
- 增加水產養殖中類胡蘿蔔素的使用
- 協調員
- COVID-19:市場影響分析
第 4 章。類胡蘿蔔素市場:副產品
- 概述
- 市場規模和預測
- 蝦青素
- 主要市場趨勢、增長因素和機遇
- 市場規模和預測:按地區劃分
- 市場份額分析:按國家/地區劃分
- 辣椒紅素
- 主要市場趨勢、增長因素和機遇
- 市場規模和預測:按地區劃分
- 市場份額分析:按國家/地區劃分
- 葉黃素
- 主要市場趨勢、增長因素和機遇
- 市場規模和預測:按地區劃分
- 市場份額分析:按國家/地區劃分
- β-胡蘿蔔素
- 主要市場趨勢、增長因素和機遇
- 市場規模和預測:按地區劃分
- 市場份額分析:按國家/地區劃分
- 番茄紅素
- 主要市場趨勢、增長動力和機遇
- 市場規模和預測:按地區劃分
- 市場份額分析:按國家/地區劃分
- 其他
- 主要市場趨勢、增長因素和機遇
- 市場規模和預測:按地區劃分
- 市場份額分析:按國家/地區劃分
第 5 章類胡蘿蔔素市場:按來源劃分
- 概述
- 市場規模和預測
- 自然
- 主要市場趨勢、增長動力和機遇
- 市場規模和預測:按地區劃分
- 市場份額分析:按國家/地區劃分
- 合成
- 主要市場趨勢、增長因素和機遇
- 市場規模和預測:按地區劃分
- 市場份額分析:按國家/地區劃分
第 6 章類胡蘿蔔素市場:按應用分類
- 概述
- 市場規模和預測
- 動物飼料
- 主要市場趨勢、增長動力和機遇
- 市場規模和預測:按地區劃分
- 市場份額分析:按國家/地區劃分
- 人類食物
- 主要市場趨勢、增長因素和機遇
- 市場規模和預測:按地區劃分
- 市場份額分析:按國家/地區劃分
- 膳食補充劑
- 主要市場趨勢、增長因素和機遇
- 市場規模和預測:按地區劃分
- 市場份額分析:按國家/地區劃分
- 其他
- 主要市場趨勢、增長因素和機遇
- 市場規模和預測:按地區劃分
- 市場份額分析:按國家/地區劃分
第 7 章。類胡蘿蔔素市場:按地區
- 概述
- 市場規模和預測:按地區劃分
- 北美
- 主要趨勢和機遇
- 市場規模/預測:按產品分類
- 市場規模和預測:按來源地劃分
- 市場規模和預測:按應用分類
- 市場規模/預測:按國家/地區劃分
- 美國
- 主要市場趨勢、增長動力和機遇
- 市場規模/預測:按產品分類
- 市場規模/預測:按來源分類
- 市場規模和預測:按應用分類
- 加拿大
- 主要市場趨勢、增長動力和機遇
- 市場規模/預測:按產品分類
- 市場規模和預測:按來源地劃分
- 市場規模和預測:按應用分類
- 墨西哥
- 主要市場趨勢、增長動力和機遇
- 市場規模/預測:按產品分類
- 市場規模和預測:按來源地劃分
- 市場規模和預測:按應用分類
- 歐洲
- 主要趨勢和機遇
- 市場規模/預測:按產品分類
- 市場規模和預測:按來源地劃分
- 市場規模和預測:按應用分類
- 市場規模/預測:按國家/地區劃分
- 英國
- 主要市場趨勢、增長動力和機遇
- 市場規模/預測:按產品分類
- 市場規模和預測:按來源地劃分
- 市場規模和預測:按應用分類
- 德國
- 主要市場趨勢、增長動力和機遇
- 市場規模/預測:按產品分類
- 市場規模和預測:按來源地劃分
- 市場規模和預測:按應用分類
- 法國
- 主要市場趨勢、增長動力和機遇
- 市場規模/預測:按產品分類
- 市場規模和預測:按來源地劃分
- 市場規模和預測:按應用分類
- 意大利
- 主要市場趨勢、增長動力和機遇
- 市場規模/預測:按產品分類
- 市場規模和預測:按來源地劃分
- 市場規模和預測:按應用分類
- 西班牙
- 主要市場趨勢、增長動力和機遇
- 市場規模/預測:按產品分類
- 市場規模和預測:按來源地劃分
- 市場規模和預測:按應用分類
- 歐洲其他地區
- 主要市場趨勢、增長動力和機遇
- 市場規模/預測:按產品分類
- 市場規模和預測:按來源地劃分
- 市場規模和預測:按應用分類
- 亞太地區
- 主要趨勢和機遇
- 市場規模/預測:按產品分類
- 市場規模和預測:按來源地劃分
- 市場規模和預測:按應用分類
- 市場規模/預測:按國家/地區劃分
- 中國
- 主要市場趨勢、增長動力和機遇
- 市場規模/預測:按產品分類
- 市場規模/預測:按來源分類
- 市場規模和預測:按應用分類
- 印度
- 主要市場趨勢、增長動力和機遇
- 市場規模/預測:按產品分類
- 市場規模和預測:按來源地劃分
- 市場規模和預測:按應用分類
- 日本
- 主要市場趨勢、增長動力和機遇
- 市場規模/預測:按產品分類
- 市場規模和預測:按來源地劃分
- 市場規模和預測:按應用分類
- 印度尼西亞
- 主要市場趨勢、增長動力和機遇
- 市場規模/預測:按產品分類
- 市場規模和預測:按來源地劃分
- 市場規模和預測:按應用分類
- 韓國
- 主要市場趨勢、增長動力和機遇
- 市場規模/預測:按產品分類
- 市場規模和預測:按來源地劃分
- 市場規模和預測:按應用分類
- 亞太地區其他地區
- 主要市場趨勢、增長因素和機遇
- 市場規模/預測:按產品分類
- 市場規模和預測:按來源地劃分
- 市場規模和預測:按應用分類
- 拉丁美洲/中東/非洲
- 主要趨勢和機遇
- 市場規模/預測:按產品分類
- 市場規模和預測:按來源地劃分
- 市場規模和預測:按應用分類
- 市場規模/預測:按國家/地區劃分
- 巴西
- 主要市場趨勢、增長動力和機遇
- 市場規模/預測:按產品分類
- 市場規模和預測:按來源地劃分
- 市場規模和預測:按應用分類
- 阿根廷
- 主要市場趨勢、增長動力和機遇
- 市場規模/預測:按產品分類
- 市場規模和預測:按來源地劃分
- 市場規模和預測:按應用分類
- 南非
- 主要市場趨勢、增長動力和機遇
- 市場規模/預測:按產品分類
- 市場規模和預測:按來源地劃分
- 市場規模和預測:按應用分類
- 沙特阿拉伯
- 主要市場趨勢、增長動力和機遇
- 市場規模/預測:按產品分類
- 市場規模和預測:按來源地劃分
- 市場規模和預測:按應用分類
- 其他地區
- 主要市場趨勢、增長動力和機遇
- 市場規模/預測:按產品分類
- 市場規模和預測:按來源地劃分
- 市場規模和預測:按應用分類
第 8 章競爭格局
- 簡介
- 關鍵成功策略
- 10家主要公司的產品圖譜
- 競賽儀表板
- 比賽熱圖
- 頂級公司定位(2021 年)
第 9 章公司簡介
- BASF SE
- Koninklijke DSM N.V.
- Chr. Hansen Holding A/S
- Divis Laboratories Limited
- Cyanotech Corporation
- Kemin Industries, Inc.
- DDW, Inc.
- Dohler Group
- Allied Biotech Corporation
- ExcelVite Sdn. Bhd.
Carotenoids, also called as tetraterpenoids are plant pigments composed of 40 carbon atoms per molecule. They can also be obtained from algae, bacteria, fungi, and animal fat, or can be produced synthetically. Animals are generally incapable of synthesizing carotenoids and need a dietary intake of plant products to meet their daily requirements. In animal nutrition, colors come from the animal diet and are mostly linked with the presence of carotenoids. With the ongoing optimization of animal nutrition, they are included in the feed as a part of the nutrients, which support animal health and product quality. Owing to their large presence, carotenoids are some of the earliest studied phytochemicals, which have a wide range of functions from optical enhancement within the eye to immunomodulatory and antioxidant functions. Various health benefits associated with carotenoids have led to their increased applications, which include animal feed, human food, dietary supplement, and others such as cosmetics, pharmaceuticals, and aquaculture.
The growth of the Asia-Pacific market is majorly attributed to rising disposable income, population growth that is accelerating, rising food consumption, and the development of food products based on carotenoids. The market is growing as a result of an increase in the use of components made from carotenoids in functional food and pharmaceutical industries. C carotenoids are also a more affordable source of the basic materials necessary to create animal feedstock, which is a major market-driving factor. The Asia-Pacific market is expected to expand more slowly as consumers become more aware of the advantages of products made from carotenoids.
Carotenoids, as preventive healthcare and nutraceuticals, have led to their higher consumption of human food and dietary supplement. They offer several health benefits, which include cancer prevention, anti-inflammatory, and immune system benefits, and are sometimes associated with cardiovascular disease prevention. Carotenoids are powerful antioxidant substances, which play an essential role in the neutralization reaction of free radicals. Thus, the antioxidant properties of carotenoids increase their application in cosmetics. Moreover, an increase in demand for natural colors in food processing, beverages, and the cosmetic industry is anticipated to open new avenues for carotenoid manufacturers.
However, stringent regulation on the use of carotenoids in human food, threats of adulteration, and higher cost of naturally sourced carotenoids as compared to synthetic carotenoids are expected to hamper the market growth.
The global carotenoids market is segmented on the basis of product, source, application, and region. By product, the market is divided into astaxanthin, capsanthin, lutein, beta-carotene, lycopene, and others. Based on the source, the market is bifurcated into natural and synthetic. Based on application, the market is classified into animal feed, human food, dietary supplement, and others. By region, it is analyzed across North America, Europe, Asia-Pacific, and LAMEA.
In 2021, Europe accounted for the highest market share and is anticipated to dominate the market during the forecast period. This is majorly attributed to the presence of top producers such as Koninklijke DSM, BASF, Chr. Hansen, and Dohler Group in the European market. Lutein, Lycopene, and Beta-Carotene are in high demand due to the region's aging population as a treatment for cataracts and as a preventative measure against diabetes, cancer, and other heart-related problems. Although synthetic carotenoids account for a high share in the market. The preference of consumers for natural and clean-label products is anticipated to fuel the expansion of the naturally-sourced carotenoids market in the area.
Some of the major players analyzed in this report are: BASF SE, Koninklijke DSM N.V., Chr. Hansen A/S, FMC Corporation, Cyanotech Corporation, Kemin Industries Inc., DDW The Colour House, Dohler Group, Allied Biotech Corporation, and Excelvite.
Key Benefits For Stakeholders
- This report provides a quantitative analysis of the market segments, current trends, estimations, and dynamics of the carotenoids market analysis from 2021 to 2031 to identify the prevailing carotenoids market opportunities.
- The market research is offered along with information related to key drivers, restraints, and opportunities.
- Porter's five forces analysis highlights the potency of buyers and suppliers to enable stakeholders make profit-oriented business decisions and strengthen their supplier-buyer network.
- In-depth analysis of the carotenoids market segmentation assists to determine the prevailing market opportunities.
- Major countries in each region are mapped according to their revenue contribution to the global market.
- Market player positioning facilitates benchmarking and provides a clear understanding of the present position of the market players.
- The report includes the analysis of the regional as well as global carotenoids market trends, key players, market segments, application areas, and market growth strategies.
Key Market Segments
By Product
- Lutein
- Beta-carotene
- Lycopene
- Others
- Astaxanthin
- Capsanthin
By Source
- Natural
- Synthetic
By Application
- Animal Feed
- Human Food
- Dietary Supplement
- Others
By Region
- North America
- U.S.
- Canada
- Mexico
- Europe
- UK
- Germany
- France
- Italy
- Spain
- Rest of Europe
- Asia-Pacific
- China
- India
- Japan
- Indonesia
- South Korea
- Rest of Asia-Pacific
- LAMEA
- Brazil
- Argentina
- South Africa
- Saudi Arabia
- Rest of LAMEA
Key Market Players:
- BASF SE
- Divis Laboratories Limited
- Koninklijke DSM N.V.
- Chr. Hansen Holding A/S
- Kemin Industries, Inc.
- DDW, Inc.
- Dohler Group
- Allied Biotech Corporation
- Cyanotech Corporation
- ExcelVite Sdn. Bhd.
TABLE OF CONTENTS
CHAPTER 1: INTRODUCTION
- 1.1. Report description
- 1.2. Key market segments
- 1.3. Key benefits to the stakeholders
- 1.4. Research Methodology
- 1.4.1. Primary research
- 1.4.2. Secondary research
- 1.4.3. Analyst tools and models
CHAPTER 2: EXECUTIVE SUMMARY
- 2.1. CXO Perspective
CHAPTER 3: MARKET OVERVIEW
- 3.1. Market definition and scope
- 3.2. Key findings
- 3.2.1. Top impacting factors
- 3.2.2. Top investment pockets
- 3.3. Porter's five forces analysis
- 3.3.1. Bargaining power of suppliers
- 3.3.2. Bargaining power of buyers
- 3.3.3. Threat of substitutes
- 3.3.4. Threat of new entrants
- 3.3.5. Intensity of rivalry
- 3.4. Market dynamics
- 3.4.1. Drivers
- 3.4.1.1. Increase in demand for dietary supplements from an older population
- 3.4.1.2. Growth in end-user applications
- 3.4.1.3. Rise in Demand for natural colorants
- 3.4.1. Drivers
- 3.4.2. Restraints
- 3.4.2.1. Stringent regulatory and approval norms
- 3.4.3. Opportunities
- 3.4.3.1. Increase in use of carotenoid in aquaculture
- 3.5. COVID-19 Impact Analysis on the market
CHAPTER 4: CAROTENOIDS MARKET, BY PRODUCT
- 4.1. Overview
- 4.1.1. Market size and forecast
- 4.2. Astaxanthin
- 4.2.1. Key market trends, growth factors and opportunities
- 4.2.2. Market size and forecast, by region
- 4.2.3. Market share analysis by country
- 4.3. Capsanthin
- 4.3.1. Key market trends, growth factors and opportunities
- 4.3.2. Market size and forecast, by region
- 4.3.3. Market share analysis by country
- 4.4. Lutein
- 4.4.1. Key market trends, growth factors and opportunities
- 4.4.2. Market size and forecast, by region
- 4.4.3. Market share analysis by country
- 4.5. Beta-carotene
- 4.5.1. Key market trends, growth factors and opportunities
- 4.5.2. Market size and forecast, by region
- 4.5.3. Market share analysis by country
- 4.6. Lycopene
- 4.6.1. Key market trends, growth factors and opportunities
- 4.6.2. Market size and forecast, by region
- 4.6.3. Market share analysis by country
- 4.7. Others
- 4.7.1. Key market trends, growth factors and opportunities
- 4.7.2. Market size and forecast, by region
- 4.7.3. Market share analysis by country
CHAPTER 5: CAROTENOIDS MARKET, BY SOURCE
- 5.1. Overview
- 5.1.1. Market size and forecast
- 5.2. Natural
- 5.2.1. Key market trends, growth factors and opportunities
- 5.2.2. Market size and forecast, by region
- 5.2.3. Market share analysis by country
- 5.3. Synthetic
- 5.3.1. Key market trends, growth factors and opportunities
- 5.3.2. Market size and forecast, by region
- 5.3.3. Market share analysis by country
CHAPTER 6: CAROTENOIDS MARKET, BY APPLICATION
- 6.1. Overview
- 6.1.1. Market size and forecast
- 6.2. Animal Feed
- 6.2.1. Key market trends, growth factors and opportunities
- 6.2.2. Market size and forecast, by region
- 6.2.3. Market share analysis by country
- 6.3. Human Food
- 6.3.1. Key market trends, growth factors and opportunities
- 6.3.2. Market size and forecast, by region
- 6.3.3. Market share analysis by country
- 6.4. Dietary Supplement
- 6.4.1. Key market trends, growth factors and opportunities
- 6.4.2. Market size and forecast, by region
- 6.4.3. Market share analysis by country
- 6.5. Others
- 6.5.1. Key market trends, growth factors and opportunities
- 6.5.2. Market size and forecast, by region
- 6.5.3. Market share analysis by country
CHAPTER 7: CAROTENOIDS MARKET, BY REGION
- 7.1. Overview
- 7.1.1. Market size and forecast By Region
- 7.2. North America
- 7.2.1. Key trends and opportunities
- 7.2.2. Market size and forecast, by Product
- 7.2.3. Market size and forecast, by Source
- 7.2.4. Market size and forecast, by Application
- 7.2.5. Market size and forecast, by country
- 7.2.5.1. U.S.
- 7.2.5.1.1. Key market trends, growth factors and opportunities
- 7.2.5.1.2. Market size and forecast, by Product
- 7.2.5.1.3. Market size and forecast, by Source
- 7.2.5.1.4. Market size and forecast, by Application
- 7.2.5.2. Canada
- 7.2.5.2.1. Key market trends, growth factors and opportunities
- 7.2.5.2.2. Market size and forecast, by Product
- 7.2.5.2.3. Market size and forecast, by Source
- 7.2.5.2.4. Market size and forecast, by Application
- 7.2.5.3. Mexico
- 7.2.5.3.1. Key market trends, growth factors and opportunities
- 7.2.5.3.2. Market size and forecast, by Product
- 7.2.5.3.3. Market size and forecast, by Source
- 7.2.5.3.4. Market size and forecast, by Application
- 7.3. Europe
- 7.3.1. Key trends and opportunities
- 7.3.2. Market size and forecast, by Product
- 7.3.3. Market size and forecast, by Source
- 7.3.4. Market size and forecast, by Application
- 7.3.5. Market size and forecast, by country
- 7.3.5.1. UK
- 7.3.5.1.1. Key market trends, growth factors and opportunities
- 7.3.5.1.2. Market size and forecast, by Product
- 7.3.5.1.3. Market size and forecast, by Source
- 7.3.5.1.4. Market size and forecast, by Application
- 7.3.5.2. Germany
- 7.3.5.2.1. Key market trends, growth factors and opportunities
- 7.3.5.2.2. Market size and forecast, by Product
- 7.3.5.2.3. Market size and forecast, by Source
- 7.3.5.2.4. Market size and forecast, by Application
- 7.3.5.3. France
- 7.3.5.3.1. Key market trends, growth factors and opportunities
- 7.3.5.3.2. Market size and forecast, by Product
- 7.3.5.3.3. Market size and forecast, by Source
- 7.3.5.3.4. Market size and forecast, by Application
- 7.3.5.4. Italy
- 7.3.5.4.1. Key market trends, growth factors and opportunities
- 7.3.5.4.2. Market size and forecast, by Product
- 7.3.5.4.3. Market size and forecast, by Source
- 7.3.5.4.4. Market size and forecast, by Application
- 7.3.5.5. Spain
- 7.3.5.5.1. Key market trends, growth factors and opportunities
- 7.3.5.5.2. Market size and forecast, by Product
- 7.3.5.5.3. Market size and forecast, by Source
- 7.3.5.5.4. Market size and forecast, by Application
- 7.3.5.6. Rest of Europe
- 7.3.5.6.1. Key market trends, growth factors and opportunities
- 7.3.5.6.2. Market size and forecast, by Product
- 7.3.5.6.3. Market size and forecast, by Source
- 7.3.5.6.4. Market size and forecast, by Application
- 7.4. Asia-Pacific
- 7.4.1. Key trends and opportunities
- 7.4.2. Market size and forecast, by Product
- 7.4.3. Market size and forecast, by Source
- 7.4.4. Market size and forecast, by Application
- 7.4.5. Market size and forecast, by country
- 7.4.5.1. China
- 7.4.5.1.1. Key market trends, growth factors and opportunities
- 7.4.5.1.2. Market size and forecast, by Product
- 7.4.5.1.3. Market size and forecast, by Source
- 7.4.5.1.4. Market size and forecast, by Application
- 7.4.5.2. India
- 7.4.5.2.1. Key market trends, growth factors and opportunities
- 7.4.5.2.2. Market size and forecast, by Product
- 7.4.5.2.3. Market size and forecast, by Source
- 7.4.5.2.4. Market size and forecast, by Application
- 7.4.5.3. Japan
- 7.4.5.3.1. Key market trends, growth factors and opportunities
- 7.4.5.3.2. Market size and forecast, by Product
- 7.4.5.3.3. Market size and forecast, by Source
- 7.4.5.3.4. Market size and forecast, by Application
- 7.4.5.4. Indonesia
- 7.4.5.4.1. Key market trends, growth factors and opportunities
- 7.4.5.4.2. Market size and forecast, by Product
- 7.4.5.4.3. Market size and forecast, by Source
- 7.4.5.4.4. Market size and forecast, by Application
- 7.4.5.5. South Korea
- 7.4.5.5.1. Key market trends, growth factors and opportunities
- 7.4.5.5.2. Market size and forecast, by Product
- 7.4.5.5.3. Market size and forecast, by Source
- 7.4.5.5.4. Market size and forecast, by Application
- 7.4.5.6. Rest of Asia-Pacific
- 7.4.5.6.1. Key market trends, growth factors and opportunities
- 7.4.5.6.2. Market size and forecast, by Product
- 7.4.5.6.3. Market size and forecast, by Source
- 7.4.5.6.4. Market size and forecast, by Application
- 7.5. LAMEA
- 7.5.1. Key trends and opportunities
- 7.5.2. Market size and forecast, by Product
- 7.5.3. Market size and forecast, by Source
- 7.5.4. Market size and forecast, by Application
- 7.5.5. Market size and forecast, by country
- 7.5.5.1. Brazil
- 7.5.5.1.1. Key market trends, growth factors and opportunities
- 7.5.5.1.2. Market size and forecast, by Product
- 7.5.5.1.3. Market size and forecast, by Source
- 7.5.5.1.4. Market size and forecast, by Application
- 7.5.5.2. Argentina
- 7.5.5.2.1. Key market trends, growth factors and opportunities
- 7.5.5.2.2. Market size and forecast, by Product
- 7.5.5.2.3. Market size and forecast, by Source
- 7.5.5.2.4. Market size and forecast, by Application
- 7.5.5.3. South Africa
- 7.5.5.3.1. Key market trends, growth factors and opportunities
- 7.5.5.3.2. Market size and forecast, by Product
- 7.5.5.3.3. Market size and forecast, by Source
- 7.5.5.3.4. Market size and forecast, by Application
- 7.5.5.4. Saudi Arabia
- 7.5.5.4.1. Key market trends, growth factors and opportunities
- 7.5.5.4.2. Market size and forecast, by Product
- 7.5.5.4.3. Market size and forecast, by Source
- 7.5.5.4.4. Market size and forecast, by Application
- 7.5.5.5. Rest of LAMEA
- 7.5.5.5.1. Key market trends, growth factors and opportunities
- 7.5.5.5.2. Market size and forecast, by Product
- 7.5.5.5.3. Market size and forecast, by Source
- 7.5.5.5.4. Market size and forecast, by Application
CHAPTER 8: COMPETITIVE LANDSCAPE
- 8.1. Introduction
- 8.2. Top winning strategies
- 8.3. Product Mapping of Top 10 Player
- 8.4. Competitive Dashboard
- 8.5. Competitive Heatmap
- 8.6. Top player positioning, 2021
CHAPTER 9: COMPANY PROFILES
- 9.1. BASF SE
- 9.1.1. Company overview
- 9.1.2. Key Executives
- 9.1.3. Company snapshot
- 9.1.4. Operating business segments
- 9.1.5. Product portfolio
- 9.1.6. Business performance
- 9.2. Koninklijke DSM N.V.
- 9.2.1. Company overview
- 9.2.2. Key Executives
- 9.2.3. Company snapshot
- 9.2.4. Operating business segments
- 9.2.5. Product portfolio
- 9.3. Chr. Hansen Holding A/S
- 9.3.1. Company overview
- 9.3.2. Key Executives
- 9.3.3. Company snapshot
- 9.3.4. Operating business segments
- 9.3.5. Product portfolio
- 9.3.6. Business performance
- 9.4. Divis Laboratories Limited
- 9.4.1. Company overview
- 9.4.2. Key Executives
- 9.4.3. Company snapshot
- 9.4.4. Operating business segments
- 9.4.5. Product portfolio
- 9.4.6. Business performance
- 9.4.7. Key strategic moves and developments
- 9.5. Cyanotech Corporation
- 9.5.1. Company overview
- 9.5.2. Key Executives
- 9.5.3. Company snapshot
- 9.5.4. Operating business segments
- 9.5.5. Product portfolio
- 9.5.6. Business performance
- 9.5.7. Key strategic moves and developments
- 9.6. Kemin Industries, Inc.
- 9.6.1. Company overview
- 9.6.2. Key Executives
- 9.6.3. Company snapshot
- 9.6.4. Operating business segments
- 9.6.5. Product portfolio
- 9.6.6. Key strategic moves and developments
- 9.7. DDW, Inc.
- 9.7.1. Company overview
- 9.7.2. Key Executives
- 9.7.3. Company snapshot
- 9.7.4. Operating business segments
- 9.7.5. Product portfolio
- 9.8. Dohler Group
- 9.8.1. Company overview
- 9.8.2. Key Executives
- 9.8.3. Company snapshot
- 9.8.4. Operating business segments
- 9.8.5. Product portfolio
- 9.9. Allied Biotech Corporation
- 9.9.1. Company overview
- 9.9.2. Key Executives
- 9.9.3. Company snapshot
- 9.9.4. Operating business segments
- 9.9.5. Product portfolio
- 9.10. ExcelVite Sdn. Bhd.
- 9.10.1. Company overview
- 9.10.2. Key Executives
- 9.10.3. Company snapshot
- 9.10.4. Operating business segments
- 9.10.5. Product portfolio
- 9.10.6. Key strategic moves and developments
LIST OF TABLES
- TABLE 01. GLOBAL CAROTENOIDS MARKET, BY PRODUCT, 2021-2031 ($MILLION)
- TABLE 02. CAROTENOIDS MARKET FOR ASTAXANTHIN, BY REGION, 2021-2031 ($MILLION)
- TABLE 03. CAROTENOIDS MARKET FOR CAPSANTHIN, BY REGION, 2021-2031 ($MILLION)
- TABLE 04. CAROTENOIDS MARKET FOR LUTEIN, BY REGION, 2021-2031 ($MILLION)
- TABLE 05. CAROTENOIDS MARKET FOR BETA-CAROTENE, BY REGION, 2021-2031 ($MILLION)
- TABLE 06. CAROTENOIDS MARKET FOR LYCOPENE, BY REGION, 2021-2031 ($MILLION)
- TABLE 07. CAROTENOIDS MARKET FOR OTHERS, BY REGION, 2021-2031 ($MILLION)
- TABLE 08. GLOBAL CAROTENOIDS MARKET, BY SOURCE, 2021-2031 ($MILLION)
- TABLE 09. CAROTENOIDS MARKET FOR NATURAL, BY REGION, 2021-2031 ($MILLION)
- TABLE 10. CAROTENOIDS MARKET FOR SYNTHETIC, BY REGION, 2021-2031 ($MILLION)
- TABLE 11. GLOBAL CAROTENOIDS MARKET, BY APPLICATION, 2021-2031 ($MILLION)
- TABLE 12. CAROTENOIDS MARKET FOR ANIMAL FEED, BY REGION, 2021-2031 ($MILLION)
- TABLE 13. CAROTENOIDS MARKET FOR HUMAN FOOD, BY REGION, 2021-2031 ($MILLION)
- TABLE 14. CAROTENOIDS MARKET FOR DIETARY SUPPLEMENT, BY REGION, 2021-2031 ($MILLION)
- TABLE 15. CAROTENOIDS MARKET FOR OTHERS, BY REGION, 2021-2031 ($MILLION)
- TABLE 16. CAROTENOIDS MARKET, BY REGION, 2021-2031 ($MILLION)
- TABLE 17. NORTH AMERICA CAROTENOIDS MARKET, BY PRODUCT, 2021-2031 ($MILLION)
- TABLE 18. NORTH AMERICA CAROTENOIDS MARKET, BY SOURCE, 2021-2031 ($MILLION)
- TABLE 19. NORTH AMERICA CAROTENOIDS MARKET, BY APPLICATION, 2021-2031 ($MILLION)
- TABLE 20. NORTH AMERICA CAROTENOIDS MARKET, BY COUNTRY, 2021-2031 ($MILLION)
- TABLE 21. U.S. CAROTENOIDS MARKET, BY PRODUCT, 2021-2031 ($MILLION)
- TABLE 22. U.S. CAROTENOIDS MARKET, BY SOURCE, 2021-2031 ($MILLION)
- TABLE 23. U.S. CAROTENOIDS MARKET, BY APPLICATION, 2021-2031 ($MILLION)
- TABLE 24. CANADA CAROTENOIDS MARKET, BY PRODUCT, 2021-2031 ($MILLION)
- TABLE 25. CANADA CAROTENOIDS MARKET, BY SOURCE, 2021-2031 ($MILLION)
- TABLE 26. CANADA CAROTENOIDS MARKET, BY APPLICATION, 2021-2031 ($MILLION)
- TABLE 27. MEXICO CAROTENOIDS MARKET, BY PRODUCT, 2021-2031 ($MILLION)
- TABLE 28. MEXICO CAROTENOIDS MARKET, BY SOURCE, 2021-2031 ($MILLION)
- TABLE 29. MEXICO CAROTENOIDS MARKET, BY APPLICATION, 2021-2031 ($MILLION)
- TABLE 30. EUROPE CAROTENOIDS MARKET, BY PRODUCT, 2021-2031 ($MILLION)
- TABLE 31. EUROPE CAROTENOIDS MARKET, BY SOURCE, 2021-2031 ($MILLION)
- TABLE 32. EUROPE CAROTENOIDS MARKET, BY APPLICATION, 2021-2031 ($MILLION)
- TABLE 33. EUROPE CAROTENOIDS MARKET, BY COUNTRY, 2021-2031 ($MILLION)
- TABLE 34. UK CAROTENOIDS MARKET, BY PRODUCT, 2021-2031 ($MILLION)
- TABLE 35. UK CAROTENOIDS MARKET, BY SOURCE, 2021-2031 ($MILLION)
- TABLE 36. UK CAROTENOIDS MARKET, BY APPLICATION, 2021-2031 ($MILLION)
- TABLE 37. GERMANY CAROTENOIDS MARKET, BY PRODUCT, 2021-2031 ($MILLION)
- TABLE 38. GERMANY CAROTENOIDS MARKET, BY SOURCE, 2021-2031 ($MILLION)
- TABLE 39. GERMANY CAROTENOIDS MARKET, BY APPLICATION, 2021-2031 ($MILLION)
- TABLE 40. FRANCE CAROTENOIDS MARKET, BY PRODUCT, 2021-2031 ($MILLION)
- TABLE 41. FRANCE CAROTENOIDS MARKET, BY SOURCE, 2021-2031 ($MILLION)
- TABLE 42. FRANCE CAROTENOIDS MARKET, BY APPLICATION, 2021-2031 ($MILLION)
- TABLE 43. ITALY CAROTENOIDS MARKET, BY PRODUCT, 2021-2031 ($MILLION)
- TABLE 44. ITALY CAROTENOIDS MARKET, BY SOURCE, 2021-2031 ($MILLION)
- TABLE 45. ITALY CAROTENOIDS MARKET, BY APPLICATION, 2021-2031 ($MILLION)
- TABLE 46. SPAIN CAROTENOIDS MARKET, BY PRODUCT, 2021-2031 ($MILLION)
- TABLE 47. SPAIN CAROTENOIDS MARKET, BY SOURCE, 2021-2031 ($MILLION)
- TABLE 48. SPAIN CAROTENOIDS MARKET, BY APPLICATION, 2021-2031 ($MILLION)
- TABLE 49. REST OF EUROPE CAROTENOIDS MARKET, BY PRODUCT, 2021-2031 ($MILLION)
- TABLE 50. REST OF EUROPE CAROTENOIDS MARKET, BY SOURCE, 2021-2031 ($MILLION)
- TABLE 51. REST OF EUROPE CAROTENOIDS MARKET, BY APPLICATION, 2021-2031 ($MILLION)
- TABLE 52. ASIA-PACIFIC CAROTENOIDS MARKET, BY PRODUCT, 2021-2031 ($MILLION)
- TABLE 53. ASIA-PACIFIC CAROTENOIDS MARKET, BY SOURCE, 2021-2031 ($MILLION)
- TABLE 54. ASIA-PACIFIC CAROTENOIDS MARKET, BY APPLICATION, 2021-2031 ($MILLION)
- TABLE 55. ASIA-PACIFIC CAROTENOIDS MARKET, BY COUNTRY, 2021-2031 ($MILLION)
- TABLE 56. CHINA CAROTENOIDS MARKET, BY PRODUCT, 2021-2031 ($MILLION)
- TABLE 57. CHINA CAROTENOIDS MARKET, BY SOURCE, 2021-2031 ($MILLION)
- TABLE 58. CHINA CAROTENOIDS MARKET, BY APPLICATION, 2021-2031 ($MILLION)
- TABLE 59. INDIA CAROTENOIDS MARKET, BY PRODUCT, 2021-2031 ($MILLION)
- TABLE 60. INDIA CAROTENOIDS MARKET, BY SOURCE, 2021-2031 ($MILLION)
- TABLE 61. INDIA CAROTENOIDS MARKET, BY APPLICATION, 2021-2031 ($MILLION)
- TABLE 62. JAPAN CAROTENOIDS MARKET, BY PRODUCT, 2021-2031 ($MILLION)
- TABLE 63. JAPAN CAROTENOIDS MARKET, BY SOURCE, 2021-2031 ($MILLION)
- TABLE 64. JAPAN CAROTENOIDS MARKET, BY APPLICATION, 2021-2031 ($MILLION)
- TABLE 65. INDONESIA CAROTENOIDS MARKET, BY PRODUCT, 2021-2031 ($MILLION)
- TABLE 66. INDONESIA CAROTENOIDS MARKET, BY SOURCE, 2021-2031 ($MILLION)
- TABLE 67. INDONESIA CAROTENOIDS MARKET, BY APPLICATION, 2021-2031 ($MILLION)
- TABLE 68. SOUTH KOREA CAROTENOIDS MARKET, BY PRODUCT, 2021-2031 ($MILLION)
- TABLE 69. SOUTH KOREA CAROTENOIDS MARKET, BY SOURCE, 2021-2031 ($MILLION)
- TABLE 70. SOUTH KOREA CAROTENOIDS MARKET, BY APPLICATION, 2021-2031 ($MILLION)
- TABLE 71. REST OF ASIA-PACIFIC CAROTENOIDS MARKET, BY PRODUCT, 2021-2031 ($MILLION)
- TABLE 72. REST OF ASIA-PACIFIC CAROTENOIDS MARKET, BY SOURCE, 2021-2031 ($MILLION)
- TABLE 73. REST OF ASIA-PACIFIC CAROTENOIDS MARKET, BY APPLICATION, 2021-2031 ($MILLION)
- TABLE 74. LAMEA CAROTENOIDS MARKET, BY PRODUCT, 2021-2031 ($MILLION)
- TABLE 75. LAMEA CAROTENOIDS MARKET, BY SOURCE, 2021-2031 ($MILLION)
- TABLE 76. LAMEA CAROTENOIDS MARKET, BY APPLICATION, 2021-2031 ($MILLION)
- TABLE 77. LAMEA CAROTENOIDS MARKET, BY COUNTRY, 2021-2031 ($MILLION)
- TABLE 78. BRAZIL CAROTENOIDS MARKET, BY PRODUCT, 2021-2031 ($MILLION)
- TABLE 79. BRAZIL CAROTENOIDS MARKET, BY SOURCE, 2021-2031 ($MILLION)
- TABLE 80. BRAZIL CAROTENOIDS MARKET, BY APPLICATION, 2021-2031 ($MILLION)
- TABLE 81. ARGENTINA CAROTENOIDS MARKET, BY PRODUCT, 2021-2031 ($MILLION)
- TABLE 82. ARGENTINA CAROTENOIDS MARKET, BY SOURCE, 2021-2031 ($MILLION)
- TABLE 83. ARGENTINA CAROTENOIDS MARKET, BY APPLICATION, 2021-2031 ($MILLION)
- TABLE 84. SOUTH AFRICA CAROTENOIDS MARKET, BY PRODUCT, 2021-2031 ($MILLION)
- TABLE 85. SOUTH AFRICA CAROTENOIDS MARKET, BY SOURCE, 2021-2031 ($MILLION)
- TABLE 86. SOUTH AFRICA CAROTENOIDS MARKET, BY APPLICATION, 2021-2031 ($MILLION)
- TABLE 87. SAUDI ARABIA CAROTENOIDS MARKET, BY PRODUCT, 2021-2031 ($MILLION)
- TABLE 88. SAUDI ARABIA CAROTENOIDS MARKET, BY SOURCE, 2021-2031 ($MILLION)
- TABLE 89. SAUDI ARABIA CAROTENOIDS MARKET, BY APPLICATION, 2021-2031 ($MILLION)
- TABLE 90. REST OF LAMEA CAROTENOIDS MARKET, BY PRODUCT, 2021-2031 ($MILLION)
- TABLE 91. REST OF LAMEA CAROTENOIDS MARKET, BY SOURCE, 2021-2031 ($MILLION)
- TABLE 92. REST OF LAMEA CAROTENOIDS MARKET, BY APPLICATION, 2021-2031 ($MILLION)
- TABLE 93. BASF SE: KEY EXECUTIVES
- TABLE 94. BASF SE: COMPANY SNAPSHOT
- TABLE 95. BASF SE: PRODUCT SEGMENTS
- TABLE 96. BASF SE: PRODUCT PORTFOLIO
- TABLE 97. KONINKLIJKE DSM N.V.: KEY EXECUTIVES
- TABLE 98. KONINKLIJKE DSM N.V.: COMPANY SNAPSHOT
- TABLE 99. KONINKLIJKE DSM N.V.: PRODUCT SEGMENTS
- TABLE 100. KONINKLIJKE DSM N.V.: PRODUCT PORTFOLIO
- TABLE 101. CHR. HANSEN HOLDING A/S: KEY EXECUTIVES
- TABLE 102. CHR. HANSEN HOLDING A/S: COMPANY SNAPSHOT
- TABLE 103. CHR. HANSEN HOLDING A/S: PRODUCT SEGMENTS
- TABLE 104. CHR. HANSEN HOLDING A/S: PRODUCT PORTFOLIO
- TABLE 105. DIVIS LABORATORIES LIMITED: KEY EXECUTIVES
- TABLE 106. DIVIS LABORATORIES LIMITED: COMPANY SNAPSHOT
- TABLE 107. DIVIS LABORATORIES LIMITED: PRODUCT SEGMENTS
- TABLE 108. DIVIS LABORATORIES LIMITED: PRODUCT PORTFOLIO
- TABLE 109. DIVIS LABORATORIES LIMITED: KEY STRATERGIES
- TABLE 110. CYANOTECH CORPORATION: KEY EXECUTIVES
- TABLE 111. CYANOTECH CORPORATION: COMPANY SNAPSHOT
- TABLE 112. CYANOTECH CORPORATION: PRODUCT SEGMENTS
- TABLE 113. CYANOTECH CORPORATION: PRODUCT PORTFOLIO
- TABLE 114. CYANOTECH CORPORATION: KEY STRATERGIES
- TABLE 115. KEMIN INDUSTRIES, INC.: KEY EXECUTIVES
- TABLE 116. KEMIN INDUSTRIES, INC.: COMPANY SNAPSHOT
- TABLE 117. KEMIN INDUSTRIES, INC.: PRODUCT SEGMENTS
- TABLE 118. KEMIN INDUSTRIES, INC.: PRODUCT PORTFOLIO
- TABLE 119. KEMIN INDUSTRIES, INC.: KEY STRATERGIES
- TABLE 120. DDW, INC.: KEY EXECUTIVES
- TABLE 121. DDW, INC.: COMPANY SNAPSHOT
- TABLE 122. DDW, INC.: PRODUCT SEGMENTS
- TABLE 123. DDW, INC.: PRODUCT PORTFOLIO
- TABLE 124. DOHLER GROUP: KEY EXECUTIVES
- TABLE 125. DOHLER GROUP: COMPANY SNAPSHOT
- TABLE 126. DOHLER GROUP: PRODUCT SEGMENTS
- TABLE 127. DOHLER GROUP: PRODUCT PORTFOLIO
- TABLE 128. ALLIED BIOTECH CORPORATION: KEY EXECUTIVES
- TABLE 129. ALLIED BIOTECH CORPORATION: COMPANY SNAPSHOT
- TABLE 130. ALLIED BIOTECH CORPORATION: PRODUCT SEGMENTS
- TABLE 131. ALLIED BIOTECH CORPORATION: PRODUCT PORTFOLIO
- TABLE 132. EXCELVITE SDN. BHD.: KEY EXECUTIVES
- TABLE 133. EXCELVITE SDN. BHD.: COMPANY SNAPSHOT
- TABLE 134. EXCELVITE SDN. BHD.: PRODUCT SEGMENTS
- TABLE 135. EXCELVITE SDN. BHD.: PRODUCT PORTFOLIO
- TABLE 136. EXCELVITE SDN. BHD.: KEY STRATERGIES
LIST OF FIGURES
- FIGURE 01. CAROTENOIDS MARKET, 2021-2031
- FIGURE 02. SEGMENTATION OF CAROTENOIDS MARKET, 2021-2031
- FIGURE 03. TOP INVESTMENT POCKETS IN CAROTENOIDS MARKET (2022-2031)
- FIGURE 04. MODERATE BARGAINING POWER OF SUPPLIERS
- FIGURE 05. MODERATE BARGAINING POWER OF BUYERS
- FIGURE 06. HIGH THREAT OF SUBSTITUTES
- FIGURE 07. LOW THREAT OF NEW ENTRANTS
- FIGURE 08. LOW INTENSITY OF RIVALRY
- FIGURE 09. DRIVERS, RESTRAINTS AND OPPORTUNITIES: GLOBALCAROTENOIDS MARKET
- FIGURE 10. CAROTENOIDS MARKET, BY PRODUCT, 2021(%)
- FIGURE 11. COMPARATIVE SHARE ANALYSIS OF CAROTENOIDS MARKET FOR ASTAXANTHIN, BY COUNTRY 2021 AND 2031(%)
- FIGURE 12. COMPARATIVE SHARE ANALYSIS OF CAROTENOIDS MARKET FOR CAPSANTHIN, BY COUNTRY 2021 AND 2031(%)
- FIGURE 13. COMPARATIVE SHARE ANALYSIS OF CAROTENOIDS MARKET FOR LUTEIN, BY COUNTRY 2021 AND 2031(%)
- FIGURE 14. COMPARATIVE SHARE ANALYSIS OF CAROTENOIDS MARKET FOR BETA-CAROTENE, BY COUNTRY 2021 AND 2031(%)
- FIGURE 15. COMPARATIVE SHARE ANALYSIS OF CAROTENOIDS MARKET FOR LYCOPENE, BY COUNTRY 2021 AND 2031(%)
- FIGURE 16. COMPARATIVE SHARE ANALYSIS OF CAROTENOIDS MARKET FOR OTHERS, BY COUNTRY 2021 AND 2031(%)
- FIGURE 17. CAROTENOIDS MARKET, BY SOURCE, 2021(%)
- FIGURE 18. COMPARATIVE SHARE ANALYSIS OF CAROTENOIDS MARKET FOR NATURAL, BY COUNTRY 2021 AND 2031(%)
- FIGURE 19. COMPARATIVE SHARE ANALYSIS OF CAROTENOIDS MARKET FOR SYNTHETIC, BY COUNTRY 2021 AND 2031(%)
- FIGURE 20. CAROTENOIDS MARKET, BY APPLICATION, 2021(%)
- FIGURE 21. COMPARATIVE SHARE ANALYSIS OF CAROTENOIDS MARKET FOR ANIMAL FEED, BY COUNTRY 2021 AND 2031(%)
- FIGURE 22. COMPARATIVE SHARE ANALYSIS OF CAROTENOIDS MARKET FOR HUMAN FOOD, BY COUNTRY 2021 AND 2031(%)
- FIGURE 23. COMPARATIVE SHARE ANALYSIS OF CAROTENOIDS MARKET FOR DIETARY SUPPLEMENT, BY COUNTRY 2021 AND 2031(%)
- FIGURE 24. COMPARATIVE SHARE ANALYSIS OF CAROTENOIDS MARKET FOR OTHERS, BY COUNTRY 2021 AND 2031(%)
- FIGURE 25. CAROTENOIDS MARKET BY REGION, 2021
- FIGURE 26. U.S. CAROTENOIDS MARKET, 2021-2031 ($MILLION)
- FIGURE 27. CANADA CAROTENOIDS MARKET, 2021-2031 ($MILLION)
- FIGURE 28. MEXICO CAROTENOIDS MARKET, 2021-2031 ($MILLION)
- FIGURE 29. UK CAROTENOIDS MARKET, 2021-2031 ($MILLION)
- FIGURE 30. GERMANY CAROTENOIDS MARKET, 2021-2031 ($MILLION)
- FIGURE 31. FRANCE CAROTENOIDS MARKET, 2021-2031 ($MILLION)
- FIGURE 32. ITALY CAROTENOIDS MARKET, 2021-2031 ($MILLION)
- FIGURE 33. SPAIN CAROTENOIDS MARKET, 2021-2031 ($MILLION)
- FIGURE 34. REST OF EUROPE CAROTENOIDS MARKET, 2021-2031 ($MILLION)
- FIGURE 35. CHINA CAROTENOIDS MARKET, 2021-2031 ($MILLION)
- FIGURE 36. INDIA CAROTENOIDS MARKET, 2021-2031 ($MILLION)
- FIGURE 37. JAPAN CAROTENOIDS MARKET, 2021-2031 ($MILLION)
- FIGURE 38. INDONESIA CAROTENOIDS MARKET, 2021-2031 ($MILLION)
- FIGURE 39. SOUTH KOREA CAROTENOIDS MARKET, 2021-2031 ($MILLION)
- FIGURE 40. REST OF ASIA-PACIFIC CAROTENOIDS MARKET, 2021-2031 ($MILLION)
- FIGURE 41. BRAZIL CAROTENOIDS MARKET, 2021-2031 ($MILLION)
- FIGURE 42. ARGENTINA CAROTENOIDS MARKET, 2021-2031 ($MILLION)
- FIGURE 43. SOUTH AFRICA CAROTENOIDS MARKET, 2021-2031 ($MILLION)
- FIGURE 44. SAUDI ARABIA CAROTENOIDS MARKET, 2021-2031 ($MILLION)
- FIGURE 45. REST OF LAMEA CAROTENOIDS MARKET, 2021-2031 ($MILLION)
- FIGURE 46. TOP WINNING STRATEGIES, BY YEAR
- FIGURE 47. TOP WINNING STRATEGIES, BY DEVELOPMENT
- FIGURE 48. TOP WINNING STRATEGIES, BY COMPANY
- FIGURE 49. PRODUCT MAPPING OF TOP 10 PLAYERS
- FIGURE 50. COMPETITIVE DASHBOARD
- FIGURE 51. COMPETITIVE HEATMAP: CAROTENOIDS MARKET
- FIGURE 52. TOP PLAYER POSITIONING, 2021
- FIGURE 53. BASF SE: NET SALES, 2020-2022 ($MILLION)
- FIGURE 54. BASF SE: RESEARCH & DEVELOPMENT EXPENDITURE, 2020-2022 ($MILLION)
- FIGURE 55. BASF SE: REVENUE SHARE BY SEGMENT, 2022 (%)
- FIGURE 56. BASF SE: REVENUE SHARE BY REGION, 2022 (%)
- FIGURE 57. CHR. HANSEN HOLDING A/S: RESEARCH & DEVELOPMENT EXPENDITURE, 2019-2021
- FIGURE 58. CHR. HANSEN HOLDING A/S: NET REVENUE, 2019-2021 ($MILLION)
- FIGURE 59. CHR. HANSEN HOLDING A/S: REVENUE SHARE BY SEGMENT, 2021 (%)
- FIGURE 60. CHR. HANSEN HOLDING A/S: REVENUE SHARE BY REGION, 2021 (%)
- FIGURE 61. DIVIS LABORATORIES LIMITED: NET REVENUE, 2019-2021 ($MILLION)
- FIGURE 62. DIVIS LABORATORIES LIMITED: REVENUE SHARE BY REGION, 2021 (%)
- FIGURE 63. CYANOTECH CORPORATION: NET SALES, 2019-2021 ($MILLION)
- FIGURE 64. CYANOTECH CORPORATION: RESEARCH & DEVELOPMENT EXPENDITURE, 2019-2021 ($MILLION)
- FIGURE 65. CYANOTECH CORPORATION: REVENUE SHARE BY REGION, 2021 (%)
 全球類胡蘿蔔素市場規模、佔有率、成長分析、依產品、依應用、依來源 - 產業預測,2024-2031 年
 隱黃質市場:依產地、應用、最終用戶、分銷管道、地區
 Crocin市場規模、份額和趨勢分析報告:應用(食品、製藥)、純度、適應症、分銷渠道、地區、預測按細分市場,2023-2030年
 人營養類胡蘿蔔素的全球市場 (2022-2028年):各類型 (蝦青素、β-胡蘿蔔素)、用途 (營養補充品、功能性營養) 的規模、佔有率、成長分析、預測
 全球類胡蘿蔔素市場 (2023-2030)
 類胡蘿蔔素的全球市場:歐洲收益領導全球市場
 類胡蘿蔔素的全球市場
 類胡蘿蔔素的全球市場調查報告-產業分析,規模,佔有率,成長,趨勢,2022年~2028年前的預測
 阿卜胡蘿蔔醛的全球市場(2022年~2029年)
 葉黃素的全球市場 - 產業分析,規模,佔有率,成長,趨勢,2022年~2028年前的預測