


 |
市場調查報告書
商品編碼
1298174
UV 固化油墨市場:按類型(膠印油墨、柔印油墨、絲網印刷、數字印刷、噴墨等)按最終用途劃分:2021-2031 年全球機會分析和行業預測UV Curable Ink Market By Type (Offset Ink, Flexo Ink, Screen Printing, Digital Printing, Inkjet, Others), By End Use (Automobile, Consumer goods, Medical, Publications & printing, Others): Global Opportunity Analysis & Industry Forecast, 2021-2031 |
||||||
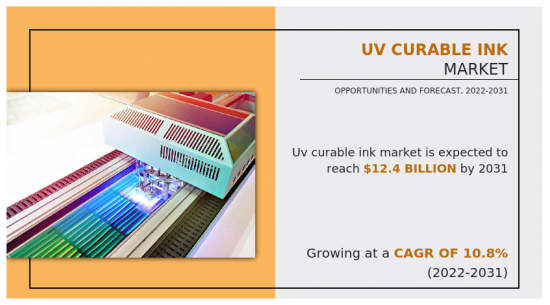
預計2021年全球UV固化油墨市場規模將達到45億美元,2022年至2031年復合年增長率為10.8%,2031年將達到124億美元。
紫外線固化油墨是在紫外線存在下通過光化學過程進行處理的,這會導致油墨乾燥。 由於具有更好的附著力、更好的耐溶劑性、更低的廢品率和更高的產量等優點,這些油墨比傳統油墨更被廣泛接受。 由於人們意識的提高和對提高包裝食品安全性的關注以及環境法規的變化,UV 油墨的採用正在增加。 UV固化油墨廣泛應用於包裝行業,主要在亞太地區。
UV 固化油墨的獨特性能和打印機意識的不斷增強預計將推動全球對 UV 固化油墨的需求。 由於其高效率和低環境影響,特別是在3D打印領域,這些墨水的採用正在增加,預計將推動全球市場的增長。 由於UV油墨在該地區的高采用率,亞太市場大幅增長。 印度和中國等新興市場對紫外線固化油墨的需求不斷增長,預計將在預測期內推動紫外線固化油墨市場的增長。
保險商實驗室和歐洲印刷油墨協會等機構制定的嚴格監管框架可能會對 UV 固化油墨市場的增長產生積極影響。 這些墨水已製定多項標準和認證,以保護消費者並減少潛在危險。 高昂的初始成本和原材料價格的波動可能會阻礙預測期內紫外線固化油墨市場的增長。 高成本是指調整印刷顏色所需的網紋輥陣列和昂貴的UV固化設備。 然而,消費品、醫療、出版和印刷以及汽車等最終用途行業對紫外線固化油墨的需求迅速增長,預計將在預測期內推動市場增長。
內容
第一章簡介
第 2 章執行摘要
第三章市場概述
- 市場定義和範圍
- 主要發現
- 影響因素
- 主要投資領域
- 波特五力分析
- 供應商的議價能力
- 買家的議價能力
- 替代品的威脅
- 新進入者的威脅
- 競爭強度
- 市場動態
- 協調員
- 包裝行業對膠印 UV 固化油墨的需求增加
- 汽車行業的需求增加
- 出版和包裝行業的穩定需求
- 阻礙因素
- 原材料價格波動和替代品供應情況
- 機會
- 快速轉向環保產品
- 醫療領域快速增長
- 協調員
- COVID-19:市場影響分析
- 市場份額分析
- 專利情況
- 價格分析
- 監管指南
- 價值鏈分析
第 4 章 UV 固化油墨市場:按類型
- 概述
- 市場規模和預測
- 膠印油墨
- 主要市場趨勢、增長動力和機遇
- 市場規模和預測:按地區劃分
- 市場份額分析:按國家/地區劃分
- 柔版油墨
- 主要市場趨勢、增長動力和機遇
- 市場規模和預測:按地區劃分
- 市場份額分析:按國家/地區劃分
- 絲網印刷
- 主要市場趨勢、增長動力和機遇
- 市場規模和預測:按地區劃分
- 市場份額分析:按國家/地區劃分
- 數碼印刷
- 主要市場趨勢、增長因素和機遇
- 市場規模和預測:按地區劃分
- 市場份額分析:按國家/地區劃分
- 噴墨
- 主要市場趨勢、增長因素和機遇
- 市場規模和預測:按地區劃分
- 市場份額分析:按國家/地區劃分
- 其他
- 主要市場趨勢、增長因素和機遇
- 市場規模和預測:按地區劃分
- 市場份額分析:按國家/地區劃分
第 5 章 UV 固化油墨市場:按最終用途劃分
- 概述
- 市場規模和預測
- 汽車
- 主要市場趨勢、增長動力和機遇
- 市場規模和預測:按地區劃分
- 市場份額分析:按國家/地區劃分
- 消費品
- 主要市場趨勢、增長因素和機遇
- 市場規模和預測:按地區劃分
- 市場份額分析:按國家/地區劃分
- 醫療
- 主要市場趨勢、增長動力和機遇
- 市場規模和預測:按地區劃分
- 市場份額分析:按國家/地區劃分
- 出版/印刷
- 主要市場趨勢、增長動力和機遇
- 市場規模和預測:按地區劃分
- 市場份額分析:按國家/地區劃分
- 其他
- 主要市場趨勢、增長動力和機遇
- 市場規模和預測:按地區劃分
- 市場份額分析:按國家/地區劃分
第六章 UV 固化油墨市場:按地區
- 概述
- 市場規模和預測:按地區劃分
- 北美
- 主要趨勢和機遇
- 市場規模/預測:按類型
- 市場規模和預測:按最終用途分類
- 市場規模/預測:按國家/地區劃分
- 美國
- 主要市場趨勢、增長動力和機遇
- 市場規模/預測:按類型
- 市場規模和預測:按最終用途分類
- 加拿大
- 主要市場趨勢、增長動力和機遇
- 市場規模/預測:按類型
- 市場規模和預測:按最終用途分類
- 墨西哥
- 主要市場趨勢、增長動力和機遇
- 市場規模/預測:按類型
- 市場規模和預測:按最終用途分類
- 歐洲
- 主要趨勢和機遇
- 市場規模/預測:按類型
- 市場規模和預測:按最終用途分類
- 市場規模/預測:按國家/地區劃分
- 德國
- 主要市場趨勢、增長動力和機遇
- 市場規模/預測:按類型
- 市場規模和預測:按最終用途分類
- 英國
- 主要市場趨勢、增長動力和機遇
- 市場規模/預測:按類型
- 市場規模和預測:按最終用途分類
- 法國
- 主要市場趨勢、增長動力和機遇
- 市場規模/預測:按類型
- 市場規模和預測:按最終用途分類
- 意大利
- 主要市場趨勢、增長動力和機遇
- 市場規模/預測:按類型
- 市場規模和預測:按最終用途分類
- 西班牙
- 主要市場趨勢、增長動力和機遇
- 市場規模/預測:按類型
- 市場規模和預測:按最終用途分類
- 歐洲其他地區
- 主要市場趨勢、增長動力和機遇
- 市場規模/預測:按類型
- 市場規模和預測:按最終用途分類
- 亞太地區
- 主要趨勢和機遇
- 市場規模/預測:按類型
- 市場規模和預測:按最終用途分類
- 市場規模/預測:按國家/地區劃分
- 中國
- 主要市場趨勢、增長動力和機遇
- 市場規模/預測:按類型
- 市場規模和預測:按最終用途分類
- 印度
- 主要市場趨勢、增長動力和機遇
- 市場規模/預測:按類型
- 市場規模和預測:按最終用途分類
- 韓國
- 主要市場趨勢、增長動力和機遇
- 市場規模/預測:按類型
- 市場規模和預測:按最終用途分類
- 日本
- 主要市場趨勢、增長動力和機遇
- 市場規模/預測:按類型
- 市場規模和預測:按最終用途分類
- 澳大利亞
- 主要市場趨勢、增長動力和機遇
- 市場規模/預測:按類型
- 市場規模和預測:按最終用途分類
- 亞太地區其他地區
- 主要市場趨勢、增長動力和機遇
- 市場規模/預測:按類型
- 市場規模和預測:按最終用途分類
- 拉丁美洲/中東/非洲
- 主要趨勢和機遇
- 市場規模/預測:按類型
- 市場規模和預測:按最終用途分類
- 市場規模/預測:按國家/地區劃分
- 巴西
- 主要市場趨勢、增長動力和機遇
- 市場規模/預測:按類型
- 市場規模和預測:按最終用途分類
- 南非
- 主要市場趨勢、增長動力和機遇
- 市場規模/預測:按類型
- 市場規模和預測:按最終用途分類
- 沙特阿拉伯
- 主要市場趨勢、增長動力和機遇
- 市場規模/預測:按類型
- 市場規模和預測:按最終用途分類
- 其他地區
- 主要市場趨勢、增長動力和機遇
- 市場規模/預測:按類型
- 市場規模和預測:按最終用途分類
第7章競爭格局
- 簡介
- 關鍵成功策略
- 10家主要公司的產品圖譜
- 競賽儀表板
- 比賽熱圖
- 頂級公司定位(2021 年)
第8章公司簡介
- RUCO Druckfarben
- flint group
- Toyo Ink SC Holdings Co., Ltd
- Gans Ink & Supply Co.
- Nutec Digital Ink Pvt. Ltd.
- Kao Collins Corporation
- Maxell, Ltd
- Teikoku Printing Inks Mfg. Co., Ltd
- Marabu GmbH & Co. KG
- Spinks World
The global UV curable ink market was valued at $4.5 billion in 2021, and is projected to reach $12.4 billion by 2031, growing at a CAGR of 10.8% from 2022 to 2031.
UV curable inks are processed through a photochemical process in presence of ultraviolet light, which leads to the drying of the ink. These inks have witnessed prevalent acceptance over traditional inks, owing to several advantages, such as surge in superior bonding, rise in superior solvent resistance properties, reduction in rejection rates, and increase in production output. UV inks have witnessed an increase in their adoption, due to increase in awareness and surge in concentration on improving the safety of packaged foods and change in environmental regulations. The UV curable inks have been extensively used in the packaging industry, majorly in Asia-Pacific.
Unique characteristics of UV curable inks and rise in awareness among printers are projected to amplify the demand for UV curable inks across the globe. The growth in adoption of these inks because of their high-performance efficiency, especially in the 3D printing sector and low environmental impact is projected to drive the growth of the global market. Asia-Pacific market is rising substantially as the adoption rate of UV inks in the region is high. The growth in demand for UV curable ink from developing countries, such as India and China is expected to boost the UV curable ink market growth during the forecast period.
Strict regulatory frameworks by agencies namely, the Underwriter's Laboratories and the European Printing Ink Association are likely to have a positive impact on the UV curable ink market growth. Several standards and certifications have been implemented for these inks, to offer consumer protection and decrease potential hazards. High initial cost and fluctuation in raw material prices may hinder the growth of the UV curable inks market during the forecast period. High costs refer to an array of anilox rolls that are required to adjust the print color and costly ultraviolet curing equipment. However, rapidly rise in demand for UV curing inks from end use industries, such as consumer goods, medical, publication & printing, and automobile is projected to boost the market growth during the forecast period.
The UV curable ink market is segmented on the basis of type, end-use, and region. On the basis of type, the market is categorized into offset ink, flexo Ink, screen printing, digital printing, inkjet, and others. On the basis of end-use, it is divided into automobile, consumer goods, medical, publication & printing, and others. Region-wise, the market is studied across North America, Europe, Asia-Pacific, and LAMEA.
In addition, the report covers profiles of key industry participants such as Teikoku Printing Inks Mfg. Co., Ltd, Maxell, Ltd, Flint Group, Gans Ink & Supply Co, Marabu GmbH & Co. KG, Kao Collins Corporation, Spinks World, NUtec Digital Ink, RUCO Druckfarben, and Toyo Ink SC Holdings Co., Ltd. These players have adopted several strategies to propel the market of microporous material during the forecast period.
KEY BENEFITS FOR STAKEHOLDERS
- The report provides an extensive qualitative and quantitative analysis of the current trends and future estimations of the global UV curable inks market from 2021 to 2031 to determine the prevailing opportunities.
- A comprehensive analysis of the factors that drive and restrict the growth of the market is provided.
- Estimations and forecast are based on factors impacting the market growth, in terms of both value and volume.
- Profiles of leading players operating in the market are provided to understand the global competitive scenario.
- The report provides extensive qualitative insights on the significant segments and regions exhibiting favorable market growth.
COVID-19 Impact on Market
UV curable ink prices were high in the Asia-Pacific region during the OCIVD-19 scenario due to regional demand trends and tight product availability. However, the increase in awareness for eco-friendly products among citizens of both developed and developing economies is anticipated to surge the popularity of UV curable ink in various end use sectors post COVID-19.
Additionally, the overall service activities of market players have registered a steady and favorable recovery in the subsequent months with an increase in the sales of passenger cars. This is predicted to enhance the performance of the UV Curable Ink market post-COVID
Key Market Segments
By Type
- Digital Printing
- Offset Ink
- Flexo Ink
- Screen Printing
- Inkjet
- Others
By End Use
- Automobile
- Consumer goods
- Medical
- Publications and printing
- Others
By Region
- North America
- U.S.
- Canada
- Mexico
- Europe
- Germany
- UK
- France
- Italy
- Spain
- Rest of Europe
- Asia-Pacific
- China
- India
- South Korea
- Japan
- Australia
- Rest of Asia-Pacific
- LAMEA
- Brazil
- South Africa,
- Saudi Arabia
- Rest of LAMEA
Key Market Players:
- flint group
- Toyo Ink SC Holdings Co., Ltd
- RUCO Druckfarben
- Maxell, Ltd
- Spinks World
- .Kao Collins Corporation
- Teikoku Printing Inks Mfg. Co., Ltd
- Nutec Digital Ink Pvt. Ltd.
- Gans Ink & Supply Co.
- Marabu GmbH & Co. KG
TABLE OF CONTENTS
CHAPTER 1: INTRODUCTION
- 1.1. Report description
- 1.2. Key market segments
- 1.3. Key benefits to the stakeholders
- 1.4. Research Methodology
- 1.4.1. Primary research
- 1.4.2. Secondary research
- 1.4.3. Analyst tools and models
CHAPTER 2: EXECUTIVE SUMMARY
- 2.1. CXO Perspective
CHAPTER 3: MARKET OVERVIEW
- 3.1. Market definition and scope
- 3.2. Key findings
- 3.2.1. Top impacting factors
- 3.2.2. Top investment pockets
- 3.3. Porter's five forces analysis
- 3.3.1. Bargaining power of suppliers
- 3.3.2. Bargaining power of buyers
- 3.3.3. Threat of substitutes
- 3.3.4. Threat of new entrants
- 3.3.5. Intensity of rivalry
- 3.4. Market dynamics
- 3.4.1. Drivers
- 3.4.1.1. Increased demand for offset UV curable ink from packaging industry
- 3.4.1.2. Increase in demand from automotive sector
- 3.4.1.3. Robust demand from publication and packaging sector
- 3.4.1. Drivers
- 3.4.2. Restraints
- 3.4.2.1. Volatility in raw material prices and availability of substitutes
- 3.4.3. Opportunities
- 3.4.3.1. Rapid shift toward environment-friendly products
- 3.4.3.2. Rapid growth of medical sector
- 3.5. COVID-19 Impact Analysis on the market
- 3.6. Market Share Analysis
- 3.7. Patent Landscape
- 3.8. Pricing Analysis
- 3.9. Regulatory Guidelines
- 3.10. Value Chain Analysis
CHAPTER 4: UV CURABLE INK MARKET, BY TYPE
- 4.1. Overview
- 4.1.1. Market size and forecast
- 4.2. Offset Ink
- 4.2.1. Key market trends, growth factors and opportunities
- 4.2.2. Market size and forecast, by region
- 4.2.3. Market share analysis by country
- 4.3. Flexo Ink
- 4.3.1. Key market trends, growth factors and opportunities
- 4.3.2. Market size and forecast, by region
- 4.3.3. Market share analysis by country
- 4.4. Screen Printing
- 4.4.1. Key market trends, growth factors and opportunities
- 4.4.2. Market size and forecast, by region
- 4.4.3. Market share analysis by country
- 4.5. Digital Printing
- 4.5.1. Key market trends, growth factors and opportunities
- 4.5.2. Market size and forecast, by region
- 4.5.3. Market share analysis by country
- 4.6. Inkjet
- 4.6.1. Key market trends, growth factors and opportunities
- 4.6.2. Market size and forecast, by region
- 4.6.3. Market share analysis by country
- 4.7. Others
- 4.7.1. Key market trends, growth factors and opportunities
- 4.7.2. Market size and forecast, by region
- 4.7.3. Market share analysis by country
CHAPTER 5: UV CURABLE INK MARKET, BY END USE
- 5.1. Overview
- 5.1.1. Market size and forecast
- 5.2. Automobile
- 5.2.1. Key market trends, growth factors and opportunities
- 5.2.2. Market size and forecast, by region
- 5.2.3. Market share analysis by country
- 5.3. Consumer goods
- 5.3.1. Key market trends, growth factors and opportunities
- 5.3.2. Market size and forecast, by region
- 5.3.3. Market share analysis by country
- 5.4. Medical
- 5.4.1. Key market trends, growth factors and opportunities
- 5.4.2. Market size and forecast, by region
- 5.4.3. Market share analysis by country
- 5.5. Publications and printing
- 5.5.1. Key market trends, growth factors and opportunities
- 5.5.2. Market size and forecast, by region
- 5.5.3. Market share analysis by country
- 5.6. Others
- 5.6.1. Key market trends, growth factors and opportunities
- 5.6.2. Market size and forecast, by region
- 5.6.3. Market share analysis by country
CHAPTER 6: UV CURABLE INK MARKET, BY REGION
- 6.1. Overview
- 6.1.1. Market size and forecast By Region
- 6.2. North America
- 6.2.1. Key trends and opportunities
- 6.2.2. Market size and forecast, by Type
- 6.2.3. Market size and forecast, by End Use
- 6.2.4. Market size and forecast, by country
- 6.2.4.1. U.S.
- 6.2.4.1.1. Key market trends, growth factors and opportunities
- 6.2.4.1.2. Market size and forecast, by Type
- 6.2.4.1.3. Market size and forecast, by End Use
- 6.2.4.2. Canada
- 6.2.4.2.1. Key market trends, growth factors and opportunities
- 6.2.4.2.2. Market size and forecast, by Type
- 6.2.4.2.3. Market size and forecast, by End Use
- 6.2.4.3. Mexico
- 6.2.4.3.1. Key market trends, growth factors and opportunities
- 6.2.4.3.2. Market size and forecast, by Type
- 6.2.4.3.3. Market size and forecast, by End Use
- 6.3. Europe
- 6.3.1. Key trends and opportunities
- 6.3.2. Market size and forecast, by Type
- 6.3.3. Market size and forecast, by End Use
- 6.3.4. Market size and forecast, by country
- 6.3.4.1. Germany
- 6.3.4.1.1. Key market trends, growth factors and opportunities
- 6.3.4.1.2. Market size and forecast, by Type
- 6.3.4.1.3. Market size and forecast, by End Use
- 6.3.4.2. UK
- 6.3.4.2.1. Key market trends, growth factors and opportunities
- 6.3.4.2.2. Market size and forecast, by Type
- 6.3.4.2.3. Market size and forecast, by End Use
- 6.3.4.3. France
- 6.3.4.3.1. Key market trends, growth factors and opportunities
- 6.3.4.3.2. Market size and forecast, by Type
- 6.3.4.3.3. Market size and forecast, by End Use
- 6.3.4.4. Italy
- 6.3.4.4.1. Key market trends, growth factors and opportunities
- 6.3.4.4.2. Market size and forecast, by Type
- 6.3.4.4.3. Market size and forecast, by End Use
- 6.3.4.5. Spain
- 6.3.4.5.1. Key market trends, growth factors and opportunities
- 6.3.4.5.2. Market size and forecast, by Type
- 6.3.4.5.3. Market size and forecast, by End Use
- 6.3.4.6. Rest of Europe
- 6.3.4.6.1. Key market trends, growth factors and opportunities
- 6.3.4.6.2. Market size and forecast, by Type
- 6.3.4.6.3. Market size and forecast, by End Use
- 6.4. Asia-Pacific
- 6.4.1. Key trends and opportunities
- 6.4.2. Market size and forecast, by Type
- 6.4.3. Market size and forecast, by End Use
- 6.4.4. Market size and forecast, by country
- 6.4.4.1. China
- 6.4.4.1.1. Key market trends, growth factors and opportunities
- 6.4.4.1.2. Market size and forecast, by Type
- 6.4.4.1.3. Market size and forecast, by End Use
- 6.4.4.2. India
- 6.4.4.2.1. Key market trends, growth factors and opportunities
- 6.4.4.2.2. Market size and forecast, by Type
- 6.4.4.2.3. Market size and forecast, by End Use
- 6.4.4.3. South Korea
- 6.4.4.3.1. Key market trends, growth factors and opportunities
- 6.4.4.3.2. Market size and forecast, by Type
- 6.4.4.3.3. Market size and forecast, by End Use
- 6.4.4.4. Japan
- 6.4.4.4.1. Key market trends, growth factors and opportunities
- 6.4.4.4.2. Market size and forecast, by Type
- 6.4.4.4.3. Market size and forecast, by End Use
- 6.4.4.5. Australia
- 6.4.4.5.1. Key market trends, growth factors and opportunities
- 6.4.4.5.2. Market size and forecast, by Type
- 6.4.4.5.3. Market size and forecast, by End Use
- 6.4.4.6. Rest of Asia-Pacific
- 6.4.4.6.1. Key market trends, growth factors and opportunities
- 6.4.4.6.2. Market size and forecast, by Type
- 6.4.4.6.3. Market size and forecast, by End Use
- 6.5. LAMEA
- 6.5.1. Key trends and opportunities
- 6.5.2. Market size and forecast, by Type
- 6.5.3. Market size and forecast, by End Use
- 6.5.4. Market size and forecast, by country
- 6.5.4.1. Brazil
- 6.5.4.1.1. Key market trends, growth factors and opportunities
- 6.5.4.1.2. Market size and forecast, by Type
- 6.5.4.1.3. Market size and forecast, by End Use
- 6.5.4.2. South Africa,
- 6.5.4.2.1. Key market trends, growth factors and opportunities
- 6.5.4.2.2. Market size and forecast, by Type
- 6.5.4.2.3. Market size and forecast, by End Use
- 6.5.4.3. Saudi Arabia
- 6.5.4.3.1. Key market trends, growth factors and opportunities
- 6.5.4.3.2. Market size and forecast, by Type
- 6.5.4.3.3. Market size and forecast, by End Use
- 6.5.4.4. Rest of LAMEA
- 6.5.4.4.1. Key market trends, growth factors and opportunities
- 6.5.4.4.2. Market size and forecast, by Type
- 6.5.4.4.3. Market size and forecast, by End Use
CHAPTER 7: COMPETITIVE LANDSCAPE
- 7.1. Introduction
- 7.2. Top winning strategies
- 7.3. Product Mapping of Top 10 Player
- 7.4. Competitive Dashboard
- 7.5. Competitive Heatmap
- 7.6. Top player positioning, 2021
CHAPTER 8: COMPANY PROFILES
- 8.1. RUCO Druckfarben
- 8.1.1. Company overview
- 8.1.2. Key Executives
- 8.1.3. Company snapshot
- 8.1.4. Operating business segments
- 8.1.5. Product portfolio
- 8.2. flint group
- 8.2.1. Company overview
- 8.2.2. Key Executives
- 8.2.3. Company snapshot
- 8.2.4. Operating business segments
- 8.2.5. Product portfolio
- 8.3. Toyo Ink SC Holdings Co., Ltd
- 8.3.1. Company overview
- 8.3.2. Key Executives
- 8.3.3. Company snapshot
- 8.3.4. Operating business segments
- 8.3.5. Product portfolio
- 8.4. Gans Ink & Supply Co.
- 8.4.1. Company overview
- 8.4.2. Key Executives
- 8.4.3. Company snapshot
- 8.4.4. Operating business segments
- 8.4.5. Product portfolio
- 8.5. Nutec Digital Ink Pvt. Ltd.
- 8.5.1. Company overview
- 8.5.2. Key Executives
- 8.5.3. Company snapshot
- 8.5.4. Operating business segments
- 8.5.5. Product portfolio
- 8.5.6. Key strategic moves and developments
- 8.6. .Kao Collins Corporation
- 8.6.1. Company overview
- 8.6.2. Key Executives
- 8.6.3. Company snapshot
- 8.6.4. Operating business segments
- 8.6.5. Product portfolio
- 8.7. Maxell, Ltd
- 8.7.1. Company overview
- 8.7.2. Key Executives
- 8.7.3. Company snapshot
- 8.7.4. Operating business segments
- 8.7.5. Product portfolio
- 8.7.6. Business performance
- 8.8. Teikoku Printing Inks Mfg. Co., Ltd
- 8.8.1. Company overview
- 8.8.2. Key Executives
- 8.8.3. Company snapshot
- 8.8.4. Operating business segments
- 8.8.5. Product portfolio
- 8.8.6. Business performance
- 8.8.7. Key strategic moves and developments
- 8.9. Marabu GmbH & Co. KG
- 8.9.1. Company overview
- 8.9.2. Key Executives
- 8.9.3. Company snapshot
- 8.9.4. Operating business segments
- 8.9.5. Product portfolio
- 8.10. Spinks World
- 8.10.1. Company overview
- 8.10.2. Key Executives
- 8.10.3. Company snapshot
- 8.10.4. Operating business segments
- 8.10.5. Product portfolio
LIST OF TABLES
- TABLE 01. GLOBAL UV CURABLE INK MARKET, BY TYPE, 2021-2031 ($MILLION)
- TABLE 02. GLOBAL UV CURABLE INK MARKET, BY TYPE, 2021-2031 (TONS)
- TABLE 03. UV CURABLE INK MARKET FOR OFFSET INK, BY REGION, 2021-2031 ($MILLION)
- TABLE 04. UV CURABLE INK MARKET FOR OFFSET INK, BY REGION, 2021-2031 (TONS)
- TABLE 05. UV CURABLE INK MARKET FOR FLEXO INK, BY REGION, 2021-2031 ($MILLION)
- TABLE 06. UV CURABLE INK MARKET FOR FLEXO INK, BY REGION, 2021-2031 (TONS)
- TABLE 07. UV CURABLE INK MARKET FOR SCREEN PRINTING, BY REGION, 2021-2031 ($MILLION)
- TABLE 08. UV CURABLE INK MARKET FOR SCREEN PRINTING, BY REGION, 2021-2031 (TONS)
- TABLE 09. UV CURABLE INK MARKET FOR DIGITAL PRINTING, BY REGION, 2021-2031 ($MILLION)
- TABLE 10. UV CURABLE INK MARKET FOR DIGITAL PRINTING, BY REGION, 2021-2031 (TONS)
- TABLE 11. UV CURABLE INK MARKET FOR INKJET, BY REGION, 2021-2031 ($MILLION)
- TABLE 12. UV CURABLE INK MARKET FOR INKJET, BY REGION, 2021-2031 (TONS)
- TABLE 13. UV CURABLE INK MARKET FOR OTHERS, BY REGION, 2021-2031 ($MILLION)
- TABLE 14. UV CURABLE INK MARKET FOR OTHERS, BY REGION, 2021-2031 (TONS)
- TABLE 15. GLOBAL UV CURABLE INK MARKET, BY END USE, 2021-2031 ($MILLION)
- TABLE 16. GLOBAL UV CURABLE INK MARKET, BY END USE, 2021-2031 (TONS)
- TABLE 17. UV CURABLE INK MARKET FOR AUTOMOBILE, BY REGION, 2021-2031 ($MILLION)
- TABLE 18. UV CURABLE INK MARKET FOR AUTOMOBILE, BY REGION, 2021-2031 (TONS)
- TABLE 19. UV CURABLE INK MARKET FOR CONSUMER GOODS, BY REGION, 2021-2031 ($MILLION)
- TABLE 20. UV CURABLE INK MARKET FOR CONSUMER GOODS, BY REGION, 2021-2031 (TONS)
- TABLE 21. UV CURABLE INK MARKET FOR MEDICAL, BY REGION, 2021-2031 ($MILLION)
- TABLE 22. UV CURABLE INK MARKET FOR MEDICAL, BY REGION, 2021-2031 (TONS)
- TABLE 23. UV CURABLE INK MARKET FOR PUBLICATIONS AND PRINTING, BY REGION, 2021-2031 ($MILLION)
- TABLE 24. UV CURABLE INK MARKET FOR PUBLICATIONS AND PRINTING, BY REGION, 2021-2031 (TONS)
- TABLE 25. UV CURABLE INK MARKET FOR OTHERS, BY REGION, 2021-2031 ($MILLION)
- TABLE 26. UV CURABLE INK MARKET FOR OTHERS, BY REGION, 2021-2031 (TONS)
- TABLE 27. UV CURABLE INK MARKET, BY REGION, 2021-2031 ($MILLION)
- TABLE 28. UV CURABLE INK MARKET, BY REGION, 2021-2031 (TONS)
- TABLE 29. NORTH AMERICA UV CURABLE INK MARKET, BY TYPE, 2021-2031 ($MILLION)
- TABLE 30. NORTH AMERICA UV CURABLE INK MARKET, BY TYPE, 2021-2031 (TONS)
- TABLE 31. NORTH AMERICA UV CURABLE INK MARKET, BY END USE, 2021-2031 ($MILLION)
- TABLE 32. NORTH AMERICA UV CURABLE INK MARKET, BY END USE, 2021-2031 (TONS)
- TABLE 33. NORTH AMERICA UV CURABLE INK MARKET, BY COUNTRY, 2021-2031 ($MILLION)
- TABLE 34. NORTH AMERICA UV CURABLE INK MARKET, BY COUNTRY, 2021-2031 (TONS)
- TABLE 35. U.S. UV CURABLE INK MARKET, BY TYPE, 2021-2031 ($MILLION)
- TABLE 36. U.S. UV CURABLE INK MARKET, BY TYPE, 2021-2031 (TONS)
- TABLE 37. U.S. UV CURABLE INK MARKET, BY END USE, 2021-2031 ($MILLION)
- TABLE 38. U.S. UV CURABLE INK MARKET, BY END USE, 2021-2031 (TONS)
- TABLE 39. CANADA UV CURABLE INK MARKET, BY TYPE, 2021-2031 ($MILLION)
- TABLE 40. CANADA UV CURABLE INK MARKET, BY TYPE, 2021-2031 (TONS)
- TABLE 41. CANADA UV CURABLE INK MARKET, BY END USE, 2021-2031 ($MILLION)
- TABLE 42. CANADA UV CURABLE INK MARKET, BY END USE, 2021-2031 (TONS)
- TABLE 43. MEXICO UV CURABLE INK MARKET, BY TYPE, 2021-2031 ($MILLION)
- TABLE 44. MEXICO UV CURABLE INK MARKET, BY TYPE, 2021-2031 (TONS)
- TABLE 45. MEXICO UV CURABLE INK MARKET, BY END USE, 2021-2031 ($MILLION)
- TABLE 46. MEXICO UV CURABLE INK MARKET, BY END USE, 2021-2031 (TONS)
- TABLE 47. EUROPE UV CURABLE INK MARKET, BY TYPE, 2021-2031 ($MILLION)
- TABLE 48. EUROPE UV CURABLE INK MARKET, BY TYPE, 2021-2031 (TONS)
- TABLE 49. EUROPE UV CURABLE INK MARKET, BY END USE, 2021-2031 ($MILLION)
- TABLE 50. EUROPE UV CURABLE INK MARKET, BY END USE, 2021-2031 (TONS)
- TABLE 51. EUROPE UV CURABLE INK MARKET, BY COUNTRY, 2021-2031 ($MILLION)
- TABLE 52. EUROPE UV CURABLE INK MARKET, BY COUNTRY, 2021-2031 (TONS)
- TABLE 53. GERMANY UV CURABLE INK MARKET, BY TYPE, 2021-2031 ($MILLION)
- TABLE 54. GERMANY UV CURABLE INK MARKET, BY TYPE, 2021-2031 (TONS)
- TABLE 55. GERMANY UV CURABLE INK MARKET, BY END USE, 2021-2031 ($MILLION)
- TABLE 56. GERMANY UV CURABLE INK MARKET, BY END USE, 2021-2031 (TONS)
- TABLE 57. UK UV CURABLE INK MARKET, BY TYPE, 2021-2031 ($MILLION)
- TABLE 58. UK UV CURABLE INK MARKET, BY TYPE, 2021-2031 (TONS)
- TABLE 59. UK UV CURABLE INK MARKET, BY END USE, 2021-2031 ($MILLION)
- TABLE 60. UK UV CURABLE INK MARKET, BY END USE, 2021-2031 (TONS)
- TABLE 61. FRANCE UV CURABLE INK MARKET, BY TYPE, 2021-2031 ($MILLION)
- TABLE 62. FRANCE UV CURABLE INK MARKET, BY TYPE, 2021-2031 (TONS)
- TABLE 63. FRANCE UV CURABLE INK MARKET, BY END USE, 2021-2031 ($MILLION)
- TABLE 64. FRANCE UV CURABLE INK MARKET, BY END USE, 2021-2031 (TONS)
- TABLE 65. ITALY UV CURABLE INK MARKET, BY TYPE, 2021-2031 ($MILLION)
- TABLE 66. ITALY UV CURABLE INK MARKET, BY TYPE, 2021-2031 (TONS)
- TABLE 67. ITALY UV CURABLE INK MARKET, BY END USE, 2021-2031 ($MILLION)
- TABLE 68. ITALY UV CURABLE INK MARKET, BY END USE, 2021-2031 (TONS)
- TABLE 69. SPAIN UV CURABLE INK MARKET, BY TYPE, 2021-2031 ($MILLION)
- TABLE 70. SPAIN UV CURABLE INK MARKET, BY TYPE, 2021-2031 (TONS)
- TABLE 71. SPAIN UV CURABLE INK MARKET, BY END USE, 2021-2031 ($MILLION)
- TABLE 72. SPAIN UV CURABLE INK MARKET, BY END USE, 2021-2031 (TONS)
- TABLE 73. REST OF EUROPE UV CURABLE INK MARKET, BY TYPE, 2021-2031 ($MILLION)
- TABLE 74. REST OF EUROPE UV CURABLE INK MARKET, BY TYPE, 2021-2031 (TONS)
- TABLE 75. REST OF EUROPE UV CURABLE INK MARKET, BY END USE, 2021-2031 ($MILLION)
- TABLE 76. REST OF EUROPE UV CURABLE INK MARKET, BY END USE, 2021-2031 (TONS)
- TABLE 77. ASIA-PACIFIC UV CURABLE INK MARKET, BY TYPE, 2021-2031 ($MILLION)
- TABLE 78. ASIA-PACIFIC UV CURABLE INK MARKET, BY TYPE, 2021-2031 (TONS)
- TABLE 79. ASIA-PACIFIC UV CURABLE INK MARKET, BY END USE, 2021-2031 ($MILLION)
- TABLE 80. ASIA-PACIFIC UV CURABLE INK MARKET, BY END USE, 2021-2031 (TONS)
- TABLE 81. ASIA-PACIFIC UV CURABLE INK MARKET, BY COUNTRY, 2021-2031 ($MILLION)
- TABLE 82. ASIA-PACIFIC UV CURABLE INK MARKET, BY COUNTRY, 2021-2031 (TONS)
- TABLE 83. CHINA UV CURABLE INK MARKET, BY TYPE, 2021-2031 ($MILLION)
- TABLE 84. CHINA UV CURABLE INK MARKET, BY TYPE, 2021-2031 (TONS)
- TABLE 85. CHINA UV CURABLE INK MARKET, BY END USE, 2021-2031 ($MILLION)
- TABLE 86. CHINA UV CURABLE INK MARKET, BY END USE, 2021-2031 (TONS)
- TABLE 87. INDIA UV CURABLE INK MARKET, BY TYPE, 2021-2031 ($MILLION)
- TABLE 88. INDIA UV CURABLE INK MARKET, BY TYPE, 2021-2031 (TONS)
- TABLE 89. INDIA UV CURABLE INK MARKET, BY END USE, 2021-2031 ($MILLION)
- TABLE 90. INDIA UV CURABLE INK MARKET, BY END USE, 2021-2031 (TONS)
- TABLE 91. SOUTH KOREA UV CURABLE INK MARKET, BY TYPE, 2021-2031 ($MILLION)
- TABLE 92. SOUTH KOREA UV CURABLE INK MARKET, BY TYPE, 2021-2031 (TONS)
- TABLE 93. SOUTH KOREA UV CURABLE INK MARKET, BY END USE, 2021-2031 ($MILLION)
- TABLE 94. SOUTH KOREA UV CURABLE INK MARKET, BY END USE, 2021-2031 (TONS)
- TABLE 95. JAPAN UV CURABLE INK MARKET, BY TYPE, 2021-2031 ($MILLION)
- TABLE 96. JAPAN UV CURABLE INK MARKET, BY TYPE, 2021-2031 (TONS)
- TABLE 97. JAPAN UV CURABLE INK MARKET, BY END USE, 2021-2031 ($MILLION)
- TABLE 98. JAPAN UV CURABLE INK MARKET, BY END USE, 2021-2031 (TONS)
- TABLE 99. AUSTRALIA UV CURABLE INK MARKET, BY TYPE, 2021-2031 ($MILLION)
- TABLE 100. AUSTRALIA UV CURABLE INK MARKET, BY TYPE, 2021-2031 (TONS)
- TABLE 101. AUSTRALIA UV CURABLE INK MARKET, BY END USE, 2021-2031 ($MILLION)
- TABLE 102. AUSTRALIA UV CURABLE INK MARKET, BY END USE, 2021-2031 (TONS)
- TABLE 103. REST OF ASIA-PACIFIC UV CURABLE INK MARKET, BY TYPE, 2021-2031 ($MILLION)
- TABLE 104. REST OF ASIA-PACIFIC UV CURABLE INK MARKET, BY TYPE, 2021-2031 (TONS)
- TABLE 105. REST OF ASIA-PACIFIC UV CURABLE INK MARKET, BY END USE, 2021-2031 ($MILLION)
- TABLE 106. REST OF ASIA-PACIFIC UV CURABLE INK MARKET, BY END USE, 2021-2031 (TONS)
- TABLE 107. LAMEA UV CURABLE INK MARKET, BY TYPE, 2021-2031 ($MILLION)
- TABLE 108. LAMEA UV CURABLE INK MARKET, BY TYPE, 2021-2031 (TONS)
- TABLE 109. LAMEA UV CURABLE INK MARKET, BY END USE, 2021-2031 ($MILLION)
- TABLE 110. LAMEA UV CURABLE INK MARKET, BY END USE, 2021-2031 (TONS)
- TABLE 111. LAMEA UV CURABLE INK MARKET, BY COUNTRY, 2021-2031 ($MILLION)
- TABLE 112. LAMEA UV CURABLE INK MARKET, BY COUNTRY, 2021-2031 (TONS)
- TABLE 113. BRAZIL UV CURABLE INK MARKET, BY TYPE, 2021-2031 ($MILLION)
- TABLE 114. BRAZIL UV CURABLE INK MARKET, BY TYPE, 2021-2031 (TONS)
- TABLE 115. BRAZIL UV CURABLE INK MARKET, BY END USE, 2021-2031 ($MILLION)
- TABLE 116. BRAZIL UV CURABLE INK MARKET, BY END USE, 2021-2031 (TONS)
- TABLE 117. SOUTH AFRICA, UV CURABLE INK MARKET, BY TYPE, 2021-2031 ($MILLION)
- TABLE 118. SOUTH AFRICA, UV CURABLE INK MARKET, BY TYPE, 2021-2031 (TONS)
- TABLE 119. SOUTH AFRICA, UV CURABLE INK MARKET, BY END USE, 2021-2031 ($MILLION)
- TABLE 120. SOUTH AFRICA, UV CURABLE INK MARKET, BY END USE, 2021-2031 (TONS)
- TABLE 121. SAUDI ARABIA UV CURABLE INK MARKET, BY TYPE, 2021-2031 ($MILLION)
- TABLE 122. SAUDI ARABIA UV CURABLE INK MARKET, BY TYPE, 2021-2031 (TONS)
- TABLE 123. SAUDI ARABIA UV CURABLE INK MARKET, BY END USE, 2021-2031 ($MILLION)
- TABLE 124. SAUDI ARABIA UV CURABLE INK MARKET, BY END USE, 2021-2031 (TONS)
- TABLE 125. REST OF LAMEA UV CURABLE INK MARKET, BY TYPE, 2021-2031 ($MILLION)
- TABLE 126. REST OF LAMEA UV CURABLE INK MARKET, BY TYPE, 2021-2031 (TONS)
- TABLE 127. REST OF LAMEA UV CURABLE INK MARKET, BY END USE, 2021-2031 ($MILLION)
- TABLE 128. REST OF LAMEA UV CURABLE INK MARKET, BY END USE, 2021-2031 (TONS)
- TABLE 129. RUCO DRUCKFARBEN: KEY EXECUTIVES
- TABLE 130. RUCO DRUCKFARBEN: COMPANY SNAPSHOT
- TABLE 131. RUCO DRUCKFARBEN: PRODUCT SEGMENTS
- TABLE 132. RUCO DRUCKFARBEN: PRODUCT PORTFOLIO
- TABLE 133. FLINT GROUP: KEY EXECUTIVES
- TABLE 134. FLINT GROUP: COMPANY SNAPSHOT
- TABLE 135. FLINT GROUP: PRODUCT SEGMENTS
- TABLE 136. FLINT GROUP: PRODUCT PORTFOLIO
- TABLE 137. TOYO INK SC HOLDINGS CO., LTD: KEY EXECUTIVES
- TABLE 138. TOYO INK SC HOLDINGS CO., LTD: COMPANY SNAPSHOT
- TABLE 139. TOYO INK SC HOLDINGS CO., LTD: PRODUCT SEGMENTS
- TABLE 140. TOYO INK SC HOLDINGS CO., LTD: PRODUCT PORTFOLIO
- TABLE 141. GANS INK & SUPPLY CO.: KEY EXECUTIVES
- TABLE 142. GANS INK & SUPPLY CO.: COMPANY SNAPSHOT
- TABLE 143. GANS INK & SUPPLY CO.: PRODUCT SEGMENTS
- TABLE 144. GANS INK & SUPPLY CO.: PRODUCT PORTFOLIO
- TABLE 145. NUTEC DIGITAL INK PVT. LTD.: KEY EXECUTIVES
- TABLE 146. NUTEC DIGITAL INK PVT. LTD.: COMPANY SNAPSHOT
- TABLE 147. NUTEC DIGITAL INK PVT. LTD.: PRODUCT SEGMENTS
- TABLE 148. NUTEC DIGITAL INK PVT. LTD.: PRODUCT PORTFOLIO
- TABLE 149. NUTEC DIGITAL INK PVT. LTD.: KEY STRATERGIES
- TABLE 150. .KAO COLLINS CORPORATION: KEY EXECUTIVES
- TABLE 151. .KAO COLLINS CORPORATION: COMPANY SNAPSHOT
- TABLE 152. .KAO COLLINS CORPORATION: PRODUCT SEGMENTS
- TABLE 153. .KAO COLLINS CORPORATION: PRODUCT PORTFOLIO
- TABLE 154. MAXELL, LTD: KEY EXECUTIVES
- TABLE 155. MAXELL, LTD: COMPANY SNAPSHOT
- TABLE 156. MAXELL, LTD: PRODUCT SEGMENTS
- TABLE 157. MAXELL, LTD: PRODUCT PORTFOLIO
- TABLE 158. TEIKOKU PRINTING INKS MFG. CO., LTD: KEY EXECUTIVES
- TABLE 159. TEIKOKU PRINTING INKS MFG. CO., LTD: COMPANY SNAPSHOT
- TABLE 160. TEIKOKU PRINTING INKS MFG. CO., LTD: PRODUCT SEGMENTS
- TABLE 161. TEIKOKU PRINTING INKS MFG. CO., LTD: PRODUCT PORTFOLIO
- TABLE 162. TEIKOKU PRINTING INKS MFG. CO., LTD: KEY STRATERGIES
- TABLE 163. MARABU GMBH & CO. KG: KEY EXECUTIVES
- TABLE 164. MARABU GMBH & CO. KG: COMPANY SNAPSHOT
- TABLE 165. MARABU GMBH & CO. KG: PRODUCT SEGMENTS
- TABLE 166. MARABU GMBH & CO. KG: PRODUCT PORTFOLIO
- TABLE 167. SPINKS WORLD : KEY EXECUTIVES
- TABLE 168. SPINKS WORLD : COMPANY SNAPSHOT
- TABLE 169. SPINKS WORLD : PRODUCT SEGMENTS
- TABLE 170. SPINKS WORLD : PRODUCT PORTFOLIO
LIST OF FIGURES
- FIGURE 01. UV CURABLE INK MARKET, 2021-2031
- FIGURE 02. SEGMENTATION OF UV CURABLE INK MARKET, 2021-2031
- FIGURE 03. TOP INVESTMENT POCKETS IN UV CURABLE INK MARKET (2022-2031)
- FIGURE 04. LOW BARGAINING POWER OF SUPPLIERS
- FIGURE 05. LOW BARGAINING POWER OF BUYERS
- FIGURE 06. LOW THREAT OF SUBSTITUTES
- FIGURE 07. LOW THREAT OF NEW ENTRANTS
- FIGURE 08. LOW INTENSITY OF RIVALRY
- FIGURE 09. DRIVERS, RESTRAINTS AND OPPORTUNITIES: GLOBALUV CURABLE INK MARKET
- FIGURE 10. MARKET SHARE ANALYSIS: UV CURABLE INK MARKET
- FIGURE 11. PATENT ANALYSIS BY COMPANY
- FIGURE 12. PATENT ANALYSIS BY COUNTRY
- FIGURE 13. PRICING ANALYSIS: UV CURABLE INK MARKET 2021 AND 2031
- FIGURE 14. REGULATORY GUIDELINES: UV CURABLE INK MARKET
- FIGURE 15. VALUE CHAIN ANALYSIS: UV CURABLE INK MARKET
- FIGURE 16. UV CURABLE INK MARKET, BY TYPE, 2021(%)
- FIGURE 17. COMPARATIVE SHARE ANALYSIS OF UV CURABLE INK MARKET FOR OFFSET INK, BY COUNTRY 2021 AND 2031(%)
- FIGURE 18. COMPARATIVE SHARE ANALYSIS OF UV CURABLE INK MARKET FOR FLEXO INK, BY COUNTRY 2021 AND 2031(%)
- FIGURE 19. COMPARATIVE SHARE ANALYSIS OF UV CURABLE INK MARKET FOR SCREEN PRINTING, BY COUNTRY 2021 AND 2031(%)
- FIGURE 20. COMPARATIVE SHARE ANALYSIS OF UV CURABLE INK MARKET FOR DIGITAL PRINTING, BY COUNTRY 2021 AND 2031(%)
- FIGURE 21. COMPARATIVE SHARE ANALYSIS OF UV CURABLE INK MARKET FOR INKJET, BY COUNTRY 2021 AND 2031(%)
- FIGURE 22. COMPARATIVE SHARE ANALYSIS OF UV CURABLE INK MARKET FOR OTHERS, BY COUNTRY 2021 AND 2031(%)
- FIGURE 23. UV CURABLE INK MARKET, BY END USE, 2021(%)
- FIGURE 24. COMPARATIVE SHARE ANALYSIS OF UV CURABLE INK MARKET FOR AUTOMOBILE, BY COUNTRY 2021 AND 2031(%)
- FIGURE 25. COMPARATIVE SHARE ANALYSIS OF UV CURABLE INK MARKET FOR CONSUMER GOODS, BY COUNTRY 2021 AND 2031(%)
- FIGURE 26. COMPARATIVE SHARE ANALYSIS OF UV CURABLE INK MARKET FOR MEDICAL, BY COUNTRY 2021 AND 2031(%)
- FIGURE 27. COMPARATIVE SHARE ANALYSIS OF UV CURABLE INK MARKET FOR PUBLICATIONS AND PRINTING, BY COUNTRY 2021 AND 2031(%)
- FIGURE 28. COMPARATIVE SHARE ANALYSIS OF UV CURABLE INK MARKET FOR OTHERS, BY COUNTRY 2021 AND 2031(%)
- FIGURE 29. UV CURABLE INK MARKET BY REGION, 2021
- FIGURE 30. U.S. UV CURABLE INK MARKET, 2021-2031 ($MILLION)
- FIGURE 31. CANADA UV CURABLE INK MARKET, 2021-2031 ($MILLION)
- FIGURE 32. MEXICO UV CURABLE INK MARKET, 2021-2031 ($MILLION)
- FIGURE 33. GERMANY UV CURABLE INK MARKET, 2021-2031 ($MILLION)
- FIGURE 34. UK UV CURABLE INK MARKET, 2021-2031 ($MILLION)
- FIGURE 35. FRANCE UV CURABLE INK MARKET, 2021-2031 ($MILLION)
- FIGURE 36. ITALY UV CURABLE INK MARKET, 2021-2031 ($MILLION)
- FIGURE 37. SPAIN UV CURABLE INK MARKET, 2021-2031 ($MILLION)
- FIGURE 38. REST OF EUROPE UV CURABLE INK MARKET, 2021-2031 ($MILLION)
- FIGURE 39. CHINA UV CURABLE INK MARKET, 2021-2031 ($MILLION)
- FIGURE 40. INDIA UV CURABLE INK MARKET, 2021-2031 ($MILLION)
- FIGURE 41. SOUTH KOREA UV CURABLE INK MARKET, 2021-2031 ($MILLION)
- FIGURE 42. JAPAN UV CURABLE INK MARKET, 2021-2031 ($MILLION)
- FIGURE 43. AUSTRALIA UV CURABLE INK MARKET, 2021-2031 ($MILLION)
- FIGURE 44. REST OF ASIA-PACIFIC UV CURABLE INK MARKET, 2021-2031 ($MILLION)
- FIGURE 45. BRAZIL UV CURABLE INK MARKET, 2021-2031 ($MILLION)
- FIGURE 46. SOUTH AFRICA, UV CURABLE INK MARKET, 2021-2031 ($MILLION)
- FIGURE 47. SAUDI ARABIA UV CURABLE INK MARKET, 2021-2031 ($MILLION)
- FIGURE 48. REST OF LAMEA UV CURABLE INK MARKET, 2021-2031 ($MILLION)
- FIGURE 49. TOP WINNING STRATEGIES, BY YEAR
- FIGURE 50. TOP WINNING STRATEGIES, BY DEVELOPMENT
- FIGURE 51. TOP WINNING STRATEGIES, BY COMPANY
- FIGURE 52. PRODUCT MAPPING OF TOP 10 PLAYERS
- FIGURE 53. COMPETITIVE DASHBOARD
- FIGURE 54. COMPETITIVE HEATMAP: UV CURABLE INK MARKET
- FIGURE 55. TOP PLAYER POSITIONING, 2021
- FIGURE 56. MAXELL, LTD: NET REVENUE, 2020-2022 ($MILLION)
- FIGURE 57. MAXELL, LTD: REVENUE SHARE BY SEGMENT, 2022 (%)
- FIGURE 58. MAXELL, LTD: REVENUE SHARE BY REGION, 2022 (%)
- FIGURE 59. TEIKOKU PRINTING INKS MFG. CO., LTD: NET REVENUE, 2018-2020 ($MILLION)
- FIGURE 60. TEIKOKU PRINTING INKS MFG. CO., LTD: REVENUE SHARE BY SEGMENT, 2020 (%)
- FIGURE 61. TEIKOKU PRINTING INKS MFG. CO., LTD: REVENUE SHARE BY REGION, 2020 (%)


