


 |
市場調查報告書
商品編碼
1441696
貨運與物流:市場佔有率分析、產業趨勢與統計、成長預測(2024-2029)Freight and Logistics - Market Share Analysis, Industry Trends & Statistics, Growth Forecasts (2024 - 2029) |
||||||
價格
※ 本網頁內容可能與最新版本有所差異。詳細情況請與我們聯繫。
簡介目錄
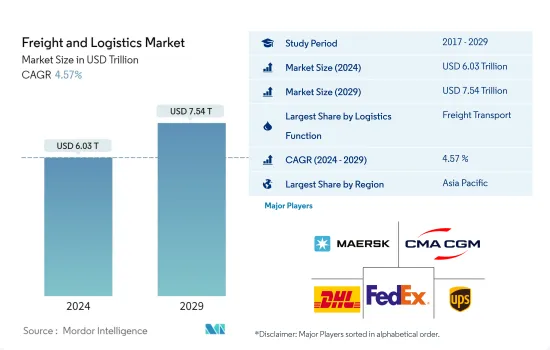
貨運和物流市場規模預計到 2024 年為 6.3 兆美元,預計到 2029 年將達到 7.54 兆美元,在預測期內(2024-2029 年)成長 4.57%。複合年成長率為
亞太地區引領全球機場基礎建設投資,其次是歐洲和美國
- 2020年,中國引領全球基礎設施支出,但到2022年5月,歐洲和美國在目前正在進行的最昂貴的基礎設施計劃中處於主導。截至2021年,美國擁有全世界最長的鐵路網,全長超過6萬公里,超過俄羅斯、中國和印度。
- 截至 2022 年 5 月,印度在建和計畫中的基礎設施計劃數量居世界首位,價值 2,500 萬美元。相較之下,美國有1,866個計劃,中國有1,175個計劃。美國加州高鐵計劃被公認為世界上最有價值的基礎建設計劃之一,截至2022年10月估計價值1,130億美元。鐵路線佔重大基礎設施計劃的很大一部分。目前正在開發中,不僅涵蓋日本,也涵蓋挪威、瑞典、英國、美國、亞洲以及東南亞各個地區。
- 截至2022年3月,亞太地區在建機場基礎建設計劃數量領先,總合230個計劃,包括跑道和航站樓等各種組件。這些計劃的總成本達2275億美元。緊隨其後的是歐洲,其在建機場基礎設施計劃數量位居第二,有 178 個在建計劃,總價值 1,090 億美元。然而,考慮到全球機場建設的總體支出,北美的總投資額為1,175億美元,略高於其他地區。
不確定性中蘊藏著巨大的可能性
- 亞太地區、北美和歐洲以及南美和海灣國家主導全球貨運和物流市場。 2022年全球卡車運輸量與前一年同期比較成長3.6%,但供應鏈瓶頸仍持續影響公路貨運。由於亞太和歐洲的大量投資,全球鐵路業在2020年和2022年分別成長1.6%和4.1%。預計到 2027 年,鐵路業的複合年成長率將達到 3%。烏克蘭戰爭和影響全球經濟成長的通膨上升可能會影響佔全球貿易貨運量 80% 的全球航運業。 2022年10月全球航空貨運需求與前一年同期比較%,但同月較上季成長3.5%。因此,經濟不確定性預計將影響預測期內的航空貨運需求。
- 在電子商務和製造業的推動下,到 2030 年,倉儲和物流庫存可能會加倍,達到 7 億平方英尺以上。 2022 年第三季度,該產業的租賃活動較上季成長 40%,達到 920 萬平方英尺。此外,由於電商熱潮,2021年13個主要國家的包裹量與前一年同期比較增加21%。預計2022年至2027年複合年成長率為8.5%。美國2021年收益最高,中國產生1,080億個小包裹。
- 物流中心,例如 2021 年啟用的巴林全球海空物流中心,有潛力提供具有成本效益且更快捷的貨物運輸。為了實現倉儲的升級和現代化,亞太地區 90% 的倉庫營運商正在投資下一代自動化技術,預計將在未來五年內向全球擴張。
全球貨運和物流市場趨勢
在投資增加的推動下,北美運輸和倉儲市場2022年成長21.35%,達到6,426億美元。
- 在亞太地區,運輸需求不斷增加,特別是在世界海上貿易中佔很大一部分的航運。該地區擁有全球最繁忙的 9 個貨櫃港口,佔全球陸路貨運量的 40% 以上。到 2050 年,該地區的貨運需求預計將增加兩倍。同時,德國已成為運輸和倉儲領域的領導者,進出口額位居世界第三,領先法國和英國。為了改善交通基礎設施,德國政府計劃在 2022 年之前在聯邦高速公路上投資超過 120 億歐元(128.1 億美元),在水道上投資約 18.1 億美元。
- 2022年全球外國直接投資(FDI)流量下降24%,至12,860億美元,不包括盧森堡,與前一年同期比較減5%。美國仍是最大的 FDI 流入來源國,收到 3,180 億美元,其次是中國,收到 1,800 億美元,但水準較低。儘管跨境併購(M&A)活動因交易數量下降而放緩,但待開發區投資的前景仍然樂觀。
- 由於對電子商務倉庫和配送中心的需求增加,北美的運輸和倉儲從 2021 年的同比 14.31% 顯著增長至 2022 年的同比 21.35%。 這一增長涵蓋了運輸的各個方面,總價值為6426億美元。 2022年,美國交通部推出了港口基礎設施發展計劃,向22個州的41個專案撥款超過7.03億美元,以改善港口功能、提高供應鏈可靠性並創造就業機會。
一年多來,俄羅斯入侵烏克蘭擾亂了全球原油和石油產品市場。
- 2022 年全球平均汽油價格為每公升 1.22 美元,較去年與前一年同期比較上漲 19%,高於感染疾病-19 之前的水準。繼2021年經濟復甦後,2022年因戰爭導致供應中斷的風險導致原油價格上漲,導致價格上漲。與其他地區相比,歐洲的汽油價格最高。冰島、挪威、丹麥、希臘、芬蘭和荷蘭的汽油特別昂貴,每加侖 7.6 美元。
- 布蘭特原油價格2022年上半年大幅上漲,但下半年整體下跌。 2022年布蘭特原油現貨價格平均為每桶100美元。 OPEC原油總產量從2022年第三季的平均每天2,920萬桶下降至2022年第四季的每天2,860萬桶。預計 2023 年 OPEC 原油產量平均為 2,890 萬桶/日。儘管全球需求繼續上升至接近歷史最高水平,但隨著俄羅斯和沙烏地阿拉伯繼續減產總合130 萬桶/日,油價已達到 11 月以來的最高點。
- 由於柴油是由原油生產的,因此原油價格與柴油價格密切相關。由於對全球柴油供應的擔憂,2022年春季美國和全球柴油價格快速上漲。儘管2022年下半年油價下跌,但由於季節性需求以及對歐洲柴油供應的擔憂,美國柴油期貨價格在2022年10月再次上漲至每加侖3.95美元。俄羅斯是歐洲最大的柴油供應國。 2023年,歐洲和美國的柴油價格都下跌,因為歐洲能夠用從其他地區進口的柴油來取代從俄羅斯進口的大部分柴油。
貨運及物流業概況
貨運物流市場較分散,前五名企業佔8.53%。該市場的主要企業包括 AP Moller-Maersk、CMA CGM、Deutsche Post DHL Group、FedEx、United Parcel Service(依字母順序排列)。
其他福利
- Excel 格式的市場預測 (ME) 表
- 3 個月分析師支持
目錄
第1章執行摘要和主要發現
第2章 提供報告
第3章簡介
- 研究假設和市場定義
- 調查範圍
- 調查方法
第4章 產業主要趨勢
- 人口統計
- 依經濟活動分類的 GDP 分佈
- 依經濟活動分類的 GDP 成長率
- 通貨膨脹
- 經濟表現和概況
- 電商產業趨勢
- 製造業趨勢
- 交通運輸倉儲業GDP
- 出口趨勢
- 進口趨勢
- 燃油價格
- 卡車運輸營運成本
- 依類型分類的卡車車隊規模
- 物流成果
- 主要卡車供應商
- 模態佔有率
- 海運船隊承載能力能力
- 班輪運輸連接
- 港口停靠和性能
- 貨運價格趨勢
- 貨物噸位趨勢
- 基礎設施
- 法律規範(公路和鐵路)
- 阿根廷
- 澳洲
- 巴西
- 加拿大
- 智利
- 中國
- 埃及
- 法國
- 德國
- 印度
- 印尼
- 義大利
- 日本
- 馬來西亞
- 墨西哥
- 荷蘭
- 奈及利亞
- 北歐的
- 卡達
- 俄羅斯
- 沙烏地阿拉伯
- 南非
- 西班牙
- 泰國
- 阿拉伯聯合大公國
- 英國
- 美國
- 越南
- 法律規範(海運和空運)
- 阿根廷
- 澳洲
- 巴西
- 加拿大
- 智利
- 中國
- 埃及
- 法國
- 德國
- 印度
- 印尼
- 義大利
- 日本
- 馬來西亞
- 墨西哥
- 荷蘭
- 奈及利亞
- 北歐的
- 卡達
- 俄羅斯
- 沙烏地阿拉伯
- 南非
- 西班牙
- 泰國
- 阿拉伯聯合大公國
- 英國
- 美國
- 越南
- 價值鍊和通路分析
第5章市場區隔(1.所有區隔市場的美元市場價值2.部分區隔市場規模、貨運、CEP(宅配、快捷郵件和小包裹)、倉儲和倉儲3.到2029年成長前景的預測和分析)
- 最終用戶產業
- 農業、漁業、林業
- 建造
- 製造業
- 石油和天然氣、採礦和採石業
- 批發零售業
- 其他
- 物流功能
- 宅配、快捷郵件、小包裹
- 依目的地類型
- 國內的
- 國際的
- 貨物運輸
- 透過交通工具
- 航空
- 海洋和內陸水道
- 其他
- 貨物運輸
- 透過交通工具
- 航空
- 管道
- 鐵路
- 路
- 海洋和內陸水道
- 倉儲及保管
- 溫度控制
- 非溫控
- 溫度控制
- 其他服務
- 宅配、快捷郵件、小包裹
- 地區
- 非洲
- 依國家/地區
- 埃及
- 奈及利亞
- 南非
- 其他
- 亞太地區
- 依國家/地區
- 澳洲
- 中國
- 印度
- 印尼
- 日本
- 馬來西亞
- 泰國
- 越南
- 其他
- 歐洲
- 依國家/地區
- 丹麥
- 芬蘭
- 法國
- 德國
- 冰島
- 義大利
- 荷蘭
- 挪威
- 俄羅斯
- 西班牙
- 瑞典
- 英國
- 其他
- GCC
- 依國家/地區
- 卡達
- 沙烏地阿拉伯
- 阿拉伯聯合大公國
- 其他
- 北美洲
- 依國家/地區
- 加拿大
- 墨西哥
- 美國
- 其他
- 南美洲
- 依國家/地區
- 阿根廷
- 巴西
- 智利
- 南美洲其他地區
- 世界其他地區
- 非洲
第6章 競爭形勢
- 重大策略舉措
- 市場佔有率分析
- 公司形勢
- 公司概況(包括全球概況、市場層級、核心業務部門、財務狀況、員工人數、關鍵資訊、市場排名、市場佔有率、產品和服務以及近期趨勢分析)。
- AP Moller-Maersk
- AllCargo Logistics Ltd
- Americold
- Aramex
- Bollore logistics
- CH Robinson
- CJ Logistics
- CMA CGM
- CTS Logistics Group
- Culina Group
- Dachser
- DB Schenker
- Deutsche Post DHL Group
- DP World
- DSV A/S(De Sammensluttede Vognmand af Air and Sea)
- Expeditors International
- FedEx
- GEODIS
- GXO Logistics
- Hellmann Worldwide Logistics
- Hub Group Inc
- International Distributions Services
- JBHunt Transport Services Inc.
- Japan Post Holdings Co., Ltd.
- JD Logistics
- Kerry Logistics
- Kintetsu World Express
- Kuehne+Nagel
- La Poste Group
- Landstar System Inc.
- LOGWIN
- LX International Corp
- Mainfreight
- NFI Industries
- Nippon Yusen Kabushiki Kaisha(NYK Line)
- Orient Overseas Container Line(OOCL Logistics)
- Penske Logistics
- Poste Italiane
- Ryder Systems
- Savino Del Bene
- SF Express
- Sinotrans Limited
- TIBA Group
- Total Quality Logistics
- Uber Technologies Inc
- United Parcel Service
- XPO Logistics
- Yamato Holdings
第7章 CEO 面臨的關鍵策略問題
第8章附錄
- 世界概況
- 來源和參考文獻
- 表格和圖形列表
- 重要見解
- 資料包
- 詞彙表
- 外匯
簡介目錄
Product Code: 48024
The Freight and Logistics Market size is estimated at USD 6.03 trillion in 2024, and is expected to reach USD 7.54 trillion by 2029, growing at a CAGR of 4.57% during the forecast period (2024-2029).
Asia-pacific leading the investment in airport infrastructure worldwide followed by Europe and United States
- In 2020, China led global infrastructure spending, but by May 2022, Europe and the United States had taken the lead in terms of the most costly infrastructure projects currently in progress. As of 2021, the United States boasted the world's longest railway network, surpassing Russia, China, and India, spanning over 60,000 kilometers.
- In May 2022, India led the global count with the highest number of ongoing or planned infrastructure projects, amounting to USD 25 million. Comparatively, the United States had 1,866 projects, while China had 1,175 projects. The project of the High-Speed Rail Line in California, USA, was identified as one of the most valuable infrastructure endeavors worldwide, with an estimated worth of USD 113 billion as of October 2022. Railway lines constituted a significant portion of the major infrastructure projects under development, encompassing countries such as Norway, Sweden, the United Kingdom, the United States, various regions in Asia and Southeast Asia, as well as Japan.
- In March 2022, the Asia-Pacific region led in terms of the number of airport infrastructure projects being constructed, with a total of 230 projects encompassing various components like runways and terminals. The combined value of these projects amounted to USD 227.5 billion. Following closely behind, Europe had the second-highest number of airport infrastructure projects under construction, with 178 ongoing projects valued at USD 109 billion. However, when considering the overall expenditure on airport construction worldwide, North America slightly surpassed the other regions, with a total investment of USD 117.5 billion.
Strong potential amidst uncertainties
- Asia-Pacific, North America, and Europe dominate the global freight and logistics market, along with South America and GCC. While global trucking volumes witnessed an increase of 3.6% YoY in 2022, supply chain bottlenecks continue to impact road freight transportation. Owing to significant investments in Asia-Pacific and Europe, the global rail industry witnessed a growth of 1.6% and 4.1%, respectively, in 2020 and 2022. The rail industry is expected to record a CAGR of 3% through 2027. The Russia-Ukraine war and soaring inflation impacting global growth can affect global shipping, which accounts for 80% of global trade transport. The demand for global air cargo fell by 13.6% YoY in October 2022 but recorded a 3.5% MoM increase in the same month. Hence, economic uncertainties are expected to impact the demand for air cargo during the forecast period.
- Driven by the e-commerce and manufacturing sectors, warehousing and logistics stock will likely double by 2030 to cross 700 million square feet. Leasing activity in the segment grew by 40% QoQ in Q3 2022 to amount to 9.2 million square feet. The e-commerce boom also fueled parcel volumes by 21% YoY in 2021 in 13 major economies. It is expected to record a CAGR of 8.5% through 2022-2027. The United States generated the highest revenue, while China generated 108 billion parcels in 2021.
- Logistics hubs, like Bahrain's Global Sea-to-Air Logistics Hub, launched in 2021, could provide cost-effective and faster freight transportation. In order to upgrade and modernize warehousing, 90% of Asia-Pacific warehouse operators are investing in next-gen automation tech, which is anticipated to boost the market globally in the next five years.
Global Freight and Logistics Market Trends
The North American transportation and storage market increased to 21.35% in 2022, valued at USD 642.60 billion, with investment boost
- Asia Pacific is experiencing increased demand for transportation, especially in shipping, which handles a significant portion of global seaborne trade. This region boasts nine of the world's busiest container ports and accounts for more than 40% of global surface freight transport. By 2050, freight transport demand in the region is projected to triple. Meanwhile, Germany has become a leader in the transportation and warehousing sector, surpassing France and the United Kingdom, ranking third globally in imports and exports. To improve transportation infrastructure, the German government plans to invest over EUR 12 billion (USD 12.81 billion) in federal highways and about USD 1.81 billion in waterways in 2022.
- Global foreign direct investment (FDI) flows in 2022 fell by 24%, totaling USD 1,286 billion, or a 5% decrease when excluding Luxembourg, compared to the previous year. The United States remained the top destination for FDI inflows, receiving USD 318 billion, followed by China with USD 180 billion, although at lower levels. Cross-border merger and acquisition (M&A) activity slowed down with fewer deals, while the outlook for greenfield investment remained positive.
- Transportation and storage in North America saw a significant growth boost, rising from 14.31% YoY in 2021 to 21.35% YoY in 2022, driven by increased demand for e-commerce warehousing and distribution centers. This growth encompassed various transportation facets, reaching a total value of USD 642.60 billion. In 2022, the US Department of Transportation introduced the Port Infrastructure Development Program, allocating more than USD 703 million for 41 projects in 22 states to improve port capabilities, enhance supply chain reliability, and create job opportunities.
For over a year, Russia's invasion of Ukraine, has disrupted global crude oil and petroleum product markets
- In 2022, the global average price of gasoline at the pump was 1.22 USD per litre, a 19% increase from the previous year, exceeding pre-COVID-19 levels. Following the 2021 rebound amid economic recovery, 2022 prices hiked following crude oil increase as a result of supply disruption risk amid war. Gasoline prices in Europe are the highest compared to other regions. Gasoline is particularly expensive in Iceland, Norway, Denmark, Greece, Finland, and the Netherlands at 7.6 USD per gallon.
- The Brent crude oil price rose significantly in the first half of 2022 but generally declined in the second half of the year. The Brent crude oil spot price averaged USD 100 per barrel in 2022. Total OPEC crude oil production fell from an average of 29.2 million b/d in Q3 2022 to 28.6 million b/d in Q4 2022. In 2023, OPEC crude oil production is expected to average 28.9 million barrels per day. Oil prices have peaked since last November as Russia and Saudi Arabia continue to cut a total of 1.3 million barrels a day from their output, even as global demand continues to rise to near-record levels.
- Diesel is produced from crude oil, so crude oil prices are closely linked to diesel prices. Diesel prices in the United States and globally increased rapidly in the spring of 2022 because of concerns about global diesel supply. Although crude oil prices declined in the second half of 2022, United States diesel futures prices rose again in October 2022 to USD 3.95 per gallon due to seasonal demand and diesel supply concerns for Europe. Russia has been Europe's largest supplier of diesel. In 2023, diesel prices have declined in both Europe and the United States as Europe has been able to replace most of the diesel it would have imported from Russia with imports from other regions.
Freight and Logistics Industry Overview
The Freight and Logistics Market is fragmented, with the top five companies occupying 8.53%. The major players in this market are A.P. Moller - Maersk, CMA CGM, Deutsche Post DHL Group, FedEx and United Parcel Service (sorted alphabetically).
Additional Benefits:
- The market estimate (ME) sheet in Excel format
- 3 months of analyst support
TABLE OF CONTENTS
1 EXECUTIVE SUMMARY & KEY FINDINGS
2 REPORT OFFERS
3 INTRODUCTION
- 3.1 Study Assumptions & Market Definition
- 3.2 Scope of the Study
- 3.3 Research Methodology
4 KEY INDUSTRY TRENDS
- 4.1 Demographics
- 4.2 GDP Distribution By Economic Activity
- 4.3 GDP Growth By Economic Activity
- 4.4 Inflation
- 4.5 Economic Performance And Profile
- 4.5.1 Trends in E-Commerce Industry
- 4.5.2 Trends in Manufacturing Industry
- 4.6 Transport And Storage Sector GDP
- 4.7 Export Trends
- 4.8 Import Trends
- 4.9 Fuel Price
- 4.10 Trucking Operational Costs
- 4.11 Trucking Fleet Size By Type
- 4.12 Logistics Performance
- 4.13 Major Truck Suppliers
- 4.14 Modal Share
- 4.15 Maritime Fleet Load Carrying Capacity
- 4.16 Liner Shipping Connectivity
- 4.17 Port Calls And Performance
- 4.18 Freight Pricing Trends
- 4.19 Freight Tonnage Trends
- 4.20 Infrastructure
- 4.21 Regulatory Framework (Road and Rail)
- 4.21.1 Argentina
- 4.21.2 Australia
- 4.21.3 Brazil
- 4.21.4 Canada
- 4.21.5 Chile
- 4.21.6 China
- 4.21.7 Egypt
- 4.21.8 France
- 4.21.9 Germany
- 4.21.10 India
- 4.21.11 Indonesia
- 4.21.12 Italy
- 4.21.13 Japan
- 4.21.14 Malaysia
- 4.21.15 Mexico
- 4.21.16 Netherlands
- 4.21.17 Nigeria
- 4.21.18 Nordics
- 4.21.19 Qatar
- 4.21.20 Russia
- 4.21.21 Saudi Arabia
- 4.21.22 South Africa
- 4.21.23 Spain
- 4.21.24 Thailand
- 4.21.25 UAE
- 4.21.26 United Kingdom
- 4.21.27 United States
- 4.21.28 Vietnam
- 4.22 Regulatory Framework (Sea and Air)
- 4.22.1 Argentina
- 4.22.2 Australia
- 4.22.3 Brazil
- 4.22.4 Canada
- 4.22.5 Chile
- 4.22.6 China
- 4.22.7 Egypt
- 4.22.8 France
- 4.22.9 Germany
- 4.22.10 India
- 4.22.11 Indonesia
- 4.22.12 Italy
- 4.22.13 Japan
- 4.22.14 Malaysia
- 4.22.15 Mexico
- 4.22.16 Netherlands
- 4.22.17 Nigeria
- 4.22.18 Nordics
- 4.22.19 Qatar
- 4.22.20 Russia
- 4.22.21 Saudi Arabia
- 4.22.22 South Africa
- 4.22.23 Spain
- 4.22.24 Thailand
- 4.22.25 UAE
- 4.22.26 United Kingdom
- 4.22.27 United States
- 4.22.28 Vietnam
- 4.23 Value Chain & Distribution Channel Analysis
5 MARKET SEGMENTATION (includes 1. Market value in USD for all segments 2. Market volume for select segments viz. freight transport, CEP (courier, express, and parcel) and warehousing & storage 3.Forecasts up to 2029 and analysis of growth prospects)
- 5.1 End User Industry
- 5.1.1 Agriculture, Fishing and Forestry
- 5.1.2 Construction
- 5.1.3 Manufacturing
- 5.1.4 Oil and Gas, Mining and Quarrying
- 5.1.5 Wholesale and Retail Trade
- 5.1.6 Others
- 5.2 Logistics Function
- 5.2.1 Courier, Express and Parcel
- 5.2.1.1 By Destination Type
- 5.2.1.1.1 Domestic
- 5.2.1.1.2 International
- 5.2.2 Freight Forwarding
- 5.2.2.1 By Mode Of Transport
- 5.2.2.1.1 Air
- 5.2.2.1.2 Sea and Inland Waterways
- 5.2.2.1.3 Others
- 5.2.3 Freight Transport
- 5.2.3.1 By Mode Of Transport
- 5.2.3.1.1 Air
- 5.2.3.1.2 Pipelines
- 5.2.3.1.3 Rail
- 5.2.3.1.4 Road
- 5.2.3.1.5 Sea and Inland Waterways
- 5.2.4 Warehousing and Storage
- 5.2.4.1 By Temperature Control
- 5.2.4.1.1 Non-Temperature Controlled
- 5.2.4.1.2 Temperature Controlled
- 5.2.5 Other Services
- 5.2.1 Courier, Express and Parcel
- 5.3 Region
- 5.3.1 Africa
- 5.3.1.1 By Country
- 5.3.1.1.1 Egypt
- 5.3.1.1.2 Nigeria
- 5.3.1.1.3 South Africa
- 5.3.1.1.4 Rest of Africa
- 5.3.2 Asia Pacific
- 5.3.2.1 By Country
- 5.3.2.1.1 Australia
- 5.3.2.1.2 China
- 5.3.2.1.3 India
- 5.3.2.1.4 Indonesia
- 5.3.2.1.5 Japan
- 5.3.2.1.6 Malaysia
- 5.3.2.1.7 Thailand
- 5.3.2.1.8 Vietnam
- 5.3.2.1.9 Rest of Asia Pacific
- 5.3.3 Europe
- 5.3.3.1 By Country
- 5.3.3.1.1 Denmark
- 5.3.3.1.2 Finland
- 5.3.3.1.3 France
- 5.3.3.1.4 Germany
- 5.3.3.1.5 Iceland
- 5.3.3.1.6 Italy
- 5.3.3.1.7 Netherlands
- 5.3.3.1.8 Norway
- 5.3.3.1.9 Russia
- 5.3.3.1.10 Spain
- 5.3.3.1.11 Sweden
- 5.3.3.1.12 United Kingdom
- 5.3.3.1.13 Rest of Europe
- 5.3.4 GCC
- 5.3.4.1 By Country
- 5.3.4.1.1 Qatar
- 5.3.4.1.2 Saudi Arabia
- 5.3.4.1.3 UAE
- 5.3.4.1.4 Rest of GCC
- 5.3.5 North America
- 5.3.5.1 By Country
- 5.3.5.1.1 Canada
- 5.3.5.1.2 Mexico
- 5.3.5.1.3 United States
- 5.3.5.1.4 Rest of North America
- 5.3.6 South America
- 5.3.6.1 By Country
- 5.3.6.1.1 Argentina
- 5.3.6.1.2 Brazil
- 5.3.6.1.3 Chile
- 5.3.6.1.4 Rest of South America
- 5.3.7 Rest of the World
- 5.3.1 Africa
6 COMPETITIVE LANDSCAPE
- 6.1 Key Strategic Moves
- 6.2 Market Share Analysis
- 6.3 Company Landscape
- 6.4 Company Profiles (includes Global Level Overview, Market Level Overview, Core Business Segments, Financials, Headcount, Key Information, Market Rank, Market Share, Products and Services, and Analysis of Recent Developments).
- 6.4.1 A.P. Moller - Maersk
- 6.4.2 AllCargo Logistics Ltd
- 6.4.3 Americold
- 6.4.4 Aramex
- 6.4.5 Bollore logistics
- 6.4.6 C.H Robinson
- 6.4.7 CJ Logistics
- 6.4.8 CMA CGM
- 6.4.9 CTS Logistics Group
- 6.4.10 Culina Group
- 6.4.11 Dachser
- 6.4.12 DB Schenker
- 6.4.13 Deutsche Post DHL Group
- 6.4.14 DP World
- 6.4.15 DSV A/S (De Sammensluttede Vognmand af Air and Sea)
- 6.4.16 Expeditors International
- 6.4.17 FedEx
- 6.4.18 GEODIS
- 6.4.19 GXO Logistics
- 6.4.20 Hellmann Worldwide Logistics
- 6.4.21 Hub Group Inc
- 6.4.22 International Distributions Services
- 6.4.23 J.B.Hunt Transport Services Inc.
- 6.4.24 Japan Post Holdings Co., Ltd.
- 6.4.25 JD Logistics
- 6.4.26 Kerry Logistics
- 6.4.27 Kintetsu World Express
- 6.4.28 Kuehne + Nagel
- 6.4.29 La Poste Group
- 6.4.30 Landstar System Inc.
- 6.4.31 LOGWIN
- 6.4.32 LX International Corp
- 6.4.33 Mainfreight
- 6.4.34 NFI Industries
- 6.4.35 Nippon Yusen Kabushiki Kaisha (NYK Line)
- 6.4.36 Orient Overseas Container Line (OOCL Logistics)
- 6.4.37 Penske Logistics
- 6.4.38 Poste Italiane
- 6.4.39 Ryder Systems
- 6.4.40 Savino Del Bene
- 6.4.41 SF Express
- 6.4.42 Sinotrans Limited
- 6.4.43 TIBA Group
- 6.4.44 Total Quality Logistics
- 6.4.45 Uber Technologies Inc
- 6.4.46 United Parcel Service
- 6.4.47 XPO Logistics
- 6.4.48 Yamato Holdings
7 KEY STRATEGIC QUESTIONS FOR FREIGHT AND LOGISTICS CEOS
8 APPENDIX
- 8.1 Global Overview
- 8.1.1 Overview
- 8.1.2 Porter's Five Forces Framework
- 8.1.3 Global Value Chain Analysis
- 8.1.4 Market Dynamics (Market Drivers, Restraints & Opportunities)
- 8.1.5 Technological Advancements
- 8.2 Sources & References
- 8.3 List of Tables & Figures
- 8.4 Primary Insights
- 8.5 Data Pack
- 8.6 Glossary of Terms
- 8.7 Currency Exchange Rate


