


 |
市場調查報告書
商品編碼
1438366
矽砂 - 市場佔有率分析、產業趨勢與統計、成長預測(2024 - 2029)Silica Sand - Market Share Analysis, Industry Trends & Statistics, Growth Forecasts (2024 - 2029) |
||||||
※ 本網頁內容可能與最新版本有所差異。詳細情況請與我們聯繫。
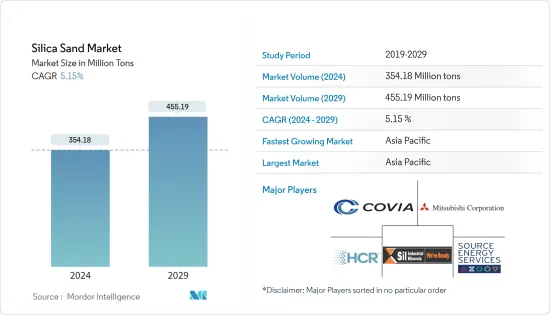
預計2024年矽砂市場規模為35,418萬噸,預估至2029年將達4,5519萬噸,在預測期內(2024-2029年)CAGR為5.15%。
由於 COVID-19,市場受到負面影響。受疫情影響,全球多個國家進入封鎖狀態,以遏止病毒傳播。眾多公司和工廠的關閉擾亂了全球供應網路,損害了全球生產、交貨計劃和產品銷售。目前,市場已從 COVID-19 大流行中恢復過來,並以顯著的速度成長。
主要亮點
- 從中期來看,推動市場成長的主要因素是鑄造業需求的成長和玻璃產業需求的成長。
- 另一方面,替代品的可用性以及對矽砂開採對環境影響的擔憂可能會限制市場成長。
- 不斷成長的水處理行業可能會成為未來幾年市場的機會。
- 亞太地區佔據了最高的市場佔有率,該地區很可能在預測期內主導市場。
矽砂市場趨勢
石油和天然氣產業將主導市場
- 在石油工業中,矽砂被稱為壓裂砂。二氧化矽的硬度在這裡很重要。由於其化學純度,它可以抵抗腐蝕性環境。其顆粒沉積物可最大限度地減少地層鑽屑,當泵入深井時,有助於提高石油流速。
- 矽砂,也稱為“壓裂砂”,來自於其在水力壓裂(“水力壓裂”)中的應用,這是石油和天然氣公司用來從非常規低滲透油藏生產天然氣、天然氣液體和石油的完井方法例如頁岩。
- 矽砂在壓裂頁岩以從岩石孔隙中釋放天然氣、石油和天然氣液體的過程中至關重要。當高壓水流迫使小穿孔變成更大的裂縫時,壓裂砂會使這些裂縫保持開放,以繼續釋放化石燃料。當使用白沙(或任何其他類型的天然或合成物質)來支撐這些裂縫時,它被稱為支撐劑。
- 當水泵關閉時,裂縫必須保持開啟狀態,這樣提取天然氣和石油的孔隙就不會收縮。這就是為什麼支撐劑必須盡可能耐用且抗壓碎。支撐劑能承受裂縫巨大壓力的時間越長。可以提取更多的石油,從而最大限度地提高油井的效率。
- 據國際能源總署稱,到 2026 年,全球石油消費量預計將達到 1.041 億桶/日。這將比目前的水平增加 4.4 兆桶/日。此外,國際能源總署預計,到 2023 年,全球石油需求將增加 1.9 mb/d,達到創紀錄的 101.7 mb/d,幾乎是中國解除新冠限制後增幅的一半。
- 到2025年,全球石油需求預計將成長5.7 mb/d(百萬桶/日),其中中國和印度約佔成長的一半。同時,全球石油產能預計將成長5.9 mb/d。隨著 OPEC 新增 1.4 mb/d 的原油和天然氣液體產能,非 OPEC(石油輸出國組織)的供應可能會增加 4.5 mb/d,這表明石油和天然氣行業研究市場的需求增加。
- 2022年北美原油和液體燃料總產量為2781萬桶/日,而2021年為2644萬桶/日。根據美國能源資訊署(EIA)的數據,2023年1月美國原油產量達到12,462千桶,而2022年12月的年產量為12,115千桶。美國是全球石油探勘領先的國家之一。非常規原油儲量,顯示該國所研究的市場存在巨大機會。
- 因此,由於上述幾點,石油和天然氣行業可能會主導市場,從而預計將在預測期內增加矽砂的需求。
亞太地區將主導市場
- 預計亞太地區將主導所研究的市場,中國和印度等主要經濟體將引領該地區的成長。
- 石油天然氣產業是中國矽砂最大的應用產業之一。過去二十年來,中國不斷投資擴大煉油能力,以適應不斷成長的經濟。而且,長期以來,中國各類原油的煉製能力不斷擴大。根據能源研究所預測,到2025年底,中國煉油產能可能達到2,000萬桶,將引發未來幾年對矽砂的需求。
- 此外,2022年1-2月,中國原油產量3,347萬噸,年增約4.6%。根據中國國家統計局統計,原油日產量近57.6萬噸。
- 玻璃製造業在中國正以最快的速度成長,同時玻璃在建築和汽車等多個產業的應用也越來越廣泛。根據中國國家統計局統計,2023年4月,中國生產鋼化玻璃約4,307萬平方公尺。此外,2022年,強化玻璃總產量近5.8億平方公尺。
- 截至2022年7月,聯合國估計印度目前人口超過14億人。快速的城市化和不斷成長的人口將在未來幾年增加石油需求。據印度品牌公平基金會 (IBEF) 稱,到 2045 年,印度的日產量可能會達到 1,100 萬桶。到 2029-30 年,柴油需求預計將加倍,達到 163 公噸。該國是世界第三大石油進口國,每年煉油量約2.49億噸,相當於每天500萬桶。未來五年,其煉油能力預計將攀升至每年2.98億噸。
- 此外,印度玻璃工業的成長主要是由建築業推動的。由於住宅建築專案對平板玻璃的需求不斷成長,建築和基礎設施行業在印度平板玻璃市場中佔有最高的市場佔有率。此外,這家位於印度的製造商正在大幅擴大其生產能力和產品組合。例如:
- 2022 年3 月,法國浮法玻璃製造商聖戈班投資50 億印度盧比(6,763 萬美元),在印度欽奈西斯里佩魯姆布杜爾的世界玻璃園區建設了一座新的浮法玻璃工廠和一條綜合窗戶生產線。
- 上述因素顯示亞太地區矽砂市場強勁的成長潛力。
矽砂產業概況
全球矽砂市場本質上是整合的。市場上一些主要的公司(排名不分先後)包括 Hi-Crush Inc.、Covia Holdings LLC、Source Energy Services、Mitsubishi Corporation 和 Sil Industrial Minerals 等。
額外的好處:
- Excel 格式的市場估算 (ME) 表
- 3 個月的分析師支持
目錄
第 1 章:簡介
- 研究假設
- 研究範圍
第 2 章:研究方法
第 3 章:執行摘要
第 4 章:市場動態
- 促進要素
- 鑄造業的需求不斷成長
- 玻璃產業不斷成長的需求
- 限制
- 替代品的可用性
- 非法採砂
- 對矽砂開採環境影響的擔憂
- 產業價值鏈分析
- 波特五力
- 供應商的議價能力
- 消費者的議價能力
- 新進入者的威脅
- 替代產品和服務的威脅
- 競爭程度
第 5 章:市場區隔(市場規模依數量計算)
- 最終用戶產業
- 玻璃製造
- 鑄造廠
- 化學品生產
- 建造
- 油漆和塗料
- 陶瓷及耐火材料
- 濾
- 油和氣
- 其他最終用戶產業
- 地理
- 亞太
- 中國
- 印度
- 日本
- 韓國
- 亞太其他地區
- 北美洲
- 美國
- 加拿大
- 墨西哥
- 歐洲
- 德國
- 英國
- 義大利
- 法國
- 歐洲其他地區
- 南美洲
- 巴西
- 阿根廷
- 南美洲其他地區
- 中東和非洲
- 沙烏地阿拉伯
- 南非
- 中東和非洲其他地區
- 亞太
第 6 章:競爭格局
- 併購、合資、合作與協議
- 市佔率(%)**/排名分析
- 領先企業採取的策略
- 公司簡介
- Badger Mining Corporation
- Chongqing Changjiang River Moulding Material Group Co. Ltd
- Covia Holdings LLC
- Euroquarz GmbH
- Hi-Crush Inc.
- JFE Mineral & Alloy Company Ltd
- Mitsubishi Corporation
- PUM GROUP
- Sibelco
- Sil Industrial Minerals
- Source Energy Services
- Superior Silica Sands
- Tochu Corporation
- US Silica
第 7 章:市場機會與未來趨勢
- 不斷發展的水處理產業
- 其他機會
The Silica Sand Market size is estimated at 354.18 Million tons in 2024, and is expected to reach 455.19 Million tons by 2029, growing at a CAGR of 5.15% during the forecast period (2024-2029).
The market was negatively impacted due to COVID-19. Owing to the pandemic, several countries worldwide went into lockdown to curb the spread of the virus. The shutdown of numerous companies and factories has disrupted worldwide supply networks and harmed global production, delivery schedules, and product sales. Currently, the market has recovered from the COVID-19 pandemic and increasing at a significant rate.
Key Highlights
- Over the medium term, the major factors driving the market growth are the increasing demand from the foundry industry and the growing demand from the glass industry.
- On the flip side, the availability of substitutes and concerns over the environmental impacts of silica sand mining is likely to restrain the market growth.
- The growing water treatment industry is likely to act as an opportunity for the market in the coming years.
- Asia-Pacific accounted for the highest market share, and the region is likely to dominate the market during the forecast period.
Silica Sand Market Trends
Oil and Gas Industry to Dominate the Market
- In the oil industry, silica sand is referred to as frac sand. The hardness of silica is important here. Because of its chemical purity, it can attack corrosive environments. Its granules deposit maximizes formation cuttings, and when pumped down in deep wells, it helps improve the oil flow rate.
- Silica sand, also known as "frac sand," comes from its use in hydraulic fracturing ("fracking"), a completion method used by oil and gas companies to produce natural gas, natural gas liquids, and oil from unconventional, low permeability reservoirs such as shale.
- Silica sand is essential in the process of fracturing shale to release natural gas, oil, and natural gas liquids from pores in the rock. When the high-pressure water stream forces the small perforations to become larger fractures, fracking sand keeps these fractures open to continue releasing fossil fuels. When white sand (or any other type of natural or synthetic substance) is used to prop open these fractures, it is referred to as a proppant.
- When the water pumps are turned off, the fractures must be kept open so the pores from which natural gas and oil are extracted do not deflate. That is why a proppant must be as durable and crush-resistant as possible. The longer the proppant can withstand the enormous pressure of the fractures. The more petroleum can be extracted, maximizing the well's efficiency.
- According to the International Energy Agency, global oil consumption is expected to reach 104.1 million barrels per day by 2026. This would be a 4.4 mb/d increase over current levels. Furthermore, the International Energy Agency projects that global oil demand will increase by 1.9 mb/d in 2023 to a record 101.7 mb/d, nearly half of the increase from China when its Covid limitations were lifted.
- The global oil demand is expected to rise by 5.7 mb/d (million barrels per day), with China and India accounting for about half of the growth by 2025. At the same time, the world's oil production capacity is expected to rise by 5.9 mb/d. Non-OPEC (Organization of the Petroleum Exporting Countries) supply is likely to increase by 4.5 mb/d as OPEC builds another 1.4 mb/d of crude and natural gas liquids capacity, indicating increased demand for the studied market in the oil and gas industry.
- The total production of crude oil and liquid fuels in North America in 2022 was 27.81 million barrels per day, while in 2021 was 26.44 million barrels per day. According to the US Energy Information Administration (EIA), crude oil production in the United States reached 12,462 thousand barrels in January 2023, compared to 12,115 thousand barrels annually in December 2022. The United States is one of the leading countries globally in the exploration of unconventional crude oil reserves, indicating a massive opportunity for the studied market in the country.
- Thus, due to the abovementioned points, the oil and gas industry is likely to dominate the market, which, in turn, is expected to enhance the demand for silica sand during the forecast period.
Asia-Pacific Region to Dominate Market
- The Asian-Pacific region is expected to dominate the studied market, with major economies like China and India leading the growth across the region.
- The oil and gas sector is one of the largest application industries for silica sand in China. China has invested to scale up its refining capacity over the past two decades to its growing economy. Moreover, for a long-term period, China has continuously expanded its refining capacity for all types of crudes. According to Institute for Energy Research, China is likely to register 20 million barrels of refining capacity at the end of 2025, which will trigger the demand for silica sand in the upcoming years.
- Moreover, the crude oil output of China has registered 33.47 million tons in the first two months of 2022, about 4.6% up from the same period of the previous year. According to the National Bureau of Statistics China, the daily output of crude oil is nearly 576,000 tons.
- The glass manufacturing industry is growing at the fastest rate in China, coupled with the growing adoption of glass in several industries, including construction and automotive. According to the National Bureau of Statistics of China, China produced approximately 43.07 million square meters of reinforced glass in April 2023. Additionally, in 2022, the total production of reinforced glass accounted for nearly 580 million square meters.
- As of July 2022, the United Nations has estimated the current population of India over 1.4 billion. Rapid urbanization and expanding population will raise oil demand in the upcoming years. According to India Brand Equity Foundation (IBEF), India will likely register 11 million barrels daily by 2045. Diesel demand is projected to be doubled to 163 MT by 2029-30. The country is the world's third-biggest oil importer and has a refining capacity of about 249 million tons annually, equivalent to 5 million barrels per day. Its refining capacity is expected to climb to 298 million tons annually over the next five years.
- Furthermore, the Indian glass industry's growth has been driven primarily by the construction sector. The construction and infrastructure industry holds the highest market share in the Indian flat glass market due to the growing demand for flat glass in residential building projects. Additionally, the manufacturer based in India is significantly expanding their production capacities and product portfolio. For instance:
- In March 2022, Saint-Gobain, a French manufacturer of float glass, invested INR 500 crore (USD 67.63 million) in a new float glass facility and an integrated window line at its World Glass Campus in Sriperumbudur, west of Chennai, India.
- The aforementioned factors indicate strong growth potential for the silica sand market in the Asian-Pacific region.
Silica Sand Industry Overview
The global silica sand market is consolidated in nature. Some of the major companies in the market (not in any particular order) include Hi-Crush Inc., Covia Holdings LLC, Source Energy Services, Mitsubishi Corporation, and Sil Industrial Minerals, among others.
Additional Benefits:
- The market estimate (ME) sheet in Excel format
- 3 months of analyst support
TABLE OF CONTENTS
1 INTRODUCTION
- 1.1 Study Assumptions
- 1.2 Scope of the Study
2 RESEARCH METHODOLOGY
3 EXECUTIVE SUMMARY
4 MARKET DYNAMICS
- 4.1 Drivers
- 4.1.1 Increasing Demand from the Foundry Industry
- 4.1.2 Growing Demand from the Glass Industry
- 4.2 Restraints
- 4.2.1 Availability of Substitutes
- 4.2.2 Illegal Mining of Sand
- 4.2.3 Concerns over Environmental Impacts of Silica Sand Mining
- 4.3 Industry Value Chain Analysis
- 4.4 Porter Five Forces
- 4.4.1 Bargaining Power of Suppliers
- 4.4.2 Bargaining Power of Consumers
- 4.4.3 Threat of New Entrants
- 4.4.4 Threat of Substitute Products and Services
- 4.4.5 Degree of Competition
5 MARKET SEGMENTATION (Market Size in Volume)
- 5.1 End-user Industry
- 5.1.1 Glass Manufacturing
- 5.1.2 Foundry
- 5.1.3 Chemical Production
- 5.1.4 Construction
- 5.1.5 Paints and Coatings
- 5.1.6 Ceramics and Refractories
- 5.1.7 Filtration
- 5.1.8 Oil and Gas
- 5.1.9 Other End-user Industries
- 5.2 Geography
- 5.2.1 Asia-Pacific
- 5.2.1.1 China
- 5.2.1.2 India
- 5.2.1.3 Japan
- 5.2.1.4 South Korea
- 5.2.1.5 Rest of Asia-Pacific
- 5.2.2 North America
- 5.2.2.1 United States
- 5.2.2.2 Canada
- 5.2.2.3 Mexico
- 5.2.3 Europe
- 5.2.3.1 Germany
- 5.2.3.2 United Kingdom
- 5.2.3.3 Italy
- 5.2.3.4 France
- 5.2.3.5 Rest of Europe
- 5.2.4 South America
- 5.2.4.1 Brazil
- 5.2.4.2 Argentina
- 5.2.4.3 Rest of South America
- 5.2.5 Middle East and Africa
- 5.2.5.1 Saudi Arabia
- 5.2.5.2 South Africa
- 5.2.5.3 Rest of Middle East and Africa
- 5.2.1 Asia-Pacific
6 COMPETITIVE LANDSCAPE
- 6.1 Mergers and Acquisitions, Joint Ventures, Collaborations, and Agreements
- 6.2 Market Share(%)**/Ranking Analysis
- 6.3 Strategies Adopted by Leading Players
- 6.4 Company Profiles
- 6.4.1 Badger Mining Corporation
- 6.4.2 Chongqing Changjiang River Moulding Material Group Co. Ltd
- 6.4.3 Covia Holdings LLC
- 6.4.4 Euroquarz GmbH
- 6.4.5 Hi-Crush Inc.
- 6.4.6 JFE Mineral & Alloy Company Ltd
- 6.4.7 Mitsubishi Corporation
- 6.4.8 PUM GROUP
- 6.4.9 Sibelco
- 6.4.10 Sil Industrial Minerals
- 6.4.11 Source Energy Services
- 6.4.12 Superior Silica Sands
- 6.4.13 Tochu Corporation
- 6.4.14 U.S. Silica
7 MARKET OPPORTUNITIES AND FUTURE TRENDS
- 7.1 Growing Water Treatment Industry
- 7.2 Other Opportunities
 全球二氧化矽市場規模、佔有率、成長分析,按類型、應用、最終用途 - 產業預測,2024-2031 年
 二氧化矽:市場佔有率分析、產業趨勢與統計、成長預測(2024-2029)
 2024-2032 年按最終用途(玻璃工業、鑄造、水力壓裂、過濾、磨料等)和地區分類的矽砂市場報告
 2024年矽砂世界市場報告
 全球矽砂市場 – 預測(截至 2030 年)
 矽砂市場 - 2018-2028 年全球產業規模、佔有率、趨勢、機會和預測,按等級、按應用、地區和競爭細分
 高純度矽砂的全球市場(2023年)
 洗砂機市場(類型:螺旋洗砂機和葉輪洗砂機)-2023-2031 年全球產業分析、規模、佔有率、成長、趨勢和預測
 清洗矽砂市場:按類型(混凝土砂、磚石砂、白砂)、按形狀(粗、細、中)、鐵含量、按用途- COVID-19、俄羅斯-烏克蘭衝突、高累積影響的累積 - 全球2023 -2030 年預測
 到2028年的矽砂市場預測——按子系統,按砂類型,按安全類型,按部署,按純度,按應用,按最終用戶,按地區進行的全球分析