


 |
市場調查報告書
商品編碼
1344499
噴墨打碼機市場:按類型、最終用戶劃分:2023-2032 年全球機會分析與產業預測Inkjet Coder Market By Type, By End-user : Global Opportunity Analysis and Industry Forecast, 2023-2032 |
||||||
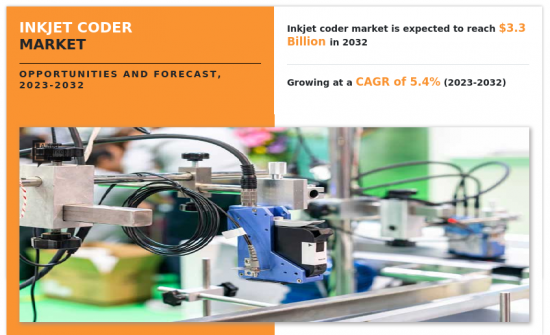
根據 Allied Market Research 發布的最新研究報告《噴墨打碼機市場》,2022 年噴墨打碼機市場價值將達到 20 億美元,2023 年至 2032 年複合年增長率為 5.4%,預計達到33億美元。
噴墨打碼機用於列印產品數據,包括產品概述。 這些印表機用於食品和飲料、製藥、化妝品、電子和汽車等各個行業,用於列印產品包裝上的詳細資訊。 噴墨噴碼的主要目的是為產品識別、可追溯性、法規遵循和品牌推廣目的提供關鍵資訊。
噴墨打碼是傳統標籤的替代方案。 噴墨噴碼將墨滴印到材料上,而不接觸物體表面。 該技術可在各種表面上進行列印,包括透明、無孔、光滑、粗糙、彎曲和凹面。 噴墨印刷是非接觸式的,因此只有墨水與產品或包裝的表面接觸,保持產品的清潔和穩定。 與標籤相比,噴墨噴碼的一大優點是成本。 比較標籤和熱轉印色帶的成本時,噴墨列印通常是標籤列印成本的 1/10。 所有這些因素預計將在未來幾年提高噴墨打碼機的市場份額。
噴墨打碼機需要定期維護以確保最佳效能。 維護包括清潔、印字頭維護和更換耗材。 如果沒有適當的維護,噴墨打碼機可能會遇到停機,從而影響生產計劃和效率。 雖然噴墨打碼機提供快速可靠的列印,但與雷射打碼機等其他列印技術相比,它們的列印解析度可能有限。 在某些需要高解析度列印的應用中,例如對小型複雜產品進行編碼或列印詳細圖形,這種限制可能會成為一個問題。
噴墨打碼機在提供準確、可見的編碼以追蹤和追蹤整個供應鏈中的產品方面可以發揮重要作用。 隨著法規和消費者對可追溯性的期望不斷提高,噴墨打碼機有很大的機會滿足這項需求並提供先進的打碼解決方案。 噴墨噴碼技術在新興國家和產業中具有巨大的發展潛力。 隨著這些市場的不斷發展,對打碼和標記解決方案的需求預計將會增加。 製藥、電子和汽車等行業以及製造業不斷發展的地區,為噴墨打碼機製造商提供了尚未開發的機會。 噴墨打碼機結構緊湊,旨在輕鬆整合到生產線和現有系統中。 它可以安裝在輸送機、包裝機和印刷站上,以實現無縫整合並最大限度地減少對生產過程的干擾。 噴墨打碼機通常配備使用者友善的介面和易於設定和操作的軟體。
COVID-19 大流行對噴墨打碼機市場產生了負面影響。 封鎖措施、社交距離要求和勞動力中斷給製造和生產設施帶來了重大挑戰。 噴墨打碼機製造商在維持正常生產水準、滿足交貨期限以及提供安裝和維護服務方面面臨挑戰。 這些中斷會導致延誤並降低生產力。 由於全球供應鏈中斷,包括原材料短缺和運輸成本增加,成本飆升。 由於原料、耗材和零件採購成本增加,噴墨打碼機製造商的獲利能力下降。
目錄
第1章簡介
第 2 章執行摘要
第3章市場概述
- 市場定義和範圍
- 主要發現
- 影響因素
- 主要投資機會
- 波特五力分析
- 市場動態
- 促進因素
- 抑制因素
- 機會
- 新冠肺炎 (COVID-19) 造成的市場影響分析
- 平均售價
- 品牌佔有率分析
- 主要監理分析
- 市佔率分析
- 專利情況
- 監理指南
- 貿易資料分析
- 價值鏈分析
第 4 章噴墨打碼機市場:依型別
- 連續噴墨打碼機
- 熱噴墨打碼機
- 按需滴墨式噴墨打碼機
- 其他
第 5 章噴墨打碼機市場:依最終用戶劃分
- 食品工業
- 醫藥行業
- 化妝品行業
- 電線、電纜、管道
- 汽車業
- 包裝行業
- 其他
第 6 章噴墨打碼機市場:依地區劃分
- 北美
- 美國
- 加拿大
- 墨西哥
- 歐洲
- 德國
- 英國
- 法國
- 西班牙
- 義大利
- 歐洲其他地區
- 亞太地區
- 中國
- 日本
- 印度
- 韓國
- 澳大利亞
- 其他亞太地區
- 拉丁美洲/中東/非洲
- 巴西
- 阿拉伯聯合大公國
- 沙烏地阿拉伯
- 南非
- 其他領域
第7章競爭態勢
- 簡介
- 關鍵成功策略
- 10家主要公司的產品圖譜
- 競爭對手儀表板
- 競爭熱圖
- 2022 年主要公司的定位
第8章公司簡介
- ANSER CODING INC.
- Hitachi Industrial Equipment Systems Co.,Ltd.
- Markem-Imaje S.A
- Videojet Technologies Inc.
- Domino Printing Sciences plc
- Control Print Ltd
- Shanghai Rottweil Handyware Printing Technology Co., Ltd
- Xaar plc
- MapleJet
- Linx Printing Technologies Limited
According to a new report published by Allied Market Research, titled, "Inkjet Coder Market," The inkjet coder market was valued at $2 billion in 2022, and is estimated to reach $3.3 billion by 2032, growing at a CAGR of 5.4% from 2023 to 2032.
Inkjet coders are used to print product data that include a summary of the product. These printers are used across various industrial verticals including food and beverage, pharmaceuticals, cosmetics, electronics, automotive, and others for printing details on the packaging section of the product. The primary purpose of inkjet coding is to provide essential information for product identification, traceability, regulatory compliance, and branding purposes.
Inkjet coding is an alternative to traditional labeling. Inkjet coding includes printing ink droplets onto a material without touching the object's surface. The technique can print on a wide range of surfaces, including transparent, non-porous, smooth, rough, curved, and concave surfaces. As inkjet printing is non-contact, only the ink contacts the surface of the item or packaging, and the product remains clean and stable. The major advantage of inkjet coding over labeling is cost. When the cost of the label and thermal transfer ribbons are compared, inkjet printing is typically one-tenth the cost of label printing. All these factors are anticipated to boost the inkjet coder market share in the upcoming years.
Inkjet coders require regular maintenance to ensure optimal performance. Maintenance activities include cleaning, printhead maintenance, and replacing worn-out components. If not properly maintained, inkjet coders can experience downtime, impacting production schedules and efficiency. While inkjet coders offer fast and reliable printing, they may have limitations in terms of printing resolution compared to other printing technologies such as laser coders. This limitation can be a concern for certain applications that require high-resolution printing, such as small and intricate product coding or printing of detailed graphics.
Inkjet coders can play a crucial role in providing accurate and visible coding for tracking and tracing products throughout the supply chain. As regulations and consumer expectations for traceability increase, there is a significant opportunity for inkjet coders to cater to this demand and provide advanced coding solutions. Inkjet coding technology offers the potential for significant expansion in emerging countries and emerging industries. . As these markets continue to develop, the demand for coding and marking solutions is expected to increase. Industries such as pharmaceuticals, electronics, and automotive, as well as regions with expanding manufacturing sectors, present untapped opportunities for inkjet coder manufacturers. Inkjet coders are compact and designed for easy integration into production lines or existing systems. They can be mounted on conveyors, packaging machines, or printing stations, allowing for seamless integration and minimal disruption to the production process. Inkjet coders often come with user-friendly interfaces and software for easy setup and operation.
The COVID-19 pandemic has had a negative impact on the inkjet coder market. Lockdown measures, social distancing requirements, and workforce disruptions caused significant challenges in manufacturing and production facilities. Inkjet coder manufacturers faced difficulties in maintaining normal production levels, meeting delivery timelines, and deploying installation and maintenance services. These disruptions led to delays and reduced productivity. Costs surged as a result of disruptions in the global supply chain, which included raw material shortages and higher transportation expenses. Manufacturers of inkjet coders saw lower profitability due to greater expenses for acquiring materials, consumables, and spare parts.
The key players profiled in this report include: ANSER CODING INC, Hitachi Industrial Equipment Systems Co.,Ltd, Markem-Imaje S.A, Videojet Technologies Inc, Domino Printing Sciences Plc, Control Print Limited, Shanghai Rottweil Handyware Printing Technology Co., Ltd, Xaar Plc, MapleJet, and Linx Printing Technologies. The market players are continuously striving to achieve a dominant position in this competitive market using strategies such as collaborations and acquisitions.
Key Benefits For Stakeholders
- This report provides a quantitative analysis of the market segments, current trends, estimations, and dynamics of the inkjet coder market analysis from 2022 to 2032 to identify the prevailing inkjet coder market opportunities.
- The market research is offered along with information related to key drivers, restraints, and opportunities.
- Porter's five forces analysis highlights the potency of buyers and suppliers to enable stakeholders make profit-oriented business decisions and strengthen their supplier-buyer network.
- In-depth analysis of the inkjet coder market segmentation assists to determine the prevailing market opportunities.
- Major countries in each region are mapped according to their revenue contribution to the global market.
- Market player positioning facilitates benchmarking and provides a clear understanding of the present position of the market players.
- The report includes the analysis of the regional as well as global inkjet coder market trends, key players, market segments, application areas, and market growth strategies.
Key Market Segments
By Type
- Continuous Inkjet Coder
- Thermal Inkjet Coder
- Drop on Demand Inkjet Coder
- Others
By End-user
- Food Industry
- Pharmaceutical Industry
- Cosmetic Industry
- Wires, Cables and Pipes
- Automobile Industry
- Packing Industry
- Others
By Region
- North America
- U.S.
- Canada
- Mexico
- Europe
- Germany
- UK
- France
- Spain
- Italy
- Rest of Europe
- Asia-Pacific
- China
- Japan
- India
- South Korea
- Australia
- Rest of Asia-Pacific
- LAMEA
- Brazil
- United Arab Emirates
- Saudi Arabia
- South Africa
- Rest of LAMEA
Key Market Players:
- ANSER CODING INC.
- Control Print Ltd
- Domino Printing Sciences plc
- Hitachi Industrial Equipment Systems Co.,Ltd.
- Linx Printing Technologies Limited
- MapleJet
- Markem-Imaje S.A
- Shanghai Rottweil Handyware Printing Technology Co., Ltd
- Videojet Technologies Inc.
- Xaar plc
TABLE OF CONTENTS
CHAPTER 1: INTRODUCTION
- 1.1. Report description
- 1.2. Key market segments
- 1.3. Key benefits to the stakeholders
- 1.4. Research Methodology
- 1.4.1. Primary research
- 1.4.2. Secondary research
- 1.4.3. Analyst tools and models
CHAPTER 2: EXECUTIVE SUMMARY
- 2.1. CXO Perspective
CHAPTER 3: MARKET OVERVIEW
- 3.1. Market definition and scope
- 3.2. Key findings
- 3.2.1. Top impacting factors
- 3.2.2. Top investment pockets
- 3.3. Porter's five forces analysis
- 3.4. Market dynamics
- 3.4.1. Drivers
- 3.4.2. Restraints
- 3.4.3. Opportunities
- 3.5. COVID-19 Impact Analysis on the market
- 3.6. Average Selling Price
- 3.7. Brand Share Analysis
- 3.8. Key Regulation Analysis
- 3.9. Market Share Analysis
- 3.10. Patent Landscape
- 3.11. Regulatory Guidelines
- 3.12. Trade Data Analysis
- 3.13. Value Chain Analysis
CHAPTER 4: INKJET CODER MARKET, BY TYPE
- 4.1. Overview
- 4.1.1. Market size and forecast
- 4.2. Continuous Inkjet Coder
- 4.2.1. Key market trends, growth factors and opportunities
- 4.2.2. Market size and forecast, by region
- 4.2.3. Market share analysis by country
- 4.3. Thermal Inkjet Coder
- 4.3.1. Key market trends, growth factors and opportunities
- 4.3.2. Market size and forecast, by region
- 4.3.3. Market share analysis by country
- 4.4. Drop on Demand Inkjet Coder
- 4.4.1. Key market trends, growth factors and opportunities
- 4.4.2. Market size and forecast, by region
- 4.4.3. Market share analysis by country
- 4.5. Others
- 4.5.1. Key market trends, growth factors and opportunities
- 4.5.2. Market size and forecast, by region
- 4.5.3. Market share analysis by country
CHAPTER 5: INKJET CODER MARKET, BY END-USER
- 5.1. Overview
- 5.1.1. Market size and forecast
- 5.2. Food Industry
- 5.2.1. Key market trends, growth factors and opportunities
- 5.2.2. Market size and forecast, by region
- 5.2.3. Market share analysis by country
- 5.3. Pharmaceutical Industry
- 5.3.1. Key market trends, growth factors and opportunities
- 5.3.2. Market size and forecast, by region
- 5.3.3. Market share analysis by country
- 5.4. Cosmetic Industry
- 5.4.1. Key market trends, growth factors and opportunities
- 5.4.2. Market size and forecast, by region
- 5.4.3. Market share analysis by country
- 5.5. Wires, Cables and Pipes
- 5.5.1. Key market trends, growth factors and opportunities
- 5.5.2. Market size and forecast, by region
- 5.5.3. Market share analysis by country
- 5.6. Automobile Industry
- 5.6.1. Key market trends, growth factors and opportunities
- 5.6.2. Market size and forecast, by region
- 5.6.3. Market share analysis by country
- 5.7. Packing Industry
- 5.7.1. Key market trends, growth factors and opportunities
- 5.7.2. Market size and forecast, by region
- 5.7.3. Market share analysis by country
- 5.8. Others
- 5.8.1. Key market trends, growth factors and opportunities
- 5.8.2. Market size and forecast, by region
- 5.8.3. Market share analysis by country
CHAPTER 6: INKJET CODER MARKET, BY REGION
- 6.1. Overview
- 6.1.1. Market size and forecast By Region
- 6.2. North America
- 6.2.1. Key trends and opportunities
- 6.2.2. Market size and forecast, by Type
- 6.2.3. Market size and forecast, by End-user
- 6.2.4. Market size and forecast, by country
- 6.2.4.1. U.S.
- 6.2.4.1.1. Key market trends, growth factors and opportunities
- 6.2.4.1.2. Market size and forecast, by Type
- 6.2.4.1.3. Market size and forecast, by End-user
- 6.2.4.2. Canada
- 6.2.4.2.1. Key market trends, growth factors and opportunities
- 6.2.4.2.2. Market size and forecast, by Type
- 6.2.4.2.3. Market size and forecast, by End-user
- 6.2.4.3. Mexico
- 6.2.4.3.1. Key market trends, growth factors and opportunities
- 6.2.4.3.2. Market size and forecast, by Type
- 6.2.4.3.3. Market size and forecast, by End-user
- 6.3. Europe
- 6.3.1. Key trends and opportunities
- 6.3.2. Market size and forecast, by Type
- 6.3.3. Market size and forecast, by End-user
- 6.3.4. Market size and forecast, by country
- 6.3.4.1. Germany
- 6.3.4.1.1. Key market trends, growth factors and opportunities
- 6.3.4.1.2. Market size and forecast, by Type
- 6.3.4.1.3. Market size and forecast, by End-user
- 6.3.4.2. UK
- 6.3.4.2.1. Key market trends, growth factors and opportunities
- 6.3.4.2.2. Market size and forecast, by Type
- 6.3.4.2.3. Market size and forecast, by End-user
- 6.3.4.3. France
- 6.3.4.3.1. Key market trends, growth factors and opportunities
- 6.3.4.3.2. Market size and forecast, by Type
- 6.3.4.3.3. Market size and forecast, by End-user
- 6.3.4.4. Spain
- 6.3.4.4.1. Key market trends, growth factors and opportunities
- 6.3.4.4.2. Market size and forecast, by Type
- 6.3.4.4.3. Market size and forecast, by End-user
- 6.3.4.5. Italy
- 6.3.4.5.1. Key market trends, growth factors and opportunities
- 6.3.4.5.2. Market size and forecast, by Type
- 6.3.4.5.3. Market size and forecast, by End-user
- 6.3.4.6. Rest of Europe
- 6.3.4.6.1. Key market trends, growth factors and opportunities
- 6.3.4.6.2. Market size and forecast, by Type
- 6.3.4.6.3. Market size and forecast, by End-user
- 6.4. Asia-Pacific
- 6.4.1. Key trends and opportunities
- 6.4.2. Market size and forecast, by Type
- 6.4.3. Market size and forecast, by End-user
- 6.4.4. Market size and forecast, by country
- 6.4.4.1. China
- 6.4.4.1.1. Key market trends, growth factors and opportunities
- 6.4.4.1.2. Market size and forecast, by Type
- 6.4.4.1.3. Market size and forecast, by End-user
- 6.4.4.2. Japan
- 6.4.4.2.1. Key market trends, growth factors and opportunities
- 6.4.4.2.2. Market size and forecast, by Type
- 6.4.4.2.3. Market size and forecast, by End-user
- 6.4.4.3. India
- 6.4.4.3.1. Key market trends, growth factors and opportunities
- 6.4.4.3.2. Market size and forecast, by Type
- 6.4.4.3.3. Market size and forecast, by End-user
- 6.4.4.4. South Korea
- 6.4.4.4.1. Key market trends, growth factors and opportunities
- 6.4.4.4.2. Market size and forecast, by Type
- 6.4.4.4.3. Market size and forecast, by End-user
- 6.4.4.5. Australia
- 6.4.4.5.1. Key market trends, growth factors and opportunities
- 6.4.4.5.2. Market size and forecast, by Type
- 6.4.4.5.3. Market size and forecast, by End-user
- 6.4.4.6. Rest of Asia-Pacific
- 6.4.4.6.1. Key market trends, growth factors and opportunities
- 6.4.4.6.2. Market size and forecast, by Type
- 6.4.4.6.3. Market size and forecast, by End-user
- 6.5. LAMEA
- 6.5.1. Key trends and opportunities
- 6.5.2. Market size and forecast, by Type
- 6.5.3. Market size and forecast, by End-user
- 6.5.4. Market size and forecast, by country
- 6.5.4.1. Brazil
- 6.5.4.1.1. Key market trends, growth factors and opportunities
- 6.5.4.1.2. Market size and forecast, by Type
- 6.5.4.1.3. Market size and forecast, by End-user
- 6.5.4.2. United Arab Emirates
- 6.5.4.2.1. Key market trends, growth factors and opportunities
- 6.5.4.2.2. Market size and forecast, by Type
- 6.5.4.2.3. Market size and forecast, by End-user
- 6.5.4.3. Saudi Arabia
- 6.5.4.3.1. Key market trends, growth factors and opportunities
- 6.5.4.3.2. Market size and forecast, by Type
- 6.5.4.3.3. Market size and forecast, by End-user
- 6.5.4.4. South Africa
- 6.5.4.4.1. Key market trends, growth factors and opportunities
- 6.5.4.4.2. Market size and forecast, by Type
- 6.5.4.4.3. Market size and forecast, by End-user
- 6.5.4.5. Rest of LAMEA
- 6.5.4.5.1. Key market trends, growth factors and opportunities
- 6.5.4.5.2. Market size and forecast, by Type
- 6.5.4.5.3. Market size and forecast, by End-user
CHAPTER 7: COMPETITIVE LANDSCAPE
- 7.1. Introduction
- 7.2. Top winning strategies
- 7.3. Product Mapping of Top 10 Player
- 7.4. Competitive Dashboard
- 7.5. Competitive Heatmap
- 7.6. Top player positioning, 2022
CHAPTER 8: COMPANY PROFILES
- 8.1. ANSER CODING INC.
- 8.1.1. Company overview
- 8.1.2. Key Executives
- 8.1.3. Company snapshot
- 8.2. Hitachi Industrial Equipment Systems Co.,Ltd.
- 8.2.1. Company overview
- 8.2.2. Key Executives
- 8.2.3. Company snapshot
- 8.3. Markem-Imaje S.A
- 8.3.1. Company overview
- 8.3.2. Key Executives
- 8.3.3. Company snapshot
- 8.4. Videojet Technologies Inc.
- 8.4.1. Company overview
- 8.4.2. Key Executives
- 8.4.3. Company snapshot
- 8.5. Domino Printing Sciences plc
- 8.5.1. Company overview
- 8.5.2. Key Executives
- 8.5.3. Company snapshot
- 8.6. Control Print Ltd
- 8.6.1. Company overview
- 8.6.2. Key Executives
- 8.6.3. Company snapshot
- 8.7. Shanghai Rottweil Handyware Printing Technology Co., Ltd
- 8.7.1. Company overview
- 8.7.2. Key Executives
- 8.7.3. Company snapshot
- 8.8. Xaar plc
- 8.8.1. Company overview
- 8.8.2. Key Executives
- 8.8.3. Company snapshot
- 8.9. MapleJet
- 8.9.1. Company overview
- 8.9.2. Key Executives
- 8.9.3. Company snapshot
- 8.10. Linx Printing Technologies Limited
- 8.10.1. Company overview
- 8.10.2. Key Executives
- 8.10.3. Company snapshot
LIST OF TABLES
- TABLE 01. GLOBAL INKJET CODER MARKET, BY TYPE, 2022-2032 ($MILLION)
- TABLE 02. INKJET CODER MARKET FOR CONTINUOUS INKJET CODER, BY REGION, 2022-2032 ($MILLION)
- TABLE 03. INKJET CODER MARKET FOR THERMAL INKJET CODER, BY REGION, 2022-2032 ($MILLION)
- TABLE 04. INKJET CODER MARKET FOR DROP ON DEMAND INKJET CODER, BY REGION, 2022-2032 ($MILLION)
- TABLE 05. INKJET CODER MARKET FOR OTHERS, BY REGION, 2022-2032 ($MILLION)
- TABLE 06. GLOBAL INKJET CODER MARKET, BY END-USER, 2022-2032 ($MILLION)
- TABLE 07. INKJET CODER MARKET FOR FOOD INDUSTRY, BY REGION, 2022-2032 ($MILLION)
- TABLE 08. INKJET CODER MARKET FOR PHARMACEUTICAL INDUSTRY, BY REGION, 2022-2032 ($MILLION)
- TABLE 09. INKJET CODER MARKET FOR COSMETIC INDUSTRY, BY REGION, 2022-2032 ($MILLION)
- TABLE 10. INKJET CODER MARKET FOR WIRES, CABLES AND PIPES, BY REGION, 2022-2032 ($MILLION)
- TABLE 11. INKJET CODER MARKET FOR AUTOMOBILE INDUSTRY, BY REGION, 2022-2032 ($MILLION)
- TABLE 12. INKJET CODER MARKET FOR PACKING INDUSTRY, BY REGION, 2022-2032 ($MILLION)
- TABLE 13. INKJET CODER MARKET FOR OTHERS, BY REGION, 2022-2032 ($MILLION)
- TABLE 14. INKJET CODER MARKET, BY REGION, 2022-2032 ($MILLION)
- TABLE 15. NORTH AMERICA INKJET CODER MARKET, BY TYPE, 2022-2032 ($MILLION)
- TABLE 16. NORTH AMERICA INKJET CODER MARKET, BY END-USER, 2022-2032 ($MILLION)
- TABLE 17. NORTH AMERICA INKJET CODER MARKET, BY COUNTRY, 2022-2032 ($MILLION)
- TABLE 18. U.S. INKJET CODER MARKET, BY TYPE, 2022-2032 ($MILLION)
- TABLE 19. U.S. INKJET CODER MARKET, BY END-USER, 2022-2032 ($MILLION)
- TABLE 20. CANADA INKJET CODER MARKET, BY TYPE, 2022-2032 ($MILLION)
- TABLE 21. CANADA INKJET CODER MARKET, BY END-USER, 2022-2032 ($MILLION)
- TABLE 22. MEXICO INKJET CODER MARKET, BY TYPE, 2022-2032 ($MILLION)
- TABLE 23. MEXICO INKJET CODER MARKET, BY END-USER, 2022-2032 ($MILLION)
- TABLE 24. EUROPE INKJET CODER MARKET, BY TYPE, 2022-2032 ($MILLION)
- TABLE 25. EUROPE INKJET CODER MARKET, BY END-USER, 2022-2032 ($MILLION)
- TABLE 26. EUROPE INKJET CODER MARKET, BY COUNTRY, 2022-2032 ($MILLION)
- TABLE 27. GERMANY INKJET CODER MARKET, BY TYPE, 2022-2032 ($MILLION)
- TABLE 28. GERMANY INKJET CODER MARKET, BY END-USER, 2022-2032 ($MILLION)
- TABLE 29. UK INKJET CODER MARKET, BY TYPE, 2022-2032 ($MILLION)
- TABLE 30. UK INKJET CODER MARKET, BY END-USER, 2022-2032 ($MILLION)
- TABLE 31. FRANCE INKJET CODER MARKET, BY TYPE, 2022-2032 ($MILLION)
- TABLE 32. FRANCE INKJET CODER MARKET, BY END-USER, 2022-2032 ($MILLION)
- TABLE 33. SPAIN INKJET CODER MARKET, BY TYPE, 2022-2032 ($MILLION)
- TABLE 34. SPAIN INKJET CODER MARKET, BY END-USER, 2022-2032 ($MILLION)
- TABLE 35. ITALY INKJET CODER MARKET, BY TYPE, 2022-2032 ($MILLION)
- TABLE 36. ITALY INKJET CODER MARKET, BY END-USER, 2022-2032 ($MILLION)
- TABLE 37. REST OF EUROPE INKJET CODER MARKET, BY TYPE, 2022-2032 ($MILLION)
- TABLE 38. REST OF EUROPE INKJET CODER MARKET, BY END-USER, 2022-2032 ($MILLION)
- TABLE 39. ASIA-PACIFIC INKJET CODER MARKET, BY TYPE, 2022-2032 ($MILLION)
- TABLE 40. ASIA-PACIFIC INKJET CODER MARKET, BY END-USER, 2022-2032 ($MILLION)
- TABLE 41. ASIA-PACIFIC INKJET CODER MARKET, BY COUNTRY, 2022-2032 ($MILLION)
- TABLE 42. CHINA INKJET CODER MARKET, BY TYPE, 2022-2032 ($MILLION)
- TABLE 43. CHINA INKJET CODER MARKET, BY END-USER, 2022-2032 ($MILLION)
- TABLE 44. JAPAN INKJET CODER MARKET, BY TYPE, 2022-2032 ($MILLION)
- TABLE 45. JAPAN INKJET CODER MARKET, BY END-USER, 2022-2032 ($MILLION)
- TABLE 46. INDIA INKJET CODER MARKET, BY TYPE, 2022-2032 ($MILLION)
- TABLE 47. INDIA INKJET CODER MARKET, BY END-USER, 2022-2032 ($MILLION)
- TABLE 48. SOUTH KOREA INKJET CODER MARKET, BY TYPE, 2022-2032 ($MILLION)
- TABLE 49. SOUTH KOREA INKJET CODER MARKET, BY END-USER, 2022-2032 ($MILLION)
- TABLE 50. AUSTRALIA INKJET CODER MARKET, BY TYPE, 2022-2032 ($MILLION)
- TABLE 51. AUSTRALIA INKJET CODER MARKET, BY END-USER, 2022-2032 ($MILLION)
- TABLE 52. REST OF ASIA-PACIFIC INKJET CODER MARKET, BY TYPE, 2022-2032 ($MILLION)
- TABLE 53. REST OF ASIA-PACIFIC INKJET CODER MARKET, BY END-USER, 2022-2032 ($MILLION)
- TABLE 54. LAMEA INKJET CODER MARKET, BY TYPE, 2022-2032 ($MILLION)
- TABLE 55. LAMEA INKJET CODER MARKET, BY END-USER, 2022-2032 ($MILLION)
- TABLE 56. LAMEA INKJET CODER MARKET, BY COUNTRY, 2022-2032 ($MILLION)
- TABLE 57. BRAZIL INKJET CODER MARKET, BY TYPE, 2022-2032 ($MILLION)
- TABLE 58. BRAZIL INKJET CODER MARKET, BY END-USER, 2022-2032 ($MILLION)
- TABLE 59. UNITED ARAB EMIRATES INKJET CODER MARKET, BY TYPE, 2022-2032 ($MILLION)
- TABLE 60. UNITED ARAB EMIRATES INKJET CODER MARKET, BY END-USER, 2022-2032 ($MILLION)
- TABLE 61. SAUDI ARABIA INKJET CODER MARKET, BY TYPE, 2022-2032 ($MILLION)
- TABLE 62. SAUDI ARABIA INKJET CODER MARKET, BY END-USER, 2022-2032 ($MILLION)
- TABLE 63. SOUTH AFRICA INKJET CODER MARKET, BY TYPE, 2022-2032 ($MILLION)
- TABLE 64. SOUTH AFRICA INKJET CODER MARKET, BY END-USER, 2022-2032 ($MILLION)
- TABLE 65. REST OF LAMEA INKJET CODER MARKET, BY TYPE, 2022-2032 ($MILLION)
- TABLE 66. REST OF LAMEA INKJET CODER MARKET, BY END-USER, 2022-2032 ($MILLION)
- TABLE 67. ANSER CODING INC.: KEY EXECUTIVES
- TABLE 68. ANSER CODING INC.: COMPANY SNAPSHOT
- TABLE 69. HITACHI INDUSTRIAL EQUIPMENT SYSTEMS CO.,LTD.: KEY EXECUTIVES
- TABLE 70. HITACHI INDUSTRIAL EQUIPMENT SYSTEMS CO.,LTD.: COMPANY SNAPSHOT
- TABLE 71. MARKEM-IMAJE S.A: KEY EXECUTIVES
- TABLE 72. MARKEM-IMAJE S.A: COMPANY SNAPSHOT
- TABLE 73. VIDEOJET TECHNOLOGIES INC.: KEY EXECUTIVES
- TABLE 74. VIDEOJET TECHNOLOGIES INC.: COMPANY SNAPSHOT
- TABLE 75. DOMINO PRINTING SCIENCES PLC: KEY EXECUTIVES
- TABLE 76. DOMINO PRINTING SCIENCES PLC: COMPANY SNAPSHOT
- TABLE 77. CONTROL PRINT LTD: KEY EXECUTIVES
- TABLE 78. CONTROL PRINT LTD: COMPANY SNAPSHOT
- TABLE 79. SHANGHAI ROTTWEIL HANDYWARE PRINTING TECHNOLOGY CO., LTD: KEY EXECUTIVES
- TABLE 80. SHANGHAI ROTTWEIL HANDYWARE PRINTING TECHNOLOGY CO., LTD: COMPANY SNAPSHOT
- TABLE 81. XAAR PLC: KEY EXECUTIVES
- TABLE 82. XAAR PLC: COMPANY SNAPSHOT
- TABLE 83. MAPLEJET: KEY EXECUTIVES
- TABLE 84. MAPLEJET: COMPANY SNAPSHOT
- TABLE 85. LINX PRINTING TECHNOLOGIES LIMITED: KEY EXECUTIVES
- TABLE 86. LINX PRINTING TECHNOLOGIES LIMITED: COMPANY SNAPSHOT
LIST OF FIGURES
- FIGURE 01. INKJET CODER MARKET, 2022-2032
- FIGURE 02. SEGMENTATION OF INKJET CODER MARKET, 2022-2032
- FIGURE 03. TOP INVESTMENT POCKETS IN INKJET CODER MARKET (2023-2032)
- FIGURE 04. PORTER FIVE-1
- FIGURE 05. PORTER FIVE-2
- FIGURE 06. PORTER FIVE-3
- FIGURE 07. PORTER FIVE-4
- FIGURE 08. PORTER FIVE-5
- FIGURE 09. DRIVERS, RESTRAINTS AND OPPORTUNITIES: GLOBALINKJET CODER MARKET
- FIGURE 10. IMPACT OF KEY REGULATION: INKJET CODER MARKET
- FIGURE 11. MARKET SHARE ANALYSIS: INKJET CODER MARKET
- FIGURE 12. PATENT ANALYSIS BY COMPANY
- FIGURE 13. PATENT ANALYSIS BY COUNTRY
- FIGURE 14. REGULATORY GUIDELINES: INKJET CODER MARKET
- FIGURE 16. VALUE CHAIN ANALYSIS: INKJET CODER MARKET
- FIGURE 17. INKJET CODER MARKET, BY TYPE, 2022(%)
- FIGURE 18. COMPARATIVE SHARE ANALYSIS OF INKJET CODER MARKET FOR CONTINUOUS INKJET CODER, BY COUNTRY 2022 AND 2032(%)
- FIGURE 19. COMPARATIVE SHARE ANALYSIS OF INKJET CODER MARKET FOR THERMAL INKJET CODER, BY COUNTRY 2022 AND 2032(%)
- FIGURE 20. COMPARATIVE SHARE ANALYSIS OF INKJET CODER MARKET FOR DROP ON DEMAND INKJET CODER, BY COUNTRY 2022 AND 2032(%)
- FIGURE 21. COMPARATIVE SHARE ANALYSIS OF INKJET CODER MARKET FOR OTHERS, BY COUNTRY 2022 AND 2032(%)
- FIGURE 22. INKJET CODER MARKET, BY END-USER, 2022(%)
- FIGURE 23. COMPARATIVE SHARE ANALYSIS OF INKJET CODER MARKET FOR FOOD INDUSTRY, BY COUNTRY 2022 AND 2032(%)
- FIGURE 24. COMPARATIVE SHARE ANALYSIS OF INKJET CODER MARKET FOR PHARMACEUTICAL INDUSTRY, BY COUNTRY 2022 AND 2032(%)
- FIGURE 25. COMPARATIVE SHARE ANALYSIS OF INKJET CODER MARKET FOR COSMETIC INDUSTRY, BY COUNTRY 2022 AND 2032(%)
- FIGURE 26. COMPARATIVE SHARE ANALYSIS OF INKJET CODER MARKET FOR WIRES, CABLES AND PIPES, BY COUNTRY 2022 AND 2032(%)
- FIGURE 27. COMPARATIVE SHARE ANALYSIS OF INKJET CODER MARKET FOR AUTOMOBILE INDUSTRY, BY COUNTRY 2022 AND 2032(%)
- FIGURE 28. COMPARATIVE SHARE ANALYSIS OF INKJET CODER MARKET FOR PACKING INDUSTRY, BY COUNTRY 2022 AND 2032(%)
- FIGURE 29. COMPARATIVE SHARE ANALYSIS OF INKJET CODER MARKET FOR OTHERS, BY COUNTRY 2022 AND 2032(%)
- FIGURE 30. INKJET CODER MARKET BY REGION, 2022
- FIGURE 31. U.S. INKJET CODER MARKET, 2022-2032 ($MILLION)
- FIGURE 32. CANADA INKJET CODER MARKET, 2022-2032 ($MILLION)
- FIGURE 33. MEXICO INKJET CODER MARKET, 2022-2032 ($MILLION)
- FIGURE 34. GERMANY INKJET CODER MARKET, 2022-2032 ($MILLION)
- FIGURE 35. UK INKJET CODER MARKET, 2022-2032 ($MILLION)
- FIGURE 36. FRANCE INKJET CODER MARKET, 2022-2032 ($MILLION)
- FIGURE 37. SPAIN INKJET CODER MARKET, 2022-2032 ($MILLION)
- FIGURE 38. ITALY INKJET CODER MARKET, 2022-2032 ($MILLION)
- FIGURE 39. REST OF EUROPE INKJET CODER MARKET, 2022-2032 ($MILLION)
- FIGURE 40. CHINA INKJET CODER MARKET, 2022-2032 ($MILLION)
- FIGURE 41. JAPAN INKJET CODER MARKET, 2022-2032 ($MILLION)
- FIGURE 42. INDIA INKJET CODER MARKET, 2022-2032 ($MILLION)
- FIGURE 43. SOUTH KOREA INKJET CODER MARKET, 2022-2032 ($MILLION)
- FIGURE 44. AUSTRALIA INKJET CODER MARKET, 2022-2032 ($MILLION)
- FIGURE 45. REST OF ASIA-PACIFIC INKJET CODER MARKET, 2022-2032 ($MILLION)
- FIGURE 46. BRAZIL INKJET CODER MARKET, 2022-2032 ($MILLION)
- FIGURE 47. UNITED ARAB EMIRATES INKJET CODER MARKET, 2022-2032 ($MILLION)
- FIGURE 48. SAUDI ARABIA INKJET CODER MARKET, 2022-2032 ($MILLION)
- FIGURE 49. SOUTH AFRICA INKJET CODER MARKET, 2022-2032 ($MILLION)
- FIGURE 50. REST OF LAMEA INKJET CODER MARKET, 2022-2032 ($MILLION)
- FIGURE 51. TOP WINNING STRATEGIES, BY YEAR
- FIGURE 52. TOP WINNING STRATEGIES, BY DEVELOPMENT
- FIGURE 53. TOP WINNING STRATEGIES, BY COMPANY
- FIGURE 54. PRODUCT MAPPING OF TOP 10 PLAYERS
- FIGURE 55. COMPETITIVE DASHBOARD
- FIGURE 56. COMPETITIVE HEATMAP: INKJET CODER MARKET
- FIGURE 57. TOP PLAYER POSITIONING, 2022
 全球噴墨打碼機市場規模、佔有率、成長分析、依產品(連續噴墨打碼機、依需噴墨打碼機)、最終用戶、墨水 - 產業預測 2024-2031
 噴墨印刷:市場佔有率分析、產業趨勢與統計、成長預測(2024-2029)
 連續噴印 (CIJ) 機市場報告:2030 年趨勢、預測與競爭分析
 全球熱噴墨墨水市場 - 2023-2030
 噴墨打碼機市場:按類型和應用分類 - 2023 年至 2030 年全球預測
 全球噴墨打碼機市場規模研究與預測,按類型、按應用和區域分析,2023-2030年
 數位生產噴墨印刷市場規模和預測、全球和地區佔有率、趨勢和成長機會分析報告範圍:按類型、生產方法和應用
 噴墨打碼機的全球市場
 噴墨印刷技術:各種用途、亞太地區市場
 MEMS噴墨印表機頭的全球市場的考察,預測(~2029年)