


 |
市場調查報告書
商品編碼
1246781
海上互聯互通(第 11 版)Maritime Connectivity, 11th Edition |
||||||
即使 COVID-19 的影響從市場上消失,數字化和吞吐量需求仍然存在。 客船將經歷連接需求激增,對石油和天然氣的需求以及離岸設施將逐船持續,這可能是船員福利成為需求的主要驅動力的時候。 總體而言,對海事衛星連接的需求持續增長,到 2032 年,新的終端外形和價格點預計將向小型船舶開放,新的商業模式將獲得邊際用例。
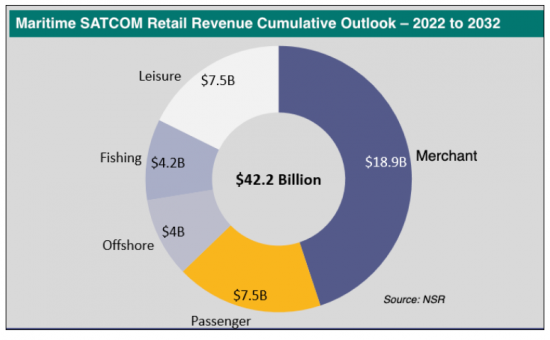
預測期內的累計收入預計為 422 億美元,複合年增長率為 9.5%。
分析總結
本報告分析了全球海事連接(海事衛星通信)的最新發展、市場動態和增長機會、GEO(對地靜止)和 NGEO(非對地靜止)連接在海事衛星通信中的作用,以及整個市場規模 - 運行中的衛星數量、零售額、容量需求、收入等 - 趨勢展望(未來 10 年),按地區和細分市場(商船、客船、海上設施、漁船、休閒船)我們將匯總並發布行業參與者未來應採取的詳細趨勢和策略等信息。
主要特點
本報告分析的內容:
- NGSO(非固定)公司的努力及其影響:Starlink/OneWeb
- 按地區劃分的趨勢:8 個地區(北美、拉丁美洲、歐洲、中東/非洲、亞洲、AOR(大西洋)、IOR(印度洋)、POR(太平洋)、ARC(南極洲))
- 按船舶類型預測:總共 5 種類型(商業、客運、海上設施、漁業、休閒船)
- 每個船舶市場的 VSAT 需求摘要
本報告中分析的公司
SpaceX Starlink、OneWeb、Telesat Lightspeed、AWS Kuiper、Inmarsat、Intellian、Speedcast、Marlink、Anuvu、SES
內容
第 1 章海上衛星通信:執行摘要
- 概覽
- 420 億美元的市場機會
- 短期內每月 ARPU 上升
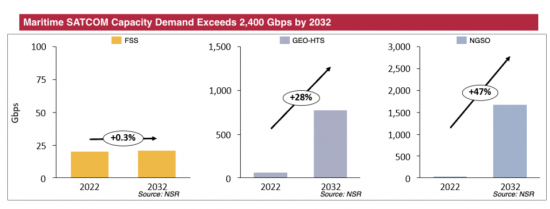
- 正在向非 GEO HTS 遷移
- 主要分析結果
第2章主要分析結果
- 衛星通信船市場的 LEO+MEO 樞軸
- VSAT:歷史比較
- 區域展望
- 有效市場 (TAM)
- 服務提供商層的狀態
- 商船的前景
- 客船前景
- 海上設施的前景
- 漁船的前景
- 休閒船的前景
第 3 章問題與建議
- 超越“連通性”的貨幣化
- NGEO 是否會改善連接並減少服務提供商提供的 VAS 的作用?
- 海上衛星通信的三大增長機會
第四章數據附錄
Report Summary:
NSR's “ Maritime Connectivity, 11th Edition” report offers valuable insights and analysis, helping industry stakeholders understand market dynamics and capitalize on growth opportunities in maritime SatCom markets.
Focusing on the impacts from Non-GEO systems such as the 'new entrants' of Starlink, OneWeb, and mPower this edition explores the role of GEO vs. Non-GEO (NGSO) connectivity in the maritime SATCOM markets. Building from a regional and segment level view, the report is broken down into 5 vessel types - Merchant, Passenger, Offshore, Fishing, and Leisure. Each segmentation provides insight into In-service units, retail revenues, capacity demand and revenue. Overall, as more capacity choices come online over the next ten years Maritime SATCOM players will need to have a carefully crafted capacity strategy in place to optimize revenues and meet customer demands.
As the impacts of COVID-19 fall away from the market, digitalization and throughput requirements remain. Passenger vessels are seeing a surge in connectivity requirements, oil and gas / Offshore demand persist on a per-vessel basis, and now might be the time for crew welfare provisioning to become a key driver of demand. Towards 2032, new terminal form factors and price points will unlock smaller and smaller vessels, new business models will help capture marginal use-cases, and overall, the demand for maritime satellite connectivity continues to expand.
Bottom line, NSR's “ Maritime Connectivity, 11th Edition” helps industry stakeholders make informed decisions about their business strategies and investments in this important evolving market.
Key questions are answered in this report?
- What are the major satellite connectivity architectures?
- Which region holds the most opportunity?
- What is the revenue outlook of the Maritime SATCOM Market?
- What is the growth rate of the Maritime SATCOM market?
- Which vessel market is in transition towards NGSO market?
Who Should Purchase this Report:
- SATCOM service providers
- Business Strategy mangers
- Maritime end-users
- Maritime Satellite Equipment manufacturers
- Satellite Operators
- Financial services and other investor community members
Key Features:
Covered in this Report:
- NEW in this Edition - Focus on the uptake and impact of NGSO Players such as Starlink and OneWeb
- 8 Regions - NAM, LAM, EU, MEA, ASIA, AOR, IOR, POR, ARC
- Forecasts for 5 vessel markets - Merchant, Passenger, Offshore, Fishing, Leisure.
- Overview of VSAT demand for each vessel market.
Key Findings:
- Merchant Vessels - VSAT adoption increasing across merchant market. IoT and Cloud-to-Vessel adoption is occurring across fleets, including more SD-WAN installations.
- Passenger Vessels - Cruise liners trialing NGSO connectivity e.g., SpaceX Starlink. Passenger vessels are optimizing their fleets network to automate data processing.
- Offshore Vessels - A market that is filled with VSAT architecture. Early trials of NGSO low latency connectivity taking place in Q1 of 2023 e.g., SpaceX Starlink.
- Fishing Vessels - Vessel optimization for HTS architecture is occurring and is a given with new builds. VSAT adoption is on the rise across the fishing market.
- Leisure Vessels - NGSO adoption is occurring across both small and super yachts. VSAT adoption is happening on small yachts due to affordable price tag.
Overall cumulative revenue for the forecast period is USD$42.2 billion and a CAGR of 9.5%.
Companies included in this Report:
SpaceX Starlink, OneWeb, Telesat Lightspeed, AWS Kuiper, Inmarsat, Intellian, Speedcast, Marlink, Anuvu, SES.
Table of Contents
1. Maritime SATCOM Executive Summary
- 1.1. Overview
- 1.2. A $42 Billion Opportunity
- 1.3. A near-term Increase for Monthly ARPUs
- 1.4. The Non-GEO HTS Migration Underway
- 1.5. Major Findings
2. Key Findings
- 2.1. A LEO + MEO Pivot for SATCOM vessel markets
- 2.2. VSAT Historical Comparisons
- 2.3. Regional Outlook
- 2.4. Total Addressable Market (TAM)
- 2.5. State of Service Provider Layer
- 2.6. Merchant Outlook
- 2.7. Passenger Outlook
- 2.8. Offshore Outlook
- 2.9. Fishing Outlook
- 2.10. Leisure Outlook
3. Challenges and Recommendations
- 3.1. Monetizing beyond "Connectivity"
- 3.2. Non-GEO Improving Connectivity and Decreasing Role of SP-provided VAS?
- 3.3. Three Big Growth Opportunities in Maritime SATCOM.
4. Data Appendix
- 4.1. Global Forecast At-a-glance
- 4.2. Merchant Forecast
- 4.3. Passenger Forecast
- 4.4. Offshore Forecast
- 4.5. Fishing Forecast
- 4.6. Leisure Forecast
- 4.7. Key Definitions
- 4.8. Changelog
List of Exhibits
1. Maritime SATCOM Executive Summary
- 1.1. Maritime SATCOM Retail Revenue Cumulative Outlook - 2022 to 2032
- 1.2. Global Maritime SATCOM Market Retail Revenue ($M)
- 1.3. Global Maritime SATCOM Average BB $Month 2022-2027
- 1.4. Maritime SATCOM Capacity Demand, FSS vs. GEO-HTS vs. NGSO
- 1.5. Maritime SATCOM Capacity Revenues
2. Key Findings
- 2.1. Maritime SATCOM Retail Revenues by Capacity Type (USD $M)
- 2.2. VSAT Vessel Comparison
- 2.3. VSAT No. of Vessels
- 2.4. Broadband SATCOM Addressable Vessels
- 2.5. Broadband Connected Vessels
- 2.6. Top Maritime Service Provider by Service Revenues (2022)
- 2.7. Top Maritime Service Provider by Connected Vessels (2022)
- 2.8. Merchant Retail ARPU 2022-2032 (USD$ per Month)
- 2.9. Merchant Service Revenues ($M) - GEO-HTS vs NGSO
- 2.10. Percentage of Addressable Merchant vessels
- 2.11. Passenger Retail ARPU 2022-2032 (USD$ per Month)
- 2.12. Passenger Service Revenues ($M) - GEO-HTS vs NGSO
- 2.13. Percentage of Addressable Passenger vessels
- 2.14. Offshore Retail ARPU 2022-2032 (USD$ per Month)
- 2.15. Offshore Service Revenues ($M) - GEO-HTS vs NGSO
- 2.16. Percentage of Addressable Offshore vessels
- 2.17. Fishing Retail ARPU 2022-2032 (USD$ per Month)
- 2.18. Fishing Service Revenues ($M) - GEO-HTS vs NGSO
- 2.19. Percentage of Addressable Fishing vessels
- 2.20. Leisure Retail ARPU 2022-2032 (USD$ per Month)
- 2.21. Leisure Service Revenues ($M) - GEO-HTS vs NGSO
- 2.22. Percentage of Addressable Leisure vessels
3. Challenges and Recommendations
- 3.1. Average VSAT Mbps Demand Per Vessel by Market
- 3.2. NGSO Maritime SATCOM Market Breakdown
- 3.3. Global Maritime SATCOM NGSO Capacity Revenues ($M)
- 3.4. Global Maritime SATCOM NGSO Capacity Demand Breakdown
4. Appendix
- 4.1. Global
- 4.1.1. Global Maritime Market Retail Revenues (USD Billions)
- 4.1.2. Global Maritime Market In-Service Units
- 4.1.3. Global Maritime Market Capacity Demand
- 4.2. Merchant Forecast
- 4.2.1. In-Service Units, 2022 to 2032
- 4.2.2. Retail Revenues (USD Million), 2022 to 2032
- 4.2.3. Capacity Demand (FSS, GEO-HTS & NGSO)
- 4.2.4. Cumulative Capacity Revenues (USD Billions), '22 to '32
- 4.2.5. Capacity Revenues (USD Millions)
- 4.2.6. Regional In-Service Units
- 4.2.7. Regional Retail Revenues (USD Billions)
- 4.2.8. Regional Capacity Demand (FSS, GEO-HTS & NGSO)
- 4.3. Passenger Forecast
- 4.3.1. In-Service Units, 2022 to 2032
- 4.3.2. Retail Revenues (USD Million), 2022 to 2032
- 4.3.3. Capacity Demand (FSS, GEO-HTS & NGSO)
- 4.3.4. Cumulative Capacity Revenues (USD Billions), '22 to '32
- 4.3.5. Capacity Revenues (USD Millions)
- 4.3.6. Regional In-Service Units
- 4.3.7. Regional Retail Revenues (USD Billions)
- 4.3.8. Regional Capacity Demand (FSS, GEO-HTS & NGSO)
- 4.4. Offshore Forecast
- 4.4.1. In-Service Units, 2022 to 2032
- 4.4.2. Retail Revenues (USD Million), 2022 to 2032
- 4.4.3. Capacity Demand (FSS, GEO-HTS & NGSO)
- 4.4.4. Cumulative Capacity Revenues (USD Billions), '22 to '32
- 4.4.5. Capacity Revenues (USD Millions)
- 4.4.6. Regional In-Service Units
- 4.4.7. Regional Retail Revenues (USD Billions)
- 4.4.8. Regional Capacity Demand (FSS, GEO-HTS & NGSO)
- 4.5. Fishing Forecast
- 4.5.1. In-Service Units, 2022 to 2032
- 4.5.2. Retail Revenues (USD Million), 2022 to 2032
- 4.5.3. Capacity Demand (FSS, GEO-HTS & NGSO)
- 4.5.4. Cumulative Capacity Revenues (USD Billions), '22 to '32
- 4.5.5. Capacity Revenues (USD Millions)
- 4.5.6. Regional In-Service Units
- 4.5.7. Regional Retail Revenues (USD Billions)
- 4.5.8. Regional Capacity Demand (FSS, GEO-HTS & NGSO)
- 4.6. Leisure Forecast
- 4.6.1. In-Service Units, 2022 to 2032
- 4.6.2. Retail Revenues (USD Million), 2022 to 2032
- 4.6.3. Capacity Demand (FSS, GEO-HTS & NGSO)
- 4.6.4. Cumulative Capacity Revenues (USD Billions), '22 to '32
- 4.6.5. Capacity Revenues (USD Millions)
- 4.6.6. Regional In-Service Units
- 4.6.7. Regional Retail Revenues (USD Billions)
- 4.6.8. Regional Capacity Demand (FSS, GEO-HTS & NGSO)


![海事衛星通訊市場:趨勢、機會與競爭分析 [2023-2028]](/sample/img/cover/42/1342014.png)
