


 |
市場調查報告書
商品編碼
1430570
根瘤菌:市場佔有率分析、產業趨勢/統計、成長預測(2024-2029)Rhizobium - Market Share Analysis, Industry Trends & Statistics, Growth Forecasts (2024 - 2029) |
||||||
價格
※ 本網頁內容可能與最新版本有所差異。詳細情況請與我們聯繫。
簡介目錄
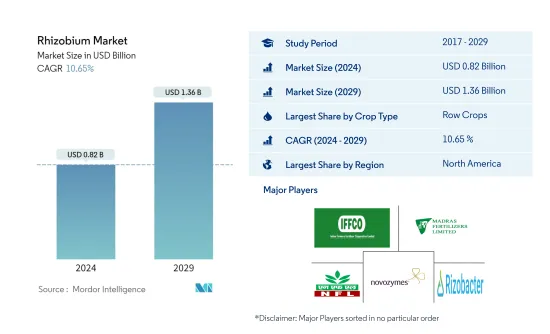
根瘤菌市場規模預計到2024年為8.2億美元,預計到2029年將達到13.6億美元,在預測期內(2024-2029年)複合年成長率為10.65%。
主要亮點
- 田間作物是最大的作物類型。根瘤菌與豆科植物根部的相互作用形成了一個高度調控的過程,將大氣中的氮轉化為可吸收的植物養分。
- 連作作物是生長最快的作物。大麥、玉米、小麥、油菜籽、黑麥、向日葵、大豆和稻米在世界各地種植。北美和歐洲地區的連續作物消費主導市場。
- 北美是最大的地區。美國和加拿大連作作物有機種植的增加導致該地區根瘤菌生物肥料的使用增加。
- 美國是最大的國家。該國生產玉米、大豆、稻米、小麥和紫花苜蓿,田間作物有機種植面積不斷擴大,2017年至2022年增加27.4%。
根瘤菌市場趨勢
田間作物是最大的作物類型
- 根瘤菌和豆科植物根部之間的特異性相互作用形成了一種高度控制的過程,稱為調節,將大氣中的氮轉化為可吸收的植物養分。這種能力是田間作物生產中使用細菌接種劑的基礎。 2022年,菌根真菌市場以連作作物為主,約佔市場金額的69.7%。世界上最重要的連續作物是大麥、玉米、小麥、油菜籽、黑麥、向日葵、大豆和稻米。
- 到 2022 年,園藝作物中基於根瘤菌的生物肥料市場預計將達到 1.372 億美元,使用量為 4,900 噸。根瘤菌定殖在番茄和辣椒的根部,促進生產各階段的生長,提高幼苗和果實的產量和品質。它也用於番茄、辣椒和其他園藝水果的溫室栽培。
- 咖啡、茶葉、可可、棉花、甘蔗、油菜籽、向日葵和菸草是全世界種植的主要經濟作物。 2022年,經濟作物佔根瘤菌生物肥料市場價值6,870萬美元。北美主導經濟作物市場,2022 年銷售額約 5,220 萬美元。
- 根瘤菌接種可以為植物提供所需的氮,同時減少無機氮肥的需求。有效的根瘤菌接種可提供高達產量所需總氮的 50-70%。根瘤菌也會產生維生素、胺基酸、鐵載體、生長素和固氮作用。
- 由於上述特點以及根瘤菌肥料應用的增加,預計市場在預測期內將會成長。
北美是最大的地區
- 根瘤菌與植物有共生關係,是生活在豆科植物根瘤中最重要的固氮細菌。根瘤菌是世界上消費量第二大的生物肥料,到2022年將佔25.4%的佔有率。
- 據估計,根瘤菌的微生物活性每年在各種豆類作物中每公頃固定 40 至 250 公斤氮。歐盟 (EU) 計劃透過擴大豆類作物種植面積,轉向永續植物蛋白生產。
- 2022年,北美主導全球根瘤菌市場,市場佔有率為52.7%。北美根瘤菌生物肥料市場以連作作物為主,2022年約佔市場金額的62.4%。連作作物占主導地位,因為根瘤菌與連作作物中的作物共存。由於該地區連作作物的高種植,預計市場價值將在預測期內增加,複合年成長率為 13.0%。
- 非普通作物非常需要額外散佈以提高作物產量潛力。使用生物固氮細菌可以增加穀物、水果和蔬菜等非反芻作物的產量。根瘤菌生物肥料市場以栽培作物為主,由於田間作物種植面積較大,2022年約佔市場金額的69.8%。眾所周知,將根瘤菌生物肥料應用於水果和蔬菜作物可以增加養分利用率並產生必要的植物激素。
根瘤菌產業概述
根瘤菌市場較為分散,前五名企業佔28.14%。該市場的主要企業包括印度農民肥料合作社有限公司、馬德拉斯肥料有限公司、國家肥料有限公司、Novozymes 和 Rizobacter。 (按字母順序)
其他福利:
- Excel 格式的市場預測 (ME) 表
- 3 個月的分析師支持
目錄
第1章執行摘要和主要發現
第2章 檢舉要約
第3章簡介
- 研究假設和市場定義
- 調查範圍
- 調查方法
第4章 產業主要趨勢
- 有機種植面積
- 人均有機產品支出
- 法律規範
- 價值鍊和通路分析
第5章市場區隔
- 作物類型
- 經濟作物
- 園藝作物
- 栽培作物
- 地區
- 非洲
- 按國家/地區
- 埃及
- 奈及利亞
- 南非
- 其他非洲
- 亞太地區
- 按國家/地區
- 澳洲
- 中國
- 印度
- 印尼
- 日本
- 菲律賓
- 泰國
- 越南
- 其他亞太地區
- 歐洲
- 按國家/地區
- 法國
- 德國
- 義大利
- 荷蘭
- 俄羅斯
- 西班牙
- 土耳其
- 英國
- 其他歐洲國家
- 中東
- 按國家/地區
- 伊朗
- 沙烏地阿拉伯
- 其他中東地區
- 北美洲
- 按國家/地區
- 加拿大
- 墨西哥
- 美國
- 其他北美地區
- 南美洲
- 按國家/地區
- 阿根廷
- 巴西
- 南美洲其他地區
- 非洲
第6章 競爭形勢
- 主要策略趨勢
- 市場佔有率分析
- 公司形勢
- 公司簡介
- Indian Farmers Fertiliser Cooperative Limited
- Indogulf BioAg LLC(Biotech Division of Indogulf Company)
- IPL Biologicals Limited
- Lallemand Inc.
- Madras Fertilizers Limited
- National Fertilizers Limited
- Novozymes
- Rizobacter
- T Stanes and Company Limited
- Vittia Group
第7章 執行長的關鍵策略問題 執行長的關鍵策略問題
第8章附錄
- 世界概況
- 概述
- 五力分析框架
- 世界價值鏈分析
- 市場動態(DRO)
- 資訊來源和參考文獻
- 圖表列表
- 重要見解
- 資料包
- 詞彙表
簡介目錄
Product Code: 64662
The Rhizobium Market size is estimated at USD 0.82 billion in 2024, and is expected to reach USD 1.36 billion by 2029, growing at a CAGR of 10.65% during the forecast period (2024-2029).
Key Highlights
- Row Crops is the Largest Crop Type. The interaction between rhizobia and legume roots results in the formation of a highly regulated process converts atmospheric nitrogen into an assimilable plant nutrient.
- Row Crops is the Fastest-growing Crop Type. Barley, maize, wheat, rapeseed, rye, sunflower, soybean, and rice crops formed globally. North America and Europe regions row crop's consumption dominating the market.
- North America is the Largest Region. The increased organic cultivation of row crops in the United states and Canada resulted in an increase in the use of rhizobia-based biofertilizers in the region.
- United States is the Largest Country. Corn, soybeans, rice, wheat, and alfalfa are produced in the country and the organic area under cultivation of field crops has expanded, increased by 27.4% from 2017 to 2022.
Rhizobium Market Trends
Row Crops is the largest Crop Type
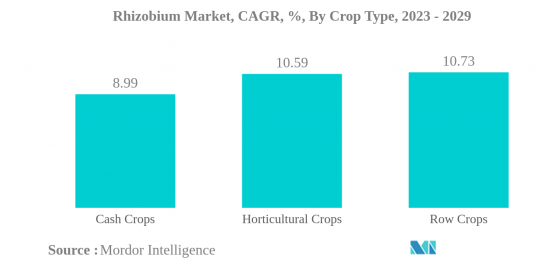
- The specific interaction between rhizobia and legume roots results in the formation of a highly regulated process termed modulation, which converts atmospheric nitrogen into an assimilable plant nutrient. This ability provides the basis for the use of bacterial inoculants in field crop production. Row crops dominated the mycorrhiza market in 2022, accounting for around 69.7% of market value. Globally, the most important row crops are barley, maize, wheat, rapeseed, rye, sunflower, soybean, and rice.
- The market for rhizobium-based biofertilizers in horticultural crops is expected to be worth USD 137.2 million, with 4.9 thousand metric tons used in 2022. Rhizobium strains colonize the roots of tomato and pepper plants to encourage growth at various stages of production, increasing seedling and fruit yield and quality. It is also utilized in greenhouse culture, such as tomato and capsicum farming, as well as other horticultural fruit growing.
- Coffee, tea, cocoa, cotton, sugarcane, rapeseed, sunflower, and tobacco are some of the major cash crops grown globally. Cash crops accounted for USD 68.7 million in the market value of rhizobium-based biofertilizers in 2022. North America dominated the market for cash crops and accounted for about USD 52.2 million in 2022.
- Rhizobium inoculation can provide plant nitrogen requirements while decreasing the demand for inorganic nitrogen fertilizer. Effective rhizobium inoculation can deliver up to 50-70% of the total nitrogen required to boost yields. Rhizobium also generates vitamins, amino acids, siderophores, auxins, and nitrogen fixation.
- Owing to the above-mentioned characteristics and the increase in the application of rhizobium-based fertilizers, the market is anticipated to grow during the forecast period.
North America is the largest Region
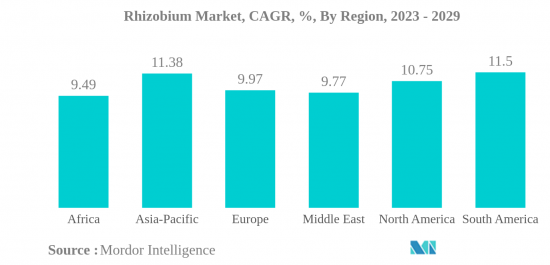
- Rhizobium is the most important nitrogen-fixing bacterium that exists in a symbiotic relationship with plants and lives in the root nodules of leguminous plants. Rhizobium is the second most consumed among biofertilizers globally and accounted for a share of 25.4% in the year 2022.
- It has been estimated that 40-250 kg of nitrogen per hectare per year is fixed by different legume crops by the microbial activities of rhizobium. The European Union is planning to make the transition toward sustainable plant protein production through the expansion of the area under leguminous crop cultivation.
- North America dominated the global rhizobium market with a market share of 52.7% in 2022. Row crops dominate the rhizobium biofertilizer market in North America, and they accounted for about 62.4% of the market value in 2022. The dominance of row crops is due to rhizobium's symbiotic association with leguminous crops, which come under row crops. Due to the large cultivation of row crops in the region, their market value is anticipated to increase, registering a CAGR of 13.0% during the forecast period.
- The requirement for additional application of nitrogen in non-leguminous crops is high in order to enhance the yield potential of the crops. The usage of biological nitrogen-fixing bacteria can increase the production of non-leguminous crops like cereals, fruits, and vegetables. Row crops dominate the rhizobium biofertilizer market and accounted for about 69.8% of the market value in 2022, owing to the large area under the cultivation of field crops. The application of rhizobium biofertilizers in fruit and vegetable crops is known to increase nutrient availability and produce required plant hormones.
Rhizobium Industry Overview
The Rhizobium Market is fragmented, with the top five companies occupying 28.14%. The major players in this market are Indian Farmers Fertiliser Cooperative Limited, Madras Fertilizers Limited, National Fertilizers Limited, Novozymes and Rizobacter (sorted alphabetically).
Additional Benefits:
- The market estimate (ME) sheet in Excel format
- 3 months of analyst support
TABLE OF CONTENTS
1 EXECUTIVE SUMMARY & KEY FINDINGS
2 REPORT OFFERS
3 INTRODUCTION
- 3.1 Study Assumptions & Market Definition
- 3.2 Scope of the Study
- 3.3 Research Methodology
4 KEY INDUSTRY TRENDS
- 4.1 Area Under Organic Cultivation
- 4.2 Per Capita Spending On Organic Products
- 4.3 Regulatory Framework
- 4.4 Value Chain & Distribution Channel Analysis
5 MARKET SEGMENTATION
- 5.1 Crop Type
- 5.1.1 Cash Crops
- 5.1.2 Horticultural Crops
- 5.1.3 Row Crops
- 5.2 Region
- 5.2.1 Africa
- 5.2.1.1 By Country
- 5.2.1.1.1 Egypt
- 5.2.1.1.2 Nigeria
- 5.2.1.1.3 South Africa
- 5.2.1.1.4 Rest of Africa
- 5.2.2 Asia-Pacific
- 5.2.2.1 By Country
- 5.2.2.1.1 Australia
- 5.2.2.1.2 China
- 5.2.2.1.3 India
- 5.2.2.1.4 Indonesia
- 5.2.2.1.5 Japan
- 5.2.2.1.6 Philippines
- 5.2.2.1.7 Thailand
- 5.2.2.1.8 Vietnam
- 5.2.2.1.9 Rest of Asia-Pacific
- 5.2.3 Europe
- 5.2.3.1 By Country
- 5.2.3.1.1 France
- 5.2.3.1.2 Germany
- 5.2.3.1.3 Italy
- 5.2.3.1.4 Netherlands
- 5.2.3.1.5 Russia
- 5.2.3.1.6 Spain
- 5.2.3.1.7 Turkey
- 5.2.3.1.8 United Kingdom
- 5.2.3.1.9 Rest of Europe
- 5.2.4 Middle East
- 5.2.4.1 By Country
- 5.2.4.1.1 Iran
- 5.2.4.1.2 Saudi Arabia
- 5.2.4.1.3 Rest of Middle East
- 5.2.5 North America
- 5.2.5.1 By Country
- 5.2.5.1.1 Canada
- 5.2.5.1.2 Mexico
- 5.2.5.1.3 United States
- 5.2.5.1.4 Rest of North America
- 5.2.6 South America
- 5.2.6.1 By Country
- 5.2.6.1.1 Argentina
- 5.2.6.1.2 Brazil
- 5.2.6.1.3 Rest of South America
- 5.2.1 Africa
6 COMPETITIVE LANDSCAPE
- 6.1 Key Strategic Moves
- 6.2 Market Share Analysis
- 6.3 Company Landscape
- 6.4 Company Profiles
- 6.4.1 Indian Farmers Fertiliser Cooperative Limited
- 6.4.2 Indogulf BioAg LLC (Biotech Division of Indogulf Company)
- 6.4.3 IPL Biologicals Limited
- 6.4.4 Lallemand Inc.
- 6.4.5 Madras Fertilizers Limited
- 6.4.6 National Fertilizers Limited
- 6.4.7 Novozymes
- 6.4.8 Rizobacter
- 6.4.9 T Stanes and Company Limited
- 6.4.10 Vittia Group
7 KEY STRATEGIC QUESTIONS FOR AGRICULTURAL BIOLOGICALS CEOS
8 APPENDIX
- 8.1 Global Overview
- 8.1.1 Overview
- 8.1.2 Porter's Five Forces Framework
- 8.1.3 Global Value Chain Analysis
- 8.1.4 Market Dynamics (DROs)
- 8.2 Sources & References
- 8.3 List of Tables & Figures
- 8.4 Primary Insights
- 8.5 Data Pack
- 8.6 Glossary of Terms
02-2729-4219
+886-2-2729-4219
 2024-2032 年生物肥料市場報告(按類型、作物、微生物、施用方式和地區)
 生物肥料市場-2024年至2029年預測
 2024 年生物肥料全球市場報告
 生物有機肥料 - 市場佔有率分析、產業趨勢與統計、成長預測(2024 - 2029)
 生物肥料:市場佔有率分析、產業趨勢與統計、成長預測(2024-2029)
 全球根瘤菌市場 - 2023-2030
 2024 年根瘤菌肥料全球市場報告
 全球生物肥料市場 - 2023-2030
 生物肥料市場 - 2018-2028 年全球產業規模、佔有率、趨勢、機會和預測,按類型、形式、作物類型、按應用、微生物類型、地區和競爭細分
 生物肥料市場:2023-2028年全球行業趨勢、佔有率、規模、成長、機會和預測
▼