


 |
市場調查報告書
商品編碼
1334629
全球數位電力公用事業市場規模研究與預測,按技術(硬體、軟體和服務)、部門(發電、輸電和配電、電力消耗)和區域分析,2023-2030 年Global Digital Power Utility Market Size study & Forecast, by Technology (Hardware, Software & Service), by Sector (Power Generation, Transmission & Distribution, Power Consumption) and Regional Analysis, 2023-2030 |
||||||
數位電力公司是指將先進的數位技術整合到電力公司的營運和管理中。在數位技術、數據分析和自動化快速發展的推動下,傳統電力行業一直在經歷轉型。目的是提高效率、可靠性和永續性,同時為客戶提供更好的服務。推動市場成長的關鍵因素是可再生能源項目資本投資的增加、智慧電網的不斷實施以及各行業對能源需求的不斷成長,預計將促進數位化的採用,從而在 2023 年預測期內支持市場成長-2030 。
此外,對智慧電網不斷成長的需求是支持數位電力公用事業市場成長的重要因素。隨著世界轉向更清潔、更永續的能源結構,太陽能、風能和水力發電等可再生能源的整合日益增多。智慧電網在將這些間歇性能源有效整合到電網方面發揮著至關重要的作用。數位電力公用事業解決方案能夠即時監測和控制可再生能源發電,確保其順利整合併最佳化其使用。據 Statista 稱,2022 年全球智慧電網技術市場價值為 497 億美元,預計到 2028 年將達到 1302 億美元。此外,政府的一致舉措預計將在預測期內為市場創造利潤豐厚的機會。然而,改造現有基礎設施的高昂營運成本抑制了 2023-2030 年預測期內的市場成長。
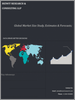
全球數位電力公用事業市場研究涵蓋的關鍵區域包括亞太地區、北美、歐洲、拉丁美洲以及中東和非洲。由於該地區各個行業的足跡增加,導致輸配電行業擴張,北美將在 2022 年佔據市場主導地位。此外,對智慧建築和建築自動化的需求不斷成長,促進了該地區智慧計量和感測器的安裝,這也支持了市場的成長。然而,由於政府支持力度加大、綠色建築趨勢的採用以及可再生能源投資等因素是推動市場擴張的關鍵因素,預計亞太地區在預測期內將以最高的年複合成長率成長。預計中國和印度等國家化石燃料發電的擴大將擴大該地區的市場。
該研究的目的是確定近年來不同細分市場和國家的市場規模,並預測未來幾年的價值。該報告旨在涵蓋參與研究的國家內該行業的定性和定量方面。
該報告還提供了有關促進因素和挑戰等關鍵方面的詳細資訊,這些因素將決定市場的未來成長。此外,它還涵蓋了利益相關者投資的微觀市場的潛在機會,以及對主要參與者的競爭格局和產品供應的詳細分析。 。
目錄
第 1 章:執行摘要
- 市場概況
- 2020-2030 年全球和細分市場估計與預測
- 2020-2030 年數位電力公用事業市場(按地區)
- 數位電力公用事業市場,按技術分類,2020-2030 年
- 數位電力公用事業市場,按行業分類,2020-2030 年
- 主要趨勢
- 估算方法
- 研究假設
第 2 章:全球數位電力公用事業市場定義和範圍
- 研究目的
- 市場定義和範圍
- 行業演變
- 研究範圍
- 研究涵蓋的年份
- 貨幣兌換率
第 3 章:全球數位電力公用事業市場動態
- 數位電力公用事業市場影響分析(2020-2030)
- 市場促進因素
- 可再生能源項目的資本投資不斷增加
- 智慧電網的不斷實施
- 各行業對能源的需求不斷成長
- 市場挑戰
- 改造現有基礎設施營運成本高昂
- 市場機會
- 具有凝聚力的政府舉措
- 不斷成長的電力消耗
- 市場促進因素
第 4 章:全球數位電力公用事業市場行業分析
- 波特的五力模型
- 供應商的議價能力
- 買家的議價能力
- 新進入者的威脅
- 替代品的威脅
- 競爭競爭
- 波特的五力影響分析
- PEST分析
- 政治的
- 經濟
- 社會的
- 技術性
- 環境的
- 合法的
- 頂級投資機會
- 最佳制勝策略
- COVID-19 影響分析
- 顛覆性趨勢
- 行業專家視角
- 分析師推薦與結論
第 5 章:按技術分類的全球數位電力公用事業市場
- 市場概況
- 全球數位電力公用事業市場(按技術、性能)-潛力分析
- 2020-2030 年全球數位電力公用事業市場估計和技術預測
- 數位電力公用事業市場細分分析
- 硬體
- 軟體與服務
第 6 章:全球數位電力公用事業市場(按行業)
- 市場概況
- 全球數位電力公用事業市場(按行業、績效 - 潛力分析)
- 2020-2030 年按行業分類的全球數位電力公用事業市場估計和預測
- 數位電力公用事業市場細分分析
- 發電
- 輸配電
- 能量消耗
第 7 章:全球數位電力公用事業市場,區域分析
- 領先國家
- 頂級新興國家
- 數位電力公用事業市場,區域市場概況
- 北美
- 美國
- 2020-2030 年技術細分估計和預測
- 2020-2030 年行業細分估計和預測
- 加拿大
- 美國
- 歐洲數位電力公用事業市場概況
- 英國
- 德國
- 法國
- 西班牙
- 義大利
- 歐洲其他地區
- 亞太數位電力公用事業市場概況
- 中國
- 印度
- 日本
- 澳大利亞
- 韓國
- 亞太地區其他地區
- 拉丁美洲數位電力公用事業市場概況
- 巴西
- 墨西哥
- 中東和非洲
- 沙烏地阿拉伯
- 南非
- 中東和非洲其他地區
第 8 章:競爭情報
- 重點企業SWOT分析
- 公司1
- 公司2
- 公司3
- 頂級市場策略
- 公司簡介
- ABB Ltd (Switzerland)
- 關鍵資訊
- 概述
- 財務(視數據可用性而定)
- 產品概要
- 最近的發展
- General Electric Company (US)
- Siemens (Germany)
- Accenture Plc (Ireland)
- Capgemini Ltd (France)
- SAP SE (Germany)
- International Business Machines Corporation (US)
- Microsoft Corporation (US)
- Oracle Corporation (US)
- Wipro Ltd (India)
第 9 章:研究過程
- 研究過程
- 數據挖掘
- 分析
- 市場預測
- 驗證
- 出版
- 研究屬性
- 研究假設
A Digital Power Utility refers to the integration of advanced digital technologies into the operations and management of a power utility. The traditional power utility industry has been undergoing a transformation driven by rapid advancements in digital technologies, data analytics, and automation. The aim is to enhance efficiency, reliability, and sustainability while providing better services to customers. The key factors driving the market growth are growing capital investment in renewable energy projects, rising implementation of smart grid, and rising demand for energy in various sectors is anticipated to promote the adoption of digitalization that anticipated to support the market growth during the forecast period 2023-2030.
Moreover, the growing demand for smart grids is a significant factor supporting the growth of the digital power utility market. As the world shifts towards a cleaner and more sustainable energy mix, there is increasing integration of renewable energy sources such as solar, wind, and hydroelectric power. Smart grids play a crucial role in efficiently integrating these intermittent energy sources into the grid. Digital power utility solutions enable real-time monitoring and control of renewable energy generation, ensuring its smooth integration and optimizing its use. According to Statista, in 2022, the global Smart grid technology market was valued at USD 49.7 billion, and it is anticipated to reach USD 130.2 billion by 2028. Additionally, cohesive government initiatives are anticipated to create lucrative opportunities for the market during the forecast period. However, the high operating cost to transform the existing infrastructure stifles market growth throughout the forecast period of 2023-2030.
The key regions considered for the Global Digital Power Utility Market study includes Asia Pacific, North America, Europe, Latin America, and Middle East & Africa. North America dominated the market in 2022 owing to the rise in the footprint of various sectors in the region, which has led to the expansion of the power transmission & distribution industry. Also, the increasing need for intelligent buildings and building automation contributed to the installation of smart metering and sensors in the area, and that also supported the market growth. Whereas, the Asia Pacific is expected to grow with the highest CAGR during the forecast period, owing to factors such as the rising government backing, adoption of green building trends, and investment in renewable energy are the key factors contributing to the market's expansion. It is anticipated that the expansion of fossil fuel power generation in countries such as China and India would expand the region's market.
Major market player included in this report are:
- ABB Ltd. (Switzerland)
- General Electric Company (U.S.)
- Siemens (Germany)
- Accenture Plc (Ireland)
- Capgemini Ltd (France)
- SAP SE (Germany)
- International Business Machines Corporation (U.S.)
- Microsoft Corporation (U.S.)
- Oracle Corporation (U.S.)
- Wipro Ltd (India)
Recent Developments in the Market:
- In October 2021, Wipro Limited, an Indian multinational corporation, has entered into a multi-year worldwide strategic IT and digital agreement with National Grid, a British multinational electricity and gas utility company, to accelerate its digital innovation journey.
Global Digital Power Utility Market Report Scope:
- Historical Data: 2020 - 2021
- Base Year for Estimation: 2022
- Forecast period: 2023-2030
- Report Coverage: Revenue forecast, Company Ranking, Competitive Landscape, Growth factors, and Trends
- Segments Covered: Technology, Sector, Region
- Regional Scope: North America; Europe; Asia Pacific; Latin America; Middle East & Africa
- Customization Scope: Free report customization (equivalent up to 8 analyst's working hours) with purchase. Addition or alteration to country, regional & segment scope*
The objective of the study is to define market sizes of different segments & countries in recent years and to forecast the values to the coming years. The report is designed to incorporate both qualitative and quantitative aspects of the industry within countries involved in the study.
The report also caters detailed information about the crucial aspects such as driving factors & challenges which will define the future growth of the market. Additionally, it also incorporates potential opportunities in micro markets for stakeholders to invest along with the detailed analysis of competitive landscape and product offerings of key players. The detailed segments and sub-segment of the market are explained below.
By Technology:
- Hardware
- Software & Service
By Sector:
- Power Generation
- Transmission & Distribution
- Power Consumption
By Region:
- North America
- U.S.
- Canada
- Europe
- UK
- Germany
- France
- Spain
- Italy
- ROE
- Asia Pacific
- China
- India
- Japan
- Australia
- South Korea
- RoAPAC
- Latin America
- Brazil
- Mexico
- Middle East & Africa
- Saudi Arabia
- South Africa
- Rest of Middle East & Africa
Table of Contents
Chapter 1. Executive Summary
- 1.1. Market Snapshot
- 1.2. Global & Segmental Market Estimates & Forecasts, 2020-2030 (USD Billion)
- 1.2.1. Digital Power Utility Market, by Region, 2020-2030 (USD Billion)
- 1.2.2. Digital Power Utility Market, by Technology, 2020-2030 (USD Billion)
- 1.2.3. Digital Power Utility Market, by Sector, 2020-2030 (USD Billion)
- 1.3. Key Trends
- 1.4. Estimation Methodology
- 1.5. Research Assumption
Chapter 2. Global Digital Power Utility Market Definition and Scope
- 2.1. Objective of the Study
- 2.2. Market Definition & Scope
- 2.2.1. Industry Evolution
- 2.2.2. Scope of the Study
- 2.3. Years Considered for the Study
- 2.4. Currency Conversion Rates
Chapter 3. Global Digital Power Utility Market Dynamics
- 3.1. Digital Power Utility Market Impact Analysis (2020-2030)
- 3.1.1. Market Drivers
- 3.1.1.1. Growing capital investment in renewable energy projects
- 3.1.1.2. Rising implementation of smart grid
- 3.1.1.3. Rising demand for energy in various sectors
- 3.1.2. Market Challenges
- 3.1.2.1. High operating cost to transform the existing infrastructure
- 3.1.3. Market Opportunities
- 3.1.3.1. Cohesive government initiatives
- 3.1.3.2. Growing power Consumption
- 3.1.1. Market Drivers
Chapter 4. Global Digital Power Utility Market Industry Analysis
- 4.1. Porter's 5 Force Model
- 4.1.1. Bargaining Power of Suppliers
- 4.1.2. Bargaining Power of Buyers
- 4.1.3. Threat of New Entrants
- 4.1.4. Threat of Substitutes
- 4.1.5. Competitive Rivalry
- 4.2. Porter's 5 Force Impact Analysis
- 4.3. PEST Analysis
- 4.3.1. Political
- 4.3.2. Economical
- 4.3.3. Social
- 4.3.4. Technological
- 4.3.5. Environmental
- 4.3.6. Legal
- 4.4. Top investment opportunity
- 4.5. Top winning strategies
- 4.6. COVID-19 Impact Analysis
- 4.7. Disruptive Trends
- 4.8. Industry Expert Perspective
- 4.9. Analyst Recommendation & Conclusion
Chapter 5. Global Digital Power Utility Market, by Technology
- 5.1. Market Snapshot
- 5.2. Global Digital Power Utility Market by Technology, Performance - Potential Analysis
- 5.3. Global Digital Power Utility Market Estimates & Forecasts by Technology 2020-2030 (USD Billion)
- 5.4. Digital Power Utility Market, Sub Segment Analysis
- 5.4.1. Hardware
- 5.4.2. Software & Service
Chapter 6. Global Digital Power Utility Market, by Sector
- 6.1. Market Snapshot
- 6.2. Global Digital Power Utility Market by Sector, Performance - Potential Analysis
- 6.3. Global Digital Power Utility Market Estimates & Forecasts by Sector 2020-2030 (USD Billion)
- 6.4. Digital Power Utility Market, Sub Segment Analysis
- 6.4.1. Power Generation
- 6.4.2. Transmission & Distribution
- 6.4.3. Power Consumption
Chapter 7. Global Digital Power Utility Market, Regional Analysis
- 7.1. Top Leading Countries
- 7.2. Top Emerging Countries
- 7.3. Digital Power Utility Market, Regional Market Snapshot
- 7.4. North America Digital Power Utility Market
- 7.4.1. U.S. Digital Power Utility Market
- 7.4.1.1. Technology breakdown estimates & forecasts, 2020-2030
- 7.4.1.2. Sector breakdown estimates & forecasts, 2020-2030
- 7.4.2. Canada Digital Power Utility Market
- 7.4.1. U.S. Digital Power Utility Market
- 7.5. Europe Digital Power Utility Market Snapshot
- 7.5.1. U.K. Digital Power Utility Market
- 7.5.2. Germany Digital Power Utility Market
- 7.5.3. France Digital Power Utility Market
- 7.5.4. Spain Digital Power Utility Market
- 7.5.5. Italy Digital Power Utility Market
- 7.5.6. Rest of Europe Digital Power Utility Market
- 7.6. Asia-Pacific Digital Power Utility Market Snapshot
- 7.6.1. China Digital Power Utility Market
- 7.6.2. India Digital Power Utility Market
- 7.6.3. Japan Digital Power Utility Market
- 7.6.4. Australia Digital Power Utility Market
- 7.6.5. South Korea Digital Power Utility Market
- 7.6.6. Rest of Asia Pacific Digital Power Utility Market
- 7.7. Latin America Digital Power Utility Market Snapshot
- 7.7.1. Brazil Digital Power Utility Market
- 7.7.2. Mexico Digital Power Utility Market
- 7.8. Middle East & Africa Digital Power Utility Market
- 7.8.1. Saudi Arabia Digital Power Utility Market
- 7.8.2. South Africa Digital Power Utility Market
- 7.8.3. Rest of Middle East & Africa Digital Power Utility Market
Chapter 8. Competitive Intelligence
- 8.1. Key Company SWOT Analysis
- 8.1.1. Company 1
- 8.1.2. Company 2
- 8.1.3. Company 3
- 8.2. Top Market Strategies
- 8.3. Company Profiles
- 8.3.1. ABB Ltd (Switzerland)
- 8.3.1.1. Key Information
- 8.3.1.2. Overview
- 8.3.1.3. Financial (Subject to Data Availability)
- 8.3.1.4. Product Summary
- 8.3.1.5. Recent Developments
- 8.3.2. General Electric Company (U.S.)
- 8.3.3. Siemens (Germany)
- 8.3.4. Accenture Plc (Ireland)
- 8.3.5. Capgemini Ltd (France)
- 8.3.6. SAP SE (Germany)
- 8.3.7. International Business Machines Corporation (U.S.)
- 8.3.8. Microsoft Corporation (U.S.)
- 8.3.9. Oracle Corporation (U.S.)
- 8.3.10. Wipro Ltd (India)
- 8.3.1. ABB Ltd (Switzerland)
Chapter 9. Research Process
- 9.1. Research Process
- 9.1.1. Data Mining
- 9.1.2. Analysis
- 9.1.3. Market Estimation
- 9.1.4. Validation
- 9.1.5. Publishing
- 9.2. Research Attributes
- 9.3. Research Assumption
LIST OF TABLES
- TABLE 1. Global Digital Power Utility Market, report scope
- TABLE 2. Global Digital Power Utility Market estimates & forecasts by region 2020-2030 (USD Billion)
- TABLE 3. Global Digital Power Utility Market estimates & forecasts by Technology 2020-2030 (USD Billion)
- TABLE 4. Global Digital Power Utility Market estimates & forecasts by Sector 2020-2030 (USD Billion)
- TABLE 5. Global Digital Power Utility Market by segment, estimates & forecasts, 2020-2030 (USD Billion)
- TABLE 6. Global Digital Power Utility Market by region, estimates & forecasts, 2020-2030 (USD Billion)
- TABLE 7. Global Digital Power Utility Market by segment, estimates & forecasts, 2020-2030 (USD Billion)
- TABLE 8. Global Digital Power Utility Market by region, estimates & forecasts, 2020-2030 (USD Billion)
- TABLE 9. Global Digital Power Utility Market by segment, estimates & forecasts, 2020-2030 (USD Billion)
- TABLE 10. Global Digital Power Utility Market by region, estimates & forecasts, 2020-2030 (USD Billion)
- TABLE 11. Global Digital Power Utility Market by segment, estimates & forecasts, 2020-2030 (USD Billion)
- TABLE 12. Global Digital Power Utility Market by region, estimates & forecasts, 2020-2030 (USD Billion)
- TABLE 13. Global Digital Power Utility Market by segment, estimates & forecasts, 2020-2030 (USD Billion)
- TABLE 14. Global Digital Power Utility Market by region, estimates & forecasts, 2020-2030 (USD Billion)
- TABLE 15. U.S. Digital Power Utility Market estimates & forecasts, 2020-2030 (USD Billion)
- TABLE 16. U.S. Digital Power Utility Market estimates & forecasts by segment 2020-2030 (USD Billion)
- TABLE 17. U.S. Digital Power Utility Market estimates & forecasts by segment 2020-2030 (USD Billion)
- TABLE 18. Canada Digital Power Utility Market estimates & forecasts, 2020-2030 (USD Billion)
- TABLE 19. Canada Digital Power Utility Market estimates & forecasts by segment 2020-2030 (USD Billion)
- TABLE 20. Canada Digital Power Utility Market estimates & forecasts by segment 2020-2030 (USD Billion)
- TABLE 21. UK Digital Power Utility Market estimates & forecasts, 2020-2030 (USD Billion)
- TABLE 22. UK Digital Power Utility Market estimates & forecasts by segment 2020-2030 (USD Billion)
- TABLE 23. UK Digital Power Utility Market estimates & forecasts by segment 2020-2030 (USD Billion)
- TABLE 24. Germany Digital Power Utility Market estimates & forecasts, 2020-2030 (USD Billion)
- TABLE 25. Germany Digital Power Utility Market estimates & forecasts by segment 2020-2030 (USD Billion)
- TABLE 26. Germany Digital Power Utility Market estimates & forecasts by segment 2020-2030 (USD Billion)
- TABLE 27. France Digital Power Utility Market estimates & forecasts, 2020-2030 (USD Billion)
- TABLE 28. France Digital Power Utility Market estimates & forecasts by segment 2020-2030 (USD Billion)
- TABLE 29. France Digital Power Utility Market estimates & forecasts by segment 2020-2030 (USD Billion)
- TABLE 30. Italy Digital Power Utility Market estimates & forecasts, 2020-2030 (USD Billion)
- TABLE 31. Italy Digital Power Utility Market estimates & forecasts by segment 2020-2030 (USD Billion)
- TABLE 32. Italy Digital Power Utility Market estimates & forecasts by segment 2020-2030 (USD Billion)
- TABLE 33. Spain Digital Power Utility Market estimates & forecasts, 2020-2030 (USD Billion)
- TABLE 34. Spain Digital Power Utility Market estimates & forecasts by segment 2020-2030 (USD Billion)
- TABLE 35. Spain Digital Power Utility Market estimates & forecasts by segment 2020-2030 (USD Billion)
- TABLE 36. RoE Digital Power Utility Market estimates & forecasts, 2020-2030 (USD Billion)
- TABLE 37. RoE Digital Power Utility Market estimates & forecasts by segment 2020-2030 (USD Billion)
- TABLE 38. RoE Digital Power Utility Market estimates & forecasts by segment 2020-2030 (USD Billion)
- TABLE 39. China Digital Power Utility Market estimates & forecasts, 2020-2030 (USD Billion)
- TABLE 40. China Digital Power Utility Market estimates & forecasts by segment 2020-2030 (USD Billion)
- TABLE 41. China Digital Power Utility Market estimates & forecasts by segment 2020-2030 (USD Billion)
- TABLE 42. India Digital Power Utility Market estimates & forecasts, 2020-2030 (USD Billion)
- TABLE 43. India Digital Power Utility Market estimates & forecasts by segment 2020-2030 (USD Billion)
- TABLE 44. India Digital Power Utility Market estimates & forecasts by segment 2020-2030 (USD Billion)
- TABLE 45. Japan Digital Power Utility Market estimates & forecasts, 2020-2030 (USD Billion)
- TABLE 46. Japan Digital Power Utility Market estimates & forecasts by segment 2020-2030 (USD Billion)
- TABLE 47. Japan Digital Power Utility Market estimates & forecasts by segment 2020-2030 (USD Billion)
- TABLE 48. South Korea Digital Power Utility Market estimates & forecasts, 2020-2030 (USD Billion)
- TABLE 49. South Korea Digital Power Utility Market estimates & forecasts by segment 2020-2030 (USD Billion)
- TABLE 50. South Korea Digital Power Utility Market estimates & forecasts by segment 2020-2030 (USD Billion)
- TABLE 51. Australia Digital Power Utility Market estimates & forecasts, 2020-2030 (USD Billion)
- TABLE 52. Australia Digital Power Utility Market estimates & forecasts by segment 2020-2030 (USD Billion)
- TABLE 53. Australia Digital Power Utility Market estimates & forecasts by segment 2020-2030 (USD Billion)
- TABLE 54. RoAPAC Digital Power Utility Market estimates & forecasts, 2020-2030 (USD Billion)
- TABLE 55. RoAPAC Digital Power Utility Market estimates & forecasts by segment 2020-2030 (USD Billion)
- TABLE 56. RoAPAC Digital Power Utility Market estimates & forecasts by segment 2020-2030 (USD Billion)
- TABLE 57. Brazil Digital Power Utility Market estimates & forecasts, 2020-2030 (USD Billion)
- TABLE 58. Brazil Digital Power Utility Market estimates & forecasts by segment 2020-2030 (USD Billion)
- TABLE 59. Brazil Digital Power Utility Market estimates & forecasts by segment 2020-2030 (USD Billion)
- TABLE 60. Mexico Digital Power Utility Market estimates & forecasts, 2020-2030 (USD Billion)
- TABLE 61. Mexico Digital Power Utility Market estimates & forecasts by segment 2020-2030 (USD Billion)
- TABLE 62. Mexico Digital Power Utility Market estimates & forecasts by segment 2020-2030 (USD Billion)
- TABLE 63. RoLA Digital Power Utility Market estimates & forecasts, 2020-2030 (USD Billion)
- TABLE 64. RoLA Digital Power Utility Market estimates & forecasts by segment 2020-2030 (USD Billion)
- TABLE 65. RoLA Digital Power Utility Market estimates & forecasts by segment 2020-2030 (USD Billion)
- TABLE 66. Saudi Arabia Digital Power Utility Market estimates & forecasts, 2020-2030 (USD Billion)
- TABLE 67. South Africa Digital Power Utility Market estimates & forecasts by segment 2020-2030 (USD Billion)
- TABLE 68. RoMEA Digital Power Utility Market estimates & forecasts by segment 2020-2030 (USD Billion)
- TABLE 69. List of secondary sources, used in the study of global Digital Power Utility Market
- TABLE 70. List of primary sources, used in the study of global Digital Power Utility Market
- TABLE 71. Years considered for the study
- TABLE 72. Exchange rates considered
List of tables and figures and dummy in nature, final lists may vary in the final deliverable
LIST OF FIGURES
- FIG 1. Global Digital Power Utility Market, research methodology
- FIG 2. Global Digital Power Utility Market, Market estimation techniques
- FIG 3. Global Market size estimates & forecast methods
- FIG 4. Global Digital Power Utility Market, key trends 2022
- FIG 5. Global Digital Power Utility Market, growth prospects 2023-2030
- FIG 6. Global Digital Power Utility Market, porters 5 force model
- FIG 7. Global Digital Power Utility Market, pest analysis
- FIG 8. Global Digital Power Utility Market, value chain analysis
- FIG 9. Global Digital Power Utility Market by segment, 2020 & 2030 (USD Billion)
- FIG 10. Global Digital Power Utility Market by segment, 2020 & 2030 (USD Billion)
- FIG 11. Global Digital Power Utility Market by segment, 2020 & 2030 (USD Billion)
- FIG 12. Global Digital Power Utility Market by segment, 2020 & 2030 (USD Billion)
- FIG 13. Global Digital Power Utility Market by segment, 2020 & 2030 (USD Billion)
- FIG 14. Global Digital Power Utility Market, regional snapshot 2020 & 2030
- FIG 15. North America Digital Power Utility Market 2020 & 2030 (USD Billion)
- FIG 16. Europe Digital Power Utility Market 2020 & 2030 (USD Billion)
- FIG 17. Asia pacific Digital Power Utility Market 2020 & 2030 (USD Billion)
- FIG 18. Latin America Digital Power Utility Market 2020 & 2030 (USD Billion)
- FIG 19. Middle East & Africa Digital Power Utility Market 2020 & 2030 (USD Billion)
List of tables and figures and dummy in nature, final lists may vary in the final deliverable


