


 |
市場調查報告書
商品編碼
1215351
全球遊戲應用程序市場規模研究和預測:按市場(Google Play 商店、Apple iOS 商店)、區域分析,2022-2029 年Global Game Applications Market Size study & Forecast, by Marketplace (Google Play Store, Apple iOS Store) and Regional Analysis, 2022-2029 |
||||||
2021 年全球遊戲應用市場價值約為 1003.6 億美元,預計在 2022-2029 年預測期內將以超過 13.3% 的健康增長率增長。
遊戲應用程序是指旨在通過圖形遊戲來娛樂用戶的軟件應用程序。 遊戲應用程序的用戶與模擬虛構人物的圖形對象交互,這些虛構人物是遊戲背景故事的組成部分。 此外,遊戲不僅用於娛樂目的,還用於教育、商業和醫療保健等其他領域。 智能手機在全球範圍內的普及、高速互聯網服務的興起以及大公司的戰略舉措是加速市場增長的主要因素。
由於移動技術的快速發展,智能手機的普及推動了全球遊戲應用市場的增長。 例如,根據 Statista 的數據,2021 年全球智能手機市場價值 4812 億美元,預計到 2026 年將增長到 5000 億美元。 而根據印度品牌資產基金會 (IBEF) 的數據,2021 年印度智能手機出貨量將增長 11% 至 1.69 億部,市場收入將達到 380 億美元。 智能手機技術的進步和數字娛樂的使用增加也有望在預測期內為市場創造良好的增長前景。 然而,對數據隱私的日益關注將阻礙整個 2022-2029 年預測期內的市場增長。
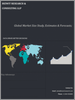
全球遊戲應用市場研究中考慮的主要區域是亞太地區、北美、歐洲、拉丁美洲和世界其他地區。 由於該地區主要市場參與者的存在以及社交媒體整合的日益普及,北美在收入方面佔據了市場主導地位。 另一方面,由於低成本互聯網服務的擴張以及具有低成本高速互聯網服務的智能手機的普及率不斷提高,預計亞太地區在預測期內將以最高複合年增長率增長。
這項研究的目的是定義近年來各個細分市場和國家/地區的市場規模,並預測它們在未來幾年的價值。 本報告旨在捕捉被調查國家行業的定性和定量方面的情況。
它還提供了關鍵方面的詳細信息,例如決定市場未來增長的驅動因素和挑戰。 此外,它還包含供利益相關者投資的微觀市場潛在機會,以及對主要參與者的競爭格局和產品供應的深入分析。
按市場
Google Play 商店
蘋果 iOS 商店
內容
第 1 章執行摘要
- 市場概況
- 2019-2029 年各細分市場的全球市場估計和預測
- 2019-2029 年按地區劃分的遊戲應用市場
- 遊戲應用市場,按市場劃分,2019 年至 2029 年
- 主要趨勢
- 調查方法
- 調查先決條件
第2章遊戲應用的全球市場定義和範圍
- 調查的目的
- 市場定義和範圍
- 調查範圍
- 工業發展
- 調查年份
- 貨幣兌換率
第三章全球遊戲應用市場動態
- 遊戲應用市場影響分析(2019-2029)
- 市場驅動力
- 全球智能手機普及率上升
- 高速互聯網服務的興起
- 主要市場參與者的戰略舉措
- 市場挑戰
- 對數據隱私的擔憂日益增加
- 市場機會
- 智能手機技術的發展
- 數字娛樂的使用範圍擴大
- 市場驅動力
第四章全球遊戲應用市場行業分析
- 波特 5 力模型
- 供應商的議價能力
- 買家的議價能力
- 新進入者的威脅
- 替代品的威脅
- 競爭公司之間的敵對關係
- 波特 5 力模型的未來方法 (2019-2029)
- 害蟲分析
- 政治
- 經濟的
- 社交
- 技術
- 頂級投資機會
- 關鍵成功策略
- 行業專家的展望
- 分析師的結論和建議
第 5 章風險評估:COVID-19 的影響
- 評估 COVID-19 對行業的總體影響
- COVID-19 之前和 COVID-19 之後的市場情景
第 6 章全球遊戲應用市場,按市場分類
- 市場概況
- 全球遊戲應用市場:按市場分類),性能潛力分析
- 2019-2029 年全球遊戲應用市場、按市場分類的估計和預測
- 遊戲應用市場、細分市場分析
- Google Play 商店
- Apple iOS 商店
第 7 章:全球遊戲應用市場:區域分析
- 遊戲應用市場,按地區劃分的市場概況
- 北美
- 美國
- 按市場估算和預測,2019 年至 2029 年
- 加拿大
- 美國
- 歐洲遊戲應用市場概況
- 英國
- 德國
- 法國
- 西班牙
- 意大利
- 其他歐洲地區
- 亞太遊戲應用市場概況
- 中國
- 印度
- 日本
- 澳大利亞
- 韓國
- 其他亞太地區
- 拉丁美洲遊戲應用市場概況
- 巴西
- 墨西哥
- 其他拉丁美洲地區
- 世界其他地方
第 8 章衝突信息
- 頂級市場策略
- 公司簡介
- 騰訊控股有限公司
- 主要信息
- 概覽
- 財務信息(取決於數據可用性)
- 產品概述
- 近期趨勢
- Nintendo
- Activision Blizzard
- Ubisoft
- Electronic Arts Inc.
- Take-Two Interactive Software, Inc.
- Bethesda Softworks LLC
- Zynga Inc
- Epic Games, Inc.
- NetEase, Inc.
- 騰訊控股有限公司
第 9 章研究過程
- 研究過程
- 數據挖掘
- 分析
- 市場評估
- 驗證
- 出版
- 調查屬性
- 調查先決條件
Global Game Applications Market is valued at approximately USD 100.36 billion in 2021 and is anticipated to grow with a healthy growth rate of more than 13.3% over the forecast period 2022-2029. Game Applications refers to software application, intended to entertain users through graphic games. The user of the gaming application interacts with graphical objects that simulate imaginary characters that are an integral part of the background story of the game. Moreover, apart from entertainment purposes games are also developed for other domains such as education, business, and healthcare applications. The penetration of smartphones worldwide and rising emergence of high-speed internet services as well as strategic initiatives from leading market players are key factors accelerating the market growth.
The growing penetration of smartphones due to rapid growth in mobile technology is contributing to the growth of the Global Game Applications Market. For instance, according to Statista - in 2021, the global smartphone market was valued at USD 481.2 billion, and the market is projected to grow to USD 500 billion by 2026. In addition, as per the India Brand Equity Foundation (IBEF)- in 2021, India's smartphone shipments increased by 11% to 169 million units, and market revenue reached USD 38 billion. Also, rising advancements in smartphone technology and increasing usage of digital entertainment would create a lucrative growth prospectus for the market over the forecast period. However, rising concern over data privacy stifles market growth throughout the forecast period of 2022-2029.
The key regions considered for the Global Game Applications Market study include Asia Pacific, North America, Europe, Latin America, and Rest of the World. North America dominated the market in terms of revenue, owing to the presence of leading market players as well as growing adoption of social media integrations in the region. Whereas Asia Pacific is expected to grow with the highest CAGR during the forecast period, owing to factors such as rising expansion of low-cost internet services, and increasing penetration of smartphones with low-cost high-speed internet services in the region.
Major market players included in this report are:
Tencent Holding Ltd
Nintendo
Activision Blizzard
Ubisoft
Electronic Arts Inc.
Take-Two Interactive Software, Inc.
Bethesda Softworks LLC
Zynga Inc.
Epic Games, Inc.
NetEase, Inc.
Recent Developments in the Market:
- In January 2022, Chinese entertainment and tech group Tencent Holdings announced acquisition of UK based Sumo Group for a transaction value of USD 1.25 billion. This acquisition would enable Tencent to expand its presence in Europe region.
- In August 2022, China based NetEase, Inc., a leader in internet and online game services announced that its games division, NetEase Games, acquired Quantic Dream S.A.
Global Game Applications Market Report Scope:
Historical Data: 2019-2020-2021
Base Year for Estimation: 2021
Forecast period: 2022-2029
Report Coverage: Revenue forecast, Company Ranking, Competitive Landscape, Growth factors, and Trends
Segments Covered: Marketplace, Region
Regional Scope: North America; Europe; Asia Pacific; Latin America; Rest of the World
Customization Scope: Free report customization (equivalent up to 8 analyst's working hours) with purchase. Addition or alteration to country, regional & segment scope*
The objective of the study is to define market sizes of different segments & countries in recent years and to forecast the values to the coming years. The report is designed to incorporate both qualitative and quantitative aspects of the industry within countries involved in the study.
The report also caters detailed information about the crucial aspects such as driving factors & challenges which will define the future growth of the market. Additionally, it also incorporates potential opportunities in micro markets for stakeholders to invest along with the detailed analysis of competitive landscape and product offerings of key players. The detailed segments and sub-segment of the market are explained below:
By Marketplace
Google Play Store
Apple iOS Store
By Region:
North America
U.S.
Canada
Europe
UK
Germany
France
Spain
Italy
ROE
Asia Pacific
China
India
Japan
Australia
South Korea
RoAPAC
Latin America
Brazil
Mexico
RoLA
Rest of the World
Table of Contents
Chapter 1. Executive Summary
- 1.1. Market Snapshot
- 1.2. Global & Segmental Market Estimates & Forecasts, 2019-2029 (USD Billion)
- 1.2.1. Game Applications Market, by Region, 2019-2029 (USD Billion)
- 1.2.2. Game Applications Market, by Marketplace, 2019-2029 (USD Billion)
- 1.3. Key Trends
- 1.4. Estimation Methodology
- 1.5. Research Assumption
Chapter 2. Global Game Applications Market Definition and Scope
- 2.1. Objective of the Study
- 2.2. Market Definition & Scope
- 2.2.1. Scope of the Study
- 2.2.2. Industry Evolution
- 2.3. Years Considered for the Study
- 2.4. Currency Conversion Rates
Chapter 3. Global Game Applications Market Dynamics
- 3.1. Game Applications Market Impact Analysis (2019-2029)
- 3.1.1. Market Drivers
- 3.1.1.1. Growing penetration of smartphones worldwide
- 3.1.1.2. Rising emergence of high-speed internet services
- 3.1.1.3. Strategic initiatives from leading market players
- 3.1.2. Market Challenges
- 3.1.2.1. Rising concern over data privacy
- 3.1.3. Market Opportunities
- 3.1.3.1. Rising advancement in smartphone technology
- 3.1.3.2. Increasing usage of digital entertainment
- 3.1.1. Market Drivers
Chapter 4. Global Game Applications Market Industry Analysis
- 4.1. Porter's 5 Force Model
- 4.1.1. Bargaining Power of Suppliers
- 4.1.2. Bargaining Power of Buyers
- 4.1.3. Threat of New Entrants
- 4.1.4. Threat of Substitutes
- 4.1.5. Competitive Rivalry
- 4.2. Futuristic Approach to Porter's 5 Force Model (2019-2029)
- 4.3. PEST Analysis
- 4.3.1. Political
- 4.3.2. Economical
- 4.3.3. Social
- 4.3.4. Technological
- 4.4. Top investment opportunity
- 4.5. Top winning strategies
- 4.6. Industry Experts Prospective
- 4.7. Analyst Recommendation & Conclusion
Chapter 5. Risk Assessment: COVID-19 Impact
- 5.1. Assessment of the overall impact of COVID-19 on the industry
- 5.2. Pre COVID-19 and post COVID-19 Market scenario
Chapter 6. Global Game Applications Market, by Marketplace
- 6.1. Market Snapshot
- 6.2. Global Game Applications Market by Marketplace, Performance - Potential Analysis
- 6.3. Global Game Applications Market Estimates & Forecasts by Marketplace 2019-2029 (USD Billion)
- 6.4. Game Applications Market, Sub Segment Analysis
- 6.4.1. Google Play Store
- 6.4.2. Apple iOS Store
Chapter 7. Global Game Applications Market, Regional Analysis
- 7.1. Game Applications Market, Regional Market Snapshot
- 7.2. North America Game Applications Market
- 7.2.1. U.S. Game Applications Market
- 7.2.1.1. Marketplace breakdown estimates & forecasts, 2019-2029
- 7.2.2. Canada Game Applications Market
- 7.2.1. U.S. Game Applications Market
- 7.3. Europe Game Applications Market Snapshot
- 7.3.1. U.K. Game Applications Market
- 7.3.2. Germany Game Applications Market
- 7.3.3. France Game Applications Market
- 7.3.4. Spain Game Applications Market
- 7.3.5. Italy Game Applications Market
- 7.3.6. Rest of Europe Game Applications Market
- 7.4. Asia-Pacific Game Applications Market Snapshot
- 7.4.1. China Game Applications Market
- 7.4.2. India Game Applications Market
- 7.4.3. Japan Game Applications Market
- 7.4.4. Australia Game Applications Market
- 7.4.5. South Korea Game Applications Market
- 7.4.6. Rest of Asia Pacific Game Applications Market
- 7.5. Latin America Game Applications Market Snapshot
- 7.5.1. Brazil Game Applications Market
- 7.5.2. Mexico Game Applications Market
- 7.5.3. Rest of Latin America Game Applications Market
- 7.6. Rest of The World Game Applications Market
Chapter 8. Competitive Intelligence
- 8.1. Top Market Strategies
- 8.2. Company Profiles
- 8.2.1. Tencent Holdings Ltd.
- 8.2.1.1. Key Information
- 8.2.1.2. Overview
- 8.2.1.3. Financial (Subject to Data Availability)
- 8.2.1.4. Product Summary
- 8.2.1.5. Recent Developments
- 8.2.2. Nintendo
- 8.2.3. Activision Blizzard
- 8.2.4. Ubisoft
- 8.2.5. Electronic Arts Inc.
- 8.2.6. Take-Two Interactive Software, Inc.
- 8.2.7. Bethesda Softworks LLC
- 8.2.8. Zynga Inc
- 8.2.9. Epic Games, Inc.
- 8.2.10. NetEase, Inc.
- 8.2.1. Tencent Holdings Ltd.
Chapter 9. Research Process
- 9.1. Research Process
- 9.1.1. Data Mining
- 9.1.2. Analysis
- 9.1.3. Market Estimation
- 9.1.4. Validation
- 9.1.5. Publishing
- 9.2. Research Attributes
- 9.3. Research Assumption
LIST OF TABLES
- TABLE 1. Global Game Applications Market, report scope
- TABLE 2. Global Game Applications Market estimates & forecasts by Region 2019-2029 (USD Billion)
- TABLE 3. Global Game Applications Market estimates & forecasts by Marketplace 2019-2029 (USD Billion)
- TABLE 4. Global Game Applications Market by segment, estimates & forecasts, 2019-2029 (USD Billion)
- TABLE 5. Global Game Applications Market by region, estimates & forecasts, 2019-2029 (USD Billion)
- TABLE 6. Global Game Applications Market by segment, estimates & forecasts, 2019-2029 (USD Billion)
- TABLE 7. Global Game Applications Market by region, estimates & forecasts, 2019-2029 (USD Billion)
- TABLE 8. Global Game Applications Market by segment, estimates & forecasts, 2019-2029 (USD Billion)
- TABLE 9. Global Game Applications Market by region, estimates & forecasts, 2019-2029 (USD Billion)
- TABLE 10. Global Game Applications Market by segment, estimates & forecasts, 2019-2029 (USD Billion)
- TABLE 11. Global Game Applications Market by region, estimates & forecasts, 2019-2029 (USD Billion)
- TABLE 12. Global Game Applications Market by segment, estimates & forecasts, 2019-2029 (USD Billion)
- TABLE 13. Global Game Applications Market by region, estimates & forecasts, 2019-2029 (USD Billion)
- TABLE 14. U.S. Game Applications Market estimates & forecasts, 2019-2029 (USD Billion)
- TABLE 15. U.S. Game Applications Market estimates & forecasts by segment 2019-2029 (USD Billion)
- TABLE 16. U.S. Game Applications Market estimates & forecasts by segment 2019-2029 (USD Billion)
- TABLE 17. Canada Game Applications Market estimates & forecasts, 2019-2029 (USD Billion)
- TABLE 18. Canada Game Applications Market estimates & forecasts by segment 2019-2029 (USD Billion)
- TABLE 19. Canada Game Applications Market estimates & forecasts by segment 2019-2029 (USD Billion)
- TABLE 20. UK Game Applications Market estimates & forecasts, 2019-2029 (USD Billion)
- TABLE 21. UK Game Applications Market estimates & forecasts by segment 2019-2029 (USD Billion)
- TABLE 22. UK Game Applications Market estimates & forecasts by segment 2019-2029 (USD Billion)
- TABLE 23. Germany Game Applications Market estimates & forecasts, 2019-2029 (USD Billion)
- TABLE 24. Germany Game Applications Market estimates & forecasts by segment 2019-2029 (USD Billion)
- TABLE 25. Germany Game Applications Market estimates & forecasts by segment 2019-2029 (USD Billion)
- TABLE 26. France Game Applications Market estimates & forecasts, 2019-2029 (USD Billion)
- TABLE 27. France Game Applications Market estimates & forecasts by segment 2019-2029 (USD Billion)
- TABLE 28. France Game Applications Market estimates & forecasts by segment 2019-2029 (USD Billion)
- TABLE 29. Italy Game Applications Market estimates & forecasts, 2019-2029 (USD Billion)
- TABLE 30. Italy Game Applications Market estimates & forecasts by segment 2019-2029 (USD Billion)
- TABLE 31. Italy Game Applications Market estimates & forecasts by segment 2019-2029 (USD Billion)
- TABLE 32. Spain Game Applications Market estimates & forecasts, 2019-2029 (USD Billion)
- TABLE 33. Spain Game Applications Market estimates & forecasts by segment 2019-2029 (USD Billion)
- TABLE 34. Spain Game Applications Market estimates & forecasts by segment 2019-2029 (USD Billion)
- TABLE 35. RoE Game Applications Market estimates & forecasts, 2019-2029 (USD Billion)
- TABLE 36. RoE Game Applications Market estimates & forecasts by segment 2019-2029 (USD Billion)
- TABLE 37. RoE Game Applications Market estimates & forecasts by segment 2019-2029 (USD Billion)
- TABLE 38. China Game Applications Market estimates & forecasts, 2019-2029 (USD Billion)
- TABLE 39. China Game Applications Market estimates & forecasts by segment 2019-2029 (USD Billion)
- TABLE 40. China Game Applications Market estimates & forecasts by segment 2019-2029 (USD Billion)
- TABLE 41. India Game Applications Market estimates & forecasts, 2019-2029 (USD Billion)
- TABLE 42. India Game Applications Market estimates & forecasts by segment 2019-2029 (USD Billion)
- TABLE 43. India Game Applications Market estimates & forecasts by segment 2019-2029 (USD Billion)
- TABLE 44. Japan Game Applications Market estimates & forecasts, 2019-2029 (USD Billion)
- TABLE 45. Japan Game Applications Market estimates & forecasts by segment 2019-2029 (USD Billion)
- TABLE 46. Japan Game Applications Market estimates & forecasts by segment 2019-2029 (USD Billion)
- TABLE 47. South Korea Game Applications Market estimates & forecasts, 2019-2029 (USD Billion)
- TABLE 48. South Korea Game Applications Market estimates & forecasts by segment 2019-2029 (USD Billion)
- TABLE 49. South Korea Game Applications Market estimates & forecasts by segment 2019-2029 (USD Billion)
- TABLE 50. Australia Game Applications Market estimates & forecasts, 2019-2029 (USD Billion)
- TABLE 51. Australia Game Applications Market estimates & forecasts by segment 2019-2029 (USD Billion)
- TABLE 52. Australia Game Applications Market estimates & forecasts by segment 2019-2029 (USD Billion)
- TABLE 53. RoAPAC Game Applications Market estimates & forecasts, 2019-2029 (USD Billion)
- TABLE 54. RoAPAC Game Applications Market estimates & forecasts by segment 2019-2029 (USD Billion)
- TABLE 55. RoAPAC Game Applications Market estimates & forecasts by segment 2019-2029 (USD Billion)
- TABLE 56. Brazil Game Applications Market estimates & forecasts, 2019-2029 (USD Billion)
- TABLE 57. Brazil Game Applications Market estimates & forecasts by segment 2019-2029 (USD Billion)
- TABLE 58. Brazil Game Applications Market estimates & forecasts by segment 2019-2029 (USD Billion)
- TABLE 59. Mexico Game Applications Market estimates & forecasts, 2019-2029 (USD Billion)
- TABLE 60. Mexico Game Applications Market estimates & forecasts by segment 2019-2029 (USD Billion)
- TABLE 61. Mexico Game Applications Market estimates & forecasts by segment 2019-2029 (USD Billion)
- TABLE 62. RoLA Game Applications Market estimates & forecasts, 2019-2029 (USD Billion)
- TABLE 63. RoLA Game Applications Market estimates & forecasts by segment 2019-2029 (USD Billion)
- TABLE 64. RoLA Game Applications Market estimates & forecasts by segment 2019-2029 (USD Billion)
- TABLE 65. Row Game Applications Market estimates & forecasts, 2019-2029 (USD Billion)
- TABLE 66. Row Game Applications Market estimates & forecasts by segment 2019-2029 (USD Billion)
- TABLE 67. Row Game Applications Market estimates & forecasts by segment 2019-2029 (USD Billion)
- TABLE 68. List of secondary sources, used in the study of global Game Applications Market
- TABLE 69. List of primary sources, used in the study of global Game Applications Market
- TABLE 70. Years considered for the study
- TABLE 71. Exchange rates considered
List of tables and figures and dummy in nature, final lists may vary in the final deliverable
LIST OF FIGURES
List of figures
- FIG 1. Global Game Applications Market, research methodology
- FIG 2. Global Game Applications Market, Market estimation techniques
- FIG 3. Global Market size estimates & forecast methods
- FIG 4. Global Game Applications Market, key trends 2021
- FIG 5. Global Game Applications Market, growth prospects 2022-2029
- FIG 6. Global Game Applications Market, porters 5 force model
- FIG 7. Global Game Applications Market, pest analysis
- FIG 8. Global Game Applications Market, value chain analysis
- FIG 9. Global Game Applications Market by segment, 2019 & 2029 (USD Billion)
- FIG 10. Global Game Applications Market by segment, 2019 & 2029 (USD Billion)
- FIG 11. Global Game Applications Market by segment, 2019 & 2029 (USD Billion)
- FIG 12. Global Game Applications Market by segment, 2019 & 2029 (USD Billion)
- FIG 13. Global Game Applications Market by segment, 2019 & 2029 (USD Billion)
- FIG 14. Global Game Applications Market, regional snapshot 2019 & 2029
- FIG 15. North America Game Applications Market 2019 & 2029 (USD Billion)
- FIG 16. Europe Game Applications Market 2019 & 2029 (USD Billion)
- FIG 17. Asia Pacific Game Applications Market 2019 & 2029 (USD Billion)
- FIG 18. Latin America Game Applications Market 2019 & 2029 (USD Billion)
- FIG 19. Global Game Applications Market, company Market share analysis (2021)
List of tables and figures and dummy in nature, final lists may vary in the final deliverable
 2024-2028年全球桌上遊戲市場
 Web3 市場:2023 年至 2028 年預測
 全球社交賭場市場評估
 集換式卡牌遊戲市場 - 全球產業規模、佔有率、趨勢、機會和預測,按年齡類型、卡牌類型、配銷通路、地區、競爭細分,2018-2028 年
 2024-2028 年遊戲人工智慧的全球市場
 全球桌遊市場 - 2023-2030
 大逃殺遊戲市場報告:2030 年趨勢、預測與競爭分析
 全球遊戲應用市場報告
 2022年至2028年全球桌面遊戲市場規模、份額、行業趨勢分析報告,按類型(角色扮演遊戲、微型戰爭遊戲)、分銷渠道、應用(成人、家庭、兒童、派對)、區域展望和預測
 桌上遊戲的全球市場 - 預測與展望(2023年~2028年)