


 |
市場調查報告書
商品編碼
1365710
物理治療設備市場:按類型、用途和最終用戶分類:2023-2032 年全球機會分析和產業預測Physiotherapy Equipment Market By Type (Equipment, Accessories), By Applications (Musculoskeletal, Neurology, Other), By End User (Hospitals, Physiotherapy & Rehabilitaion Center, Others): Global Opportunity Analysis & Industry Forecast, 2023-2032 |
||||||
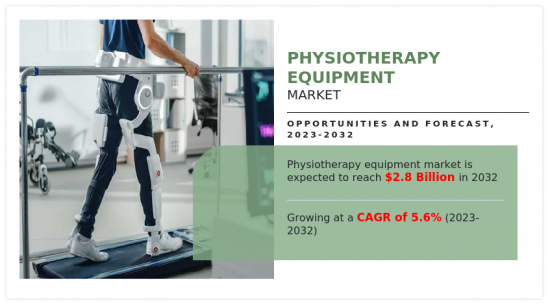
2022年,物理治療設備市場價值為16億美元,預計2023年至2032年年複合成長率為5.6%,到2032年達到28億美元。
物理治療設備市場的成長是由於製造物理治療設備的市場參與企業的大量存在、關節炎患病的上升以及人們對物理治療有效性的認知不斷提高而推動的。物理治療師使用多種類型的設備和機器來治療和改善各種病症,從輕度痙攣到慢性疼痛、老年關節炎、癌症等。物理治療設備透過促進血液流動並加速組織、肌腱、肌肉等的癒合過程來達到目標。它還可以改善狹窄關節的活動能力。因此,對物理治療設備的需求不斷增加預計將推動市場成長。
例如,根據世界衛生組織(WHO)統計,截至2023年6月,全球有1,800萬人患有類風濕性關節炎。大約70%的類風濕性關節炎患者是女性,其中55%年齡在55歲以上。 1,300 萬類風濕性關節炎患者的病情嚴重程度(中度或重度),可以從復健中受益。
目錄
第1章 簡介
第2章 執行摘要
第3章 市場概況
- 市場定義和範圍
- 主要發現
- 影響要素
- 主要投資機會
- 波特五力分析
- 市場動態
- 促進因素
- 慢性病增加
- 整形外科手術數量增加
- 老年人口增加
- 抑制因素
- 物理治療設備高成本
- 機會
- 擁有最先進的物理治療設備
- 促進因素
第4章 物理治療設備市場:依類型
- 概述
- 裝置
- 配件
第5章 物理治療設備市場:依用途
- 概述
- 肌肉骨骼系統
- 神經
- 其他
第6章 物理治療設備市場:依最終使用者分類
- 概述
- 醫院
- 物理治療/復健中心
- 其他
第7章 物理治療設備市場:依地區
- 概述
- 北美洲
- 美國
- 加拿大
- 墨西哥
- 歐洲
- 德國
- 法國
- 英國
- 義大利
- 西班牙
- 其他
- 亞太地區
- 日本
- 中國
- 印度
- 澳洲
- 韓國
- 其他
- 拉丁美洲/中東/非洲
- 巴西
- 沙烏地阿拉伯
- 南非
- 其他
第8章 競爭形勢
- 介紹
- 關鍵成功策略
- 10家主要企業產品圖譜
- 競爭儀表板
- 競爭熱圖
- 2022年主要企業定位
第9章 公司簡介
- EMS Physio Ltd.
- BTL Corporate
- Zynex Medical Inc.
- Enraf-Nonius BV
- Zimmer MedizinSysteme GmbH
- Dynatronics Corporation
- Storz Medical AG
- Richmar
- Performance Health
- Enovis Corporation
According to a new report published by Allied Market Research, titled, "Physiotherapy Equipment Market," The physiotherapy equipment market was valued at $1.6 billion in 2022, and is estimated to reach $2.8 billion by 2032, growing at a CAGR of 5.6% from 2023 to 2032.
The physiotherapy equipment market growth is driven by high presence of market players who manufacture physiotherapy equipment, rise in prevalence of arthritis, and increase in awareness among the people regarding effectiveness of physiotherapy. Physiotherapists use several kinds of equipment and machines for the treatment & betterment of different kinds of conditions spanning mild spasms to chronic pain to old age arthritis, cancerous conditions, and others. Physiotherapy equipment is used to achieve the objective via enhancement of blood flow, quickening of the healing process of tissues, tendons, muscles, and others. , and/or improvement of mobility in constricted joints. Thus, rise in demand for physiotherapy equipment is expected to boost the growth of market.
For instance, according to the World Health Organization, (WHO), in June 2023, it was reported that 18 million people worldwide were living with rheumatoid arthritis. About 70% of people living with rheumatoid arthritis are women, and 55% are older than 55 years. 13 million people with rheumatoid arthritis experience severity levels (moderate or severe) that could benefit from rehabilitation.
In addition, rise in geriatric population is anticipated to drive the growth physiotherapy equipment market. As geriatric population is more susceptible to orthopedic diseases and joint injuries, it is expected to increase the need of physiotherapy for treatment purposes. Thus, rise in number of geriatric populations is anticipated to increase in demand of physiotherapy for treatment purpose. Thus, this factor is expected to fuel the demand physiotherapy equipment and boost the growth of market. For instance, according to the World Health Organization (WHO), it was estimated that, by 2030, 1 in 6 people in the world will be aged 60 years or over. At this time, the share of the population aged 60 years and over will increase from 1 billion in 2020 to 1.4 billion. By 2050, the world's population of people aged 60 years and older will double (2.1 billion). The number of persons aged 80 years or older is expected to triple between 2020 and 2050 to reach 426 million.
The physiotherapy equipment market is segmented into type, application, end user, and region. By type, the market is segmented into equipment and accessories. By application, the market is divided into musculoskeletal, neurology and others. By end user, the market is classified into hospital, physiotherapy and rehabilitation center and others. Others include home care setting and specialty clinics.
Region-wise, the market is analyzed across North America (U.S., Canada, and Mexico), Europe (Germany, France, UK, Italy, Spain, and rest of Europe), Asia-Pacific (China, Japan, India, Australia, South Korea, and rest of Asia-Pacific), and LAMEA (Brazil, Saudi Arabia, South Africa, and rest of LAMEA).
Major key players that operate in the global physiotherapy equipment market are EMS Physio Ltd, Enraf-Nonius B.V., Zimmer MedizinSysteme GmbH, Dynatronics Corporation, Performance Health, BTL Corporate, Storz Medical AG., Richmar, Enovis Corporation, Zynex Medical Inc. Key players operating in the market have adopted product approval, product launch, acquisition and agreement as their key strategies to expand their physiotherapy equipment market share.
Key Benefits For Stakeholders
- This report provides a quantitative analysis of the market segments, current trends, estimations, and dynamics of the physiotherapy equipment market analysis from 2022 to 2032 to identify the prevailing physiotherapy equipment market opportunities.
- The market research is offered along with information related to key drivers, restraints, and opportunities.
- Porter's five forces analysis highlights the potency of buyers and suppliers to enable stakeholders make profit-oriented business decisions and strengthen their supplier-buyer network.
- In-depth analysis of the physiotherapy equipment market segmentation assists to determine the prevailing market opportunities.
- Major countries in each region are mapped according to their revenue contribution to the global market.
- Market player positioning facilitates benchmarking and provides a clear understanding of the present position of the market players.
- The report includes the analysis of the regional as well as global physiotherapy equipment market trends, key players, market segments, application areas, and market growth strategies.
Additional benefits you will get with this purchase are:
- Quarterly Update and* (only available with a corporate license, on listed price)
- 5 additional Company Profile of client Choice pre- or Post-purchase, as a free update.
- Free Upcoming Version on the Purchase of Five and Enterprise User License.
- 16 analyst hours of support* (post-purchase, if you find additional data requirements upon review of the report, you may receive support amounting to 16 analyst hours to solve questions, and post-sale queries)
- 15% Free Customization* (in case the scope or segment of the report does not match your requirements, 20% is equivalent to 3 working days of free work, applicable once)
- Free data Pack on the Five and Enterprise User License. (Excel version of the report)
- Free Updated report if the report is 6-12 months old or older.
- 24-hour priority response*
- Free Industry updates and white papers.
Possible Customization with this report (with additional cost and timeline talk to the sales executive to know more)
- Product Benchmarking / Product specification and applications
- Upcoming/New Entrant by Regions
- New Product Development/ Product Matrix of Key Players
- Patient/epidemiology data at country, region, global level
- Additional company profiles with specific to client's interest
- Additional country or region analysis- market size and forecast
- Expanded list for Company Profiles
- Historic market data
- SWOT Analysis
Key Market Segments
By Type
- Equipment
- Accessories
By Applications
- Musculoskeletal
- Neurology
- Other
By End User
- Hospitals
- Physiotherapy and Rehabilitaion Center
- Others
By Region
- North America
- U.S.
- Canada
- Mexico
- Europe
- Germany
- France
- UK
- Italy
- Spain
- Rest of Europe
- Asia-Pacific
- Japan
- China
- India
- Australia
- South Korea
- Rest of Asia-Pacific
- LAMEA
- Brazil
- Saudi Arabia
- South Africa
- Rest of LAMEA
Key Market Players:
- Enraf-Nonius B.V.
- Dynatronics Corporation
- Performance Health
- EMS Physio Ltd.
- Storz Medical AG
- Enovis Corporation
- Zynex Medical Inc.
- Zimmer MedizinSysteme GmbH
- BTL Corporate
- Richmar
TABLE OF CONTENTS
CHAPTER 1: INTRODUCTION
- 1.1. Report description
- 1.2. Key market segments
- 1.3. Key benefits to the stakeholders
- 1.4. Research Methodology
- 1.4.1. Primary research
- 1.4.2. Secondary research
- 1.4.3. Analyst tools and models
CHAPTER 2: EXECUTIVE SUMMARY
- 2.1. CXO Perspective
CHAPTER 3: MARKET OVERVIEW
- 3.1. Market definition and scope
- 3.2. Key findings
- 3.2.1. Top impacting factors
- 3.2.2. Top investment pockets
- 3.3. Porter's five forces analysis
- 3.3.1. Low bargaining power of suppliers
- 3.3.2. Low threat of new entrants
- 3.3.3. Low threat of substitutes
- 3.3.4. Low intensity of rivalry
- 3.3.5. Low bargaining power of buyers
- 3.4. Market dynamics
- 3.4.1. Drivers
- 3.4.1.1. Rise in prevalence of chronic diseases
- 3.4.1.2. Increase in number of orthopedic surgeries.
- 3.4.1.3. Rise in the number of geriatric populations.
- 3.4.1. Drivers
- 3.4.2. Restraints
- 3.4.2.1. High cost of physiotherapy equipment.
- 3.4.3. Opportunities
- 3.4.3.1. Availability of technologically advanced physiotherapy equipment.
CHAPTER 4: PHYSIOTHERAPY EQUIPMENT MARKET, BY TYPE
- 4.1. Overview
- 4.1.1. Market size and forecast
- 4.2. Equipment
- 4.2.1. Key market trends, growth factors and opportunities
- 4.2.2. Market size and forecast, by region
- 4.2.3. Market share analysis by country
- 4.3. Accessories
- 4.3.1. Key market trends, growth factors and opportunities
- 4.3.2. Market size and forecast, by region
- 4.3.3. Market share analysis by country
CHAPTER 5: PHYSIOTHERAPY EQUIPMENT MARKET, BY APPLICATIONS
- 5.1. Overview
- 5.1.1. Market size and forecast
- 5.2. Musculoskeletal
- 5.2.1. Key market trends, growth factors and opportunities
- 5.2.2. Market size and forecast, by region
- 5.2.3. Market share analysis by country
- 5.3. Neurology
- 5.3.1. Key market trends, growth factors and opportunities
- 5.3.2. Market size and forecast, by region
- 5.3.3. Market share analysis by country
- 5.4. Other
- 5.4.1. Key market trends, growth factors and opportunities
- 5.4.2. Market size and forecast, by region
- 5.4.3. Market share analysis by country
CHAPTER 6: PHYSIOTHERAPY EQUIPMENT MARKET, BY END USER
- 6.1. Overview
- 6.1.1. Market size and forecast
- 6.2. Hospitals
- 6.2.1. Key market trends, growth factors and opportunities
- 6.2.2. Market size and forecast, by region
- 6.2.3. Market share analysis by country
- 6.3. Physiotherapy and Rehabilitaion Center
- 6.3.1. Key market trends, growth factors and opportunities
- 6.3.2. Market size and forecast, by region
- 6.3.3. Market share analysis by country
- 6.4. Others
- 6.4.1. Key market trends, growth factors and opportunities
- 6.4.2. Market size and forecast, by region
- 6.4.3. Market share analysis by country
CHAPTER 7: PHYSIOTHERAPY EQUIPMENT MARKET, BY REGION
- 7.1. Overview
- 7.1.1. Market size and forecast By Region
- 7.2. North America
- 7.2.1. Key market trends, growth factors and opportunities
- 7.2.2. Market size and forecast, by Type
- 7.2.3. Market size and forecast, by Applications
- 7.2.4. Market size and forecast, by End User
- 7.2.5. Market size and forecast, by country
- 7.2.5.1. U.S.
- 7.2.5.1.1. Market size and forecast, by Type
- 7.2.5.1.2. Market size and forecast, by Applications
- 7.2.5.1.3. Market size and forecast, by End User
- 7.2.5.2. Canada
- 7.2.5.2.1. Market size and forecast, by Type
- 7.2.5.2.2. Market size and forecast, by Applications
- 7.2.5.2.3. Market size and forecast, by End User
- 7.2.5.3. Mexico
- 7.2.5.3.1. Market size and forecast, by Type
- 7.2.5.3.2. Market size and forecast, by Applications
- 7.2.5.3.3. Market size and forecast, by End User
- 7.3. Europe
- 7.3.1. Key market trends, growth factors and opportunities
- 7.3.2. Market size and forecast, by Type
- 7.3.3. Market size and forecast, by Applications
- 7.3.4. Market size and forecast, by End User
- 7.3.5. Market size and forecast, by country
- 7.3.5.1. Germany
- 7.3.5.1.1. Market size and forecast, by Type
- 7.3.5.1.2. Market size and forecast, by Applications
- 7.3.5.1.3. Market size and forecast, by End User
- 7.3.5.2. France
- 7.3.5.2.1. Market size and forecast, by Type
- 7.3.5.2.2. Market size and forecast, by Applications
- 7.3.5.2.3. Market size and forecast, by End User
- 7.3.5.3. UK
- 7.3.5.3.1. Market size and forecast, by Type
- 7.3.5.3.2. Market size and forecast, by Applications
- 7.3.5.3.3. Market size and forecast, by End User
- 7.3.5.4. Italy
- 7.3.5.4.1. Market size and forecast, by Type
- 7.3.5.4.2. Market size and forecast, by Applications
- 7.3.5.4.3. Market size and forecast, by End User
- 7.3.5.5. Spain
- 7.3.5.5.1. Market size and forecast, by Type
- 7.3.5.5.2. Market size and forecast, by Applications
- 7.3.5.5.3. Market size and forecast, by End User
- 7.3.5.6. Rest of Europe
- 7.3.5.6.1. Market size and forecast, by Type
- 7.3.5.6.2. Market size and forecast, by Applications
- 7.3.5.6.3. Market size and forecast, by End User
- 7.4. Asia-Pacific
- 7.4.1. Key market trends, growth factors and opportunities
- 7.4.2. Market size and forecast, by Type
- 7.4.3. Market size and forecast, by Applications
- 7.4.4. Market size and forecast, by End User
- 7.4.5. Market size and forecast, by country
- 7.4.5.1. Japan
- 7.4.5.1.1. Market size and forecast, by Type
- 7.4.5.1.2. Market size and forecast, by Applications
- 7.4.5.1.3. Market size and forecast, by End User
- 7.4.5.2. China
- 7.4.5.2.1. Market size and forecast, by Type
- 7.4.5.2.2. Market size and forecast, by Applications
- 7.4.5.2.3. Market size and forecast, by End User
- 7.4.5.3. India
- 7.4.5.3.1. Market size and forecast, by Type
- 7.4.5.3.2. Market size and forecast, by Applications
- 7.4.5.3.3. Market size and forecast, by End User
- 7.4.5.4. Australia
- 7.4.5.4.1. Market size and forecast, by Type
- 7.4.5.4.2. Market size and forecast, by Applications
- 7.4.5.4.3. Market size and forecast, by End User
- 7.4.5.5. South Korea
- 7.4.5.5.1. Market size and forecast, by Type
- 7.4.5.5.2. Market size and forecast, by Applications
- 7.4.5.5.3. Market size and forecast, by End User
- 7.4.5.6. Rest of Asia-Pacific
- 7.4.5.6.1. Market size and forecast, by Type
- 7.4.5.6.2. Market size and forecast, by Applications
- 7.4.5.6.3. Market size and forecast, by End User
- 7.5. LAMEA
- 7.5.1. Key market trends, growth factors and opportunities
- 7.5.2. Market size and forecast, by Type
- 7.5.3. Market size and forecast, by Applications
- 7.5.4. Market size and forecast, by End User
- 7.5.5. Market size and forecast, by country
- 7.5.5.1. Brazil
- 7.5.5.1.1. Market size and forecast, by Type
- 7.5.5.1.2. Market size and forecast, by Applications
- 7.5.5.1.3. Market size and forecast, by End User
- 7.5.5.2. Saudi Arabia
- 7.5.5.2.1. Market size and forecast, by Type
- 7.5.5.2.2. Market size and forecast, by Applications
- 7.5.5.2.3. Market size and forecast, by End User
- 7.5.5.3. South Africa
- 7.5.5.3.1. Market size and forecast, by Type
- 7.5.5.3.2. Market size and forecast, by Applications
- 7.5.5.3.3. Market size and forecast, by End User
- 7.5.5.4. Rest of LAMEA
- 7.5.5.4.1. Market size and forecast, by Type
- 7.5.5.4.2. Market size and forecast, by Applications
- 7.5.5.4.3. Market size and forecast, by End User
CHAPTER 8: COMPETITIVE LANDSCAPE
- 8.1. Introduction
- 8.2. Top winning strategies
- 8.3. Product Mapping of Top 10 Player
- 8.4. Competitive Dashboard
- 8.5. Competitive Heatmap
- 8.6. Top player positioning, 2022
CHAPTER 9: COMPANY PROFILES
- 9.1. EMS Physio Ltd.
- 9.1.1. Company overview
- 9.1.2. Key Executives
- 9.1.3. Company snapshot
- 9.1.4. Operating business segments
- 9.1.5. Product portfolio
- 9.2. BTL Corporate
- 9.2.1. Company overview
- 9.2.2. Key Executives
- 9.2.3. Company snapshot
- 9.2.4. Operating business segments
- 9.2.5. Product portfolio
- 9.3. Zynex Medical Inc.
- 9.3.1. Company overview
- 9.3.2. Key Executives
- 9.3.3. Company snapshot
- 9.3.4. Operating business segments
- 9.3.5. Product portfolio
- 9.3.6. Business performance
- 9.3.7. Key strategic moves and developments
- 9.4. Enraf-Nonius B.V.
- 9.4.1. Company overview
- 9.4.2. Key Executives
- 9.4.3. Company snapshot
- 9.4.4. Operating business segments
- 9.4.5. Product portfolio
- 9.5. Zimmer MedizinSysteme GmbH
- 9.5.1. Company overview
- 9.5.2. Key Executives
- 9.5.3. Company snapshot
- 9.5.4. Operating business segments
- 9.5.5. Product portfolio
- 9.6. Dynatronics Corporation
- 9.6.1. Company overview
- 9.6.2. Key Executives
- 9.6.3. Company snapshot
- 9.6.4. Operating business segments
- 9.6.5. Product portfolio
- 9.6.6. Business performance
- 9.7. Storz Medical AG
- 9.7.1. Company overview
- 9.7.2. Key Executives
- 9.7.3. Company snapshot
- 9.7.4. Operating business segments
- 9.7.5. Product portfolio
- 9.7.6. Key strategic moves and developments
- 9.8. Richmar
- 9.8.1. Company overview
- 9.8.2. Key Executives
- 9.8.3. Company snapshot
- 9.8.4. Operating business segments
- 9.8.5. Product portfolio
- 9.9. Performance Health
- 9.9.1. Company overview
- 9.9.2. Key Executives
- 9.9.3. Company snapshot
- 9.9.4. Operating business segments
- 9.9.5. Product portfolio
- 9.10. Enovis Corporation
- 9.10.1. Company overview
- 9.10.2. Key Executives
- 9.10.3. Company snapshot
- 9.10.4. Operating business segments
- 9.10.5. Product portfolio
- 9.10.6. Business performance
LIST OF TABLES
- TABLE 01. GLOBAL PHYSIOTHERAPY EQUIPMENT MARKET, BY TYPE, 2022-2032 ($MILLION)
- TABLE 02. PHYSIOTHERAPY EQUIPMENT MARKET FOR EQUIPMENT, BY REGION, 2022-2032 ($MILLION)
- TABLE 03. PHYSIOTHERAPY EQUIPMENT MARKET FOR ACCESSORIES, BY REGION, 2022-2032 ($MILLION)
- TABLE 04. GLOBAL PHYSIOTHERAPY EQUIPMENT MARKET, BY APPLICATIONS, 2022-2032 ($MILLION)
- TABLE 05. PHYSIOTHERAPY EQUIPMENT MARKET FOR MUSCULOSKELETAL, BY REGION, 2022-2032 ($MILLION)
- TABLE 06. PHYSIOTHERAPY EQUIPMENT MARKET FOR NEUROLOGY, BY REGION, 2022-2032 ($MILLION)
- TABLE 07. PHYSIOTHERAPY EQUIPMENT MARKET FOR OTHER, BY REGION, 2022-2032 ($MILLION)
- TABLE 08. GLOBAL PHYSIOTHERAPY EQUIPMENT MARKET, BY END USER, 2022-2032 ($MILLION)
- TABLE 09. PHYSIOTHERAPY EQUIPMENT MARKET FOR HOSPITALS, BY REGION, 2022-2032 ($MILLION)
- TABLE 10. PHYSIOTHERAPY EQUIPMENT MARKET FOR PHYSIOTHERAPY AND REHABILITAION CENTER, BY REGION, 2022-2032 ($MILLION)
- TABLE 11. PHYSIOTHERAPY EQUIPMENT MARKET FOR OTHERS, BY REGION, 2022-2032 ($MILLION)
- TABLE 12. PHYSIOTHERAPY EQUIPMENT MARKET, BY REGION, 2022-2032 ($MILLION)
- TABLE 13. NORTH AMERICA PHYSIOTHERAPY EQUIPMENT MARKET, BY TYPE, 2022-2032 ($MILLION)
- TABLE 14. NORTH AMERICA PHYSIOTHERAPY EQUIPMENT MARKET, BY APPLICATIONS, 2022-2032 ($MILLION)
- TABLE 15. NORTH AMERICA PHYSIOTHERAPY EQUIPMENT MARKET, BY END USER, 2022-2032 ($MILLION)
- TABLE 16. NORTH AMERICA PHYSIOTHERAPY EQUIPMENT MARKET, BY COUNTRY, 2022-2032 ($MILLION)
- TABLE 17. U.S. PHYSIOTHERAPY EQUIPMENT MARKET, BY TYPE, 2022-2032 ($MILLION)
- TABLE 18. U.S. PHYSIOTHERAPY EQUIPMENT MARKET, BY APPLICATIONS, 2022-2032 ($MILLION)
- TABLE 19. U.S. PHYSIOTHERAPY EQUIPMENT MARKET, BY END USER, 2022-2032 ($MILLION)
- TABLE 20. CANADA PHYSIOTHERAPY EQUIPMENT MARKET, BY TYPE, 2022-2032 ($MILLION)
- TABLE 21. CANADA PHYSIOTHERAPY EQUIPMENT MARKET, BY APPLICATIONS, 2022-2032 ($MILLION)
- TABLE 22. CANADA PHYSIOTHERAPY EQUIPMENT MARKET, BY END USER, 2022-2032 ($MILLION)
- TABLE 23. MEXICO PHYSIOTHERAPY EQUIPMENT MARKET, BY TYPE, 2022-2032 ($MILLION)
- TABLE 24. MEXICO PHYSIOTHERAPY EQUIPMENT MARKET, BY APPLICATIONS, 2022-2032 ($MILLION)
- TABLE 25. MEXICO PHYSIOTHERAPY EQUIPMENT MARKET, BY END USER, 2022-2032 ($MILLION)
- TABLE 26. EUROPE PHYSIOTHERAPY EQUIPMENT MARKET, BY TYPE, 2022-2032 ($MILLION)
- TABLE 27. EUROPE PHYSIOTHERAPY EQUIPMENT MARKET, BY APPLICATIONS, 2022-2032 ($MILLION)
- TABLE 28. EUROPE PHYSIOTHERAPY EQUIPMENT MARKET, BY END USER, 2022-2032 ($MILLION)
- TABLE 29. EUROPE PHYSIOTHERAPY EQUIPMENT MARKET, BY COUNTRY, 2022-2032 ($MILLION)
- TABLE 30. GERMANY PHYSIOTHERAPY EQUIPMENT MARKET, BY TYPE, 2022-2032 ($MILLION)
- TABLE 31. GERMANY PHYSIOTHERAPY EQUIPMENT MARKET, BY APPLICATIONS, 2022-2032 ($MILLION)
- TABLE 32. GERMANY PHYSIOTHERAPY EQUIPMENT MARKET, BY END USER, 2022-2032 ($MILLION)
- TABLE 33. FRANCE PHYSIOTHERAPY EQUIPMENT MARKET, BY TYPE, 2022-2032 ($MILLION)
- TABLE 34. FRANCE PHYSIOTHERAPY EQUIPMENT MARKET, BY APPLICATIONS, 2022-2032 ($MILLION)
- TABLE 35. FRANCE PHYSIOTHERAPY EQUIPMENT MARKET, BY END USER, 2022-2032 ($MILLION)
- TABLE 36. UK PHYSIOTHERAPY EQUIPMENT MARKET, BY TYPE, 2022-2032 ($MILLION)
- TABLE 37. UK PHYSIOTHERAPY EQUIPMENT MARKET, BY APPLICATIONS, 2022-2032 ($MILLION)
- TABLE 38. UK PHYSIOTHERAPY EQUIPMENT MARKET, BY END USER, 2022-2032 ($MILLION)
- TABLE 39. ITALY PHYSIOTHERAPY EQUIPMENT MARKET, BY TYPE, 2022-2032 ($MILLION)
- TABLE 40. ITALY PHYSIOTHERAPY EQUIPMENT MARKET, BY APPLICATIONS, 2022-2032 ($MILLION)
- TABLE 41. ITALY PHYSIOTHERAPY EQUIPMENT MARKET, BY END USER, 2022-2032 ($MILLION)
- TABLE 42. SPAIN PHYSIOTHERAPY EQUIPMENT MARKET, BY TYPE, 2022-2032 ($MILLION)
- TABLE 43. SPAIN PHYSIOTHERAPY EQUIPMENT MARKET, BY APPLICATIONS, 2022-2032 ($MILLION)
- TABLE 44. SPAIN PHYSIOTHERAPY EQUIPMENT MARKET, BY END USER, 2022-2032 ($MILLION)
- TABLE 45. REST OF EUROPE PHYSIOTHERAPY EQUIPMENT MARKET, BY TYPE, 2022-2032 ($MILLION)
- TABLE 46. REST OF EUROPE PHYSIOTHERAPY EQUIPMENT MARKET, BY APPLICATIONS, 2022-2032 ($MILLION)
- TABLE 47. REST OF EUROPE PHYSIOTHERAPY EQUIPMENT MARKET, BY END USER, 2022-2032 ($MILLION)
- TABLE 48. ASIA-PACIFIC PHYSIOTHERAPY EQUIPMENT MARKET, BY TYPE, 2022-2032 ($MILLION)
- TABLE 49. ASIA-PACIFIC PHYSIOTHERAPY EQUIPMENT MARKET, BY APPLICATIONS, 2022-2032 ($MILLION)
- TABLE 50. ASIA-PACIFIC PHYSIOTHERAPY EQUIPMENT MARKET, BY END USER, 2022-2032 ($MILLION)
- TABLE 51. ASIA-PACIFIC PHYSIOTHERAPY EQUIPMENT MARKET, BY COUNTRY, 2022-2032 ($MILLION)
- TABLE 52. JAPAN PHYSIOTHERAPY EQUIPMENT MARKET, BY TYPE, 2022-2032 ($MILLION)
- TABLE 53. JAPAN PHYSIOTHERAPY EQUIPMENT MARKET, BY APPLICATIONS, 2022-2032 ($MILLION)
- TABLE 54. JAPAN PHYSIOTHERAPY EQUIPMENT MARKET, BY END USER, 2022-2032 ($MILLION)
- TABLE 55. CHINA PHYSIOTHERAPY EQUIPMENT MARKET, BY TYPE, 2022-2032 ($MILLION)
- TABLE 56. CHINA PHYSIOTHERAPY EQUIPMENT MARKET, BY APPLICATIONS, 2022-2032 ($MILLION)
- TABLE 57. CHINA PHYSIOTHERAPY EQUIPMENT MARKET, BY END USER, 2022-2032 ($MILLION)
- TABLE 58. INDIA PHYSIOTHERAPY EQUIPMENT MARKET, BY TYPE, 2022-2032 ($MILLION)
- TABLE 59. INDIA PHYSIOTHERAPY EQUIPMENT MARKET, BY APPLICATIONS, 2022-2032 ($MILLION)
- TABLE 60. INDIA PHYSIOTHERAPY EQUIPMENT MARKET, BY END USER, 2022-2032 ($MILLION)
- TABLE 61. AUSTRALIA PHYSIOTHERAPY EQUIPMENT MARKET, BY TYPE, 2022-2032 ($MILLION)
- TABLE 62. AUSTRALIA PHYSIOTHERAPY EQUIPMENT MARKET, BY APPLICATIONS, 2022-2032 ($MILLION)
- TABLE 63. AUSTRALIA PHYSIOTHERAPY EQUIPMENT MARKET, BY END USER, 2022-2032 ($MILLION)
- TABLE 64. SOUTH KOREA PHYSIOTHERAPY EQUIPMENT MARKET, BY TYPE, 2022-2032 ($MILLION)
- TABLE 65. SOUTH KOREA PHYSIOTHERAPY EQUIPMENT MARKET, BY APPLICATIONS, 2022-2032 ($MILLION)
- TABLE 66. SOUTH KOREA PHYSIOTHERAPY EQUIPMENT MARKET, BY END USER, 2022-2032 ($MILLION)
- TABLE 67. REST OF ASIA-PACIFIC PHYSIOTHERAPY EQUIPMENT MARKET, BY TYPE, 2022-2032 ($MILLION)
- TABLE 68. REST OF ASIA-PACIFIC PHYSIOTHERAPY EQUIPMENT MARKET, BY APPLICATIONS, 2022-2032 ($MILLION)
- TABLE 69. REST OF ASIA-PACIFIC PHYSIOTHERAPY EQUIPMENT MARKET, BY END USER, 2022-2032 ($MILLION)
- TABLE 70. LAMEA PHYSIOTHERAPY EQUIPMENT MARKET, BY TYPE, 2022-2032 ($MILLION)
- TABLE 71. LAMEA PHYSIOTHERAPY EQUIPMENT MARKET, BY APPLICATIONS, 2022-2032 ($MILLION)
- TABLE 72. LAMEA PHYSIOTHERAPY EQUIPMENT MARKET, BY END USER, 2022-2032 ($MILLION)
- TABLE 73. LAMEA PHYSIOTHERAPY EQUIPMENT MARKET, BY COUNTRY, 2022-2032 ($MILLION)
- TABLE 74. BRAZIL PHYSIOTHERAPY EQUIPMENT MARKET, BY TYPE, 2022-2032 ($MILLION)
- TABLE 75. BRAZIL PHYSIOTHERAPY EQUIPMENT MARKET, BY APPLICATIONS, 2022-2032 ($MILLION)
- TABLE 76. BRAZIL PHYSIOTHERAPY EQUIPMENT MARKET, BY END USER, 2022-2032 ($MILLION)
- TABLE 77. SAUDI ARABIA PHYSIOTHERAPY EQUIPMENT MARKET, BY TYPE, 2022-2032 ($MILLION)
- TABLE 78. SAUDI ARABIA PHYSIOTHERAPY EQUIPMENT MARKET, BY APPLICATIONS, 2022-2032 ($MILLION)
- TABLE 79. SAUDI ARABIA PHYSIOTHERAPY EQUIPMENT MARKET, BY END USER, 2022-2032 ($MILLION)
- TABLE 80. SOUTH AFRICA PHYSIOTHERAPY EQUIPMENT MARKET, BY TYPE, 2022-2032 ($MILLION)
- TABLE 81. SOUTH AFRICA PHYSIOTHERAPY EQUIPMENT MARKET, BY APPLICATIONS, 2022-2032 ($MILLION)
- TABLE 82. SOUTH AFRICA PHYSIOTHERAPY EQUIPMENT MARKET, BY END USER, 2022-2032 ($MILLION)
- TABLE 83. REST OF LAMEA PHYSIOTHERAPY EQUIPMENT MARKET, BY TYPE, 2022-2032 ($MILLION)
- TABLE 84. REST OF LAMEA PHYSIOTHERAPY EQUIPMENT MARKET, BY APPLICATIONS, 2022-2032 ($MILLION)
- TABLE 85. REST OF LAMEA PHYSIOTHERAPY EQUIPMENT MARKET, BY END USER, 2022-2032 ($MILLION)
- TABLE 86. EMS PHYSIO LTD.: KEY EXECUTIVES
- TABLE 87. EMS PHYSIO LTD.: COMPANY SNAPSHOT
- TABLE 88. EMS PHYSIO LTD.: PRODUCT SEGMENTS
- TABLE 89. EMS PHYSIO LTD.: PRODUCT PORTFOLIO
- TABLE 90. BTL CORPORATE: KEY EXECUTIVES
- TABLE 91. BTL CORPORATE: COMPANY SNAPSHOT
- TABLE 92. BTL CORPORATE: PRODUCT SEGMENTS
- TABLE 93. BTL CORPORATE: PRODUCT PORTFOLIO
- TABLE 94. ZYNEX MEDICAL INC.: KEY EXECUTIVES
- TABLE 95. ZYNEX MEDICAL INC.: COMPANY SNAPSHOT
- TABLE 96. ZYNEX MEDICAL INC.: SERVICE SEGMENTS
- TABLE 97. ZYNEX MEDICAL INC.: PRODUCT PORTFOLIO
- TABLE 98. ZYNEX MEDICAL INC.: KEY STRATERGIES
- TABLE 99. ENRAF-NONIUS B.V.: KEY EXECUTIVES
- TABLE 100. ENRAF-NONIUS B.V.: COMPANY SNAPSHOT
- TABLE 101. ENRAF-NONIUS B.V.: PRODUCT SEGMENTS
- TABLE 102. ENRAF-NONIUS B.V.: PRODUCT PORTFOLIO
- TABLE 103. ZIMMER MEDIZINSYSTEME GMBH: KEY EXECUTIVES
- TABLE 104. ZIMMER MEDIZINSYSTEME GMBH: COMPANY SNAPSHOT
- TABLE 105. ZIMMER MEDIZINSYSTEME GMBH: PRODUCT SEGMENTS
- TABLE 106. ZIMMER MEDIZINSYSTEME GMBH: PRODUCT PORTFOLIO
- TABLE 107. DYNATRONICS CORPORATION: KEY EXECUTIVES
- TABLE 108. DYNATRONICS CORPORATION: COMPANY SNAPSHOT
- TABLE 109. DYNATRONICS CORPORATION: PRODUCT SEGMENTS
- TABLE 110. DYNATRONICS CORPORATION: PRODUCT PORTFOLIO
- TABLE 111. STORZ MEDICAL AG: KEY EXECUTIVES
- TABLE 112. STORZ MEDICAL AG: COMPANY SNAPSHOT
- TABLE 113. STORZ MEDICAL AG: PRODUCT SEGMENTS
- TABLE 114. STORZ MEDICAL AG: PRODUCT PORTFOLIO
- TABLE 115. STORZ MEDICAL AG: KEY STRATERGIES
- TABLE 116. RICHMAR: KEY EXECUTIVES
- TABLE 117. RICHMAR: COMPANY SNAPSHOT
- TABLE 118. RICHMAR: PRODUCT SEGMENTS
- TABLE 119. RICHMAR: PRODUCT PORTFOLIO
- TABLE 120. PERFORMANCE HEALTH: KEY EXECUTIVES
- TABLE 121. PERFORMANCE HEALTH: COMPANY SNAPSHOT
- TABLE 122. PERFORMANCE HEALTH: PRODUCT SEGMENTS
- TABLE 123. PERFORMANCE HEALTH: PRODUCT PORTFOLIO
- TABLE 124. ENOVIS CORPORATION: KEY EXECUTIVES
- TABLE 125. ENOVIS CORPORATION: COMPANY SNAPSHOT
- TABLE 126. ENOVIS CORPORATION: PRODUCT SEGMENTS
- TABLE 127. ENOVIS CORPORATION: PRODUCT PORTFOLIO
LIST OF FIGURES
- FIGURE 01. PHYSIOTHERAPY EQUIPMENT MARKET, 2022-2032
- FIGURE 02. SEGMENTATION OF PHYSIOTHERAPY EQUIPMENT MARKET,2022-2032
- FIGURE 03. TOP INVESTMENT POCKETS IN PHYSIOTHERAPY EQUIPMENT MARKET (2023-2032)
- FIGURE 04. LOW BARGAINING POWER OF SUPPLIERS
- FIGURE 05. LOW THREAT OF NEW ENTRANTS
- FIGURE 06. LOW THREAT OF SUBSTITUTES
- FIGURE 07. LOW INTENSITY OF RIVALRY
- FIGURE 08. LOW BARGAINING POWER OF BUYERS
- FIGURE 09. GLOBAL PHYSIOTHERAPY EQUIPMENT MARKET:DRIVERS, RESTRAINTS AND OPPORTUNITIES
- FIGURE 10. PHYSIOTHERAPY EQUIPMENT MARKET, BY TYPE, 2022 AND 2032(%)
- FIGURE 11. COMPARATIVE SHARE ANALYSIS OF PHYSIOTHERAPY EQUIPMENT MARKET FOR EQUIPMENT, BY COUNTRY 2022 AND 2032(%)
- FIGURE 12. COMPARATIVE SHARE ANALYSIS OF PHYSIOTHERAPY EQUIPMENT MARKET FOR ACCESSORIES, BY COUNTRY 2022 AND 2032(%)
- FIGURE 13. PHYSIOTHERAPY EQUIPMENT MARKET, BY APPLICATIONS, 2022 AND 2032(%)
- FIGURE 14. COMPARATIVE SHARE ANALYSIS OF PHYSIOTHERAPY EQUIPMENT MARKET FOR MUSCULOSKELETAL, BY COUNTRY 2022 AND 2032(%)
- FIGURE 15. COMPARATIVE SHARE ANALYSIS OF PHYSIOTHERAPY EQUIPMENT MARKET FOR NEUROLOGY, BY COUNTRY 2022 AND 2032(%)
- FIGURE 16. COMPARATIVE SHARE ANALYSIS OF PHYSIOTHERAPY EQUIPMENT MARKET FOR OTHER, BY COUNTRY 2022 AND 2032(%)
- FIGURE 17. PHYSIOTHERAPY EQUIPMENT MARKET, BY END USER, 2022 AND 2032(%)
- FIGURE 18. COMPARATIVE SHARE ANALYSIS OF PHYSIOTHERAPY EQUIPMENT MARKET FOR HOSPITALS, BY COUNTRY 2022 AND 2032(%)
- FIGURE 19. COMPARATIVE SHARE ANALYSIS OF PHYSIOTHERAPY EQUIPMENT MARKET FOR PHYSIOTHERAPY AND REHABILITAION CENTER, BY COUNTRY 2022 AND 2032(%)
- FIGURE 20. COMPARATIVE SHARE ANALYSIS OF PHYSIOTHERAPY EQUIPMENT MARKET FOR OTHERS, BY COUNTRY 2022 AND 2032(%)
- FIGURE 21. PHYSIOTHERAPY EQUIPMENT MARKET BY REGION, 2022 AND 2032(%)
- FIGURE 22. U.S. PHYSIOTHERAPY EQUIPMENT MARKET, 2022-2032 ($MILLION)
- FIGURE 23. CANADA PHYSIOTHERAPY EQUIPMENT MARKET, 2022-2032 ($MILLION)
- FIGURE 24. MEXICO PHYSIOTHERAPY EQUIPMENT MARKET, 2022-2032 ($MILLION)
- FIGURE 25. GERMANY PHYSIOTHERAPY EQUIPMENT MARKET, 2022-2032 ($MILLION)
- FIGURE 26. FRANCE PHYSIOTHERAPY EQUIPMENT MARKET, 2022-2032 ($MILLION)
- FIGURE 27. UK PHYSIOTHERAPY EQUIPMENT MARKET, 2022-2032 ($MILLION)
- FIGURE 28. ITALY PHYSIOTHERAPY EQUIPMENT MARKET, 2022-2032 ($MILLION)
- FIGURE 29. SPAIN PHYSIOTHERAPY EQUIPMENT MARKET, 2022-2032 ($MILLION)
- FIGURE 30. REST OF EUROPE PHYSIOTHERAPY EQUIPMENT MARKET, 2022-2032 ($MILLION)
- FIGURE 31. JAPAN PHYSIOTHERAPY EQUIPMENT MARKET, 2022-2032 ($MILLION)
- FIGURE 32. CHINA PHYSIOTHERAPY EQUIPMENT MARKET, 2022-2032 ($MILLION)
- FIGURE 33. INDIA PHYSIOTHERAPY EQUIPMENT MARKET, 2022-2032 ($MILLION)
- FIGURE 34. AUSTRALIA PHYSIOTHERAPY EQUIPMENT MARKET, 2022-2032 ($MILLION)
- FIGURE 35. SOUTH KOREA PHYSIOTHERAPY EQUIPMENT MARKET, 2022-2032 ($MILLION)
- FIGURE 36. REST OF ASIA-PACIFIC PHYSIOTHERAPY EQUIPMENT MARKET, 2022-2032 ($MILLION)
- FIGURE 37. BRAZIL PHYSIOTHERAPY EQUIPMENT MARKET, 2022-2032 ($MILLION)
- FIGURE 38. SAUDI ARABIA PHYSIOTHERAPY EQUIPMENT MARKET, 2022-2032 ($MILLION)
- FIGURE 39. SOUTH AFRICA PHYSIOTHERAPY EQUIPMENT MARKET, 2022-2032 ($MILLION)
- FIGURE 40. REST OF LAMEA PHYSIOTHERAPY EQUIPMENT MARKET, 2022-2032 ($MILLION)
- FIGURE 41. TOP WINNING STRATEGIES, BY YEAR (2021-2023)
- FIGURE 42. TOP WINNING STRATEGIES, BY DEVELOPMENT (2021-2023)
- FIGURE 43. TOP WINNING STRATEGIES, BY COMPANY (2021-2023)
- FIGURE 44. PRODUCT MAPPING OF TOP 10 PLAYERS
- FIGURE 45. COMPETITIVE DASHBOARD
- FIGURE 46. COMPETITIVE HEATMAP: PHYSIOTHERAPY EQUIPMENT MARKET
- FIGURE 47. TOP PLAYER POSITIONING, 2022
- FIGURE 48. ZYNEX MEDICAL INC.: RESEARCH & DEVELOPMENT EXPENDITURE, 2020-2022 ($MILLION)
- FIGURE 49. ZYNEX MEDICAL INC.: NET REVENUE, 2020-2022 ($MILLION)
- FIGURE 50. ENOVIS CORPORATION: NET SALES, 2020-2022 ($MILLION)
- FIGURE 51. ENOVIS CORPORATION: REVENUE SHARE BY SEGMENT, 2022 (%)
- FIGURE 52. ENOVIS CORPORATION: REVENUE SHARE BY REGION, 2021 (%)
 2024 年物理治療服務全球市場報告
 2024-2028年全球物理治療設備市場
 物理治療設備 - 全球市場考量、競爭格局、市場預測 (2030)
 全球物理治療市場 2023-2027
 物理治療設備市場:2023-2028 年全球行業趨勢、佔有率、規模、成長、機遇和預測
 全球物理治療設備市場研究報告 - 2023 年至 2030 年行業分析、規模、佔有率、成長、趨勢和預測
 全球物理治療設備市場
 全球物理治療設備市場 - 2023-2030
 物理治療檢查台市場:按產品、最終用戶分類 - 2023-2030 年全球預測
 物理治療設備市場:按設備、按用途、按最終用戶 - COVID-19、俄羅斯-烏克蘭衝突、高通膨的累積影響 - 2023-2030 年全球預測