


 |
市場調查報告書
商品編碼
1344516
適應型保全市場:各零件,各部署模式,各用途,各業界:世界機會分析與產業預測,2023年~2032年Adaptive Security Market By Component, By Deployment Mode, By Application, By Industry Vertical: Global Opportunity Analysis and Industry Forecast, 2023-2032 |
||||||
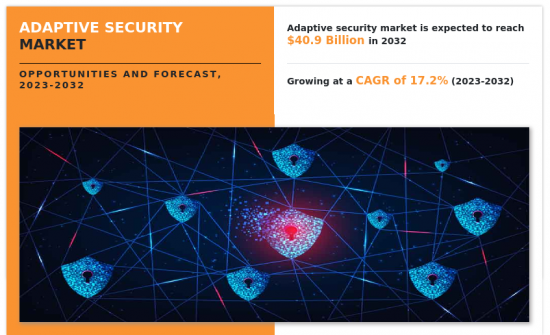
根據Allied Market Research最新發布的研究報告 "適應型保全市場" ,2022年適應型保全市場的市場規模為86億美元,2032年將達到409億美元,2023年將達到409億美元. 預計到2032 年複合年增長率為17.2%。
此外,雲端運算等先進技術的整合有可能為企業和消費者帶來多種好處,包括能夠更有效地偵測和回應新出現的威脅。適應型保全服務可協助公司和企業提高效率、生產力並降低成本。此外,您還可以為最終用戶提供增強的安全解決方案和更好的客戶體驗。此外,適應型保全策略提供靈活性和可擴展性,以適應不斷變化的威脅情勢和不斷變化的業務需求。上述因素預計將為預測期內的市場成長提供利潤豐厚的機會。
此外,各種量子運算技術將增強安全性和透明度,為適應型保全解決方案創造機會,最大限度地減少安全事件的影響並提高系統品質安全性,預測期內將對市場的成長產生積極影響。此外,技術進步的不斷增長趨勢以及行動和網際網路設備使用的快速增加是推動市場成長的主要因素。此外,多個行業對加強監管和安全合規標準的需求不斷增長,預計將加速市場需求,進而推動全球市場成長。此外,對有效事件回應和復原解決方案的需求為適應型保全解決方案創造了機會,以最大限度地減少安全事件的影響並提高系統品質。此外,隨著對數位技術的日益依賴,企業致力於提供無縫且安全的用戶體驗,預計這將為預測期內的全球市場擴張提供利潤豐厚的機會。事??實確實如此。目錄
第1章 簡介
第2章 摘要整理
第3章 市場概要
- 市場定義和範圍
- 主要調查結果
- 影響要素
- 主要的投資機會
- 波特的五力分析
- 市場動態
- 促進因素
- 企業越來越多採用數位化
- 對安全性增強解決方案的需求不斷增加
- 擴大將政府措施納入安全標準
- 抑制因素
- 缺乏熟練的網路安全專業人員和策略規劃
- 實施適應型保全解決方案的成本高昂
- 機會
- 人工智慧 (AI) 與機器學習 (ML) 技術的進步
- 與其他供應商的合作與夥伴關係
- 促進因素
- COVID-19對市場的影響分析
第4章 適應型保全市場:各零件
- 解決方案
- 服務
第5章 適應型保全市場:各部署模式
- 內部部署
- 雲端
第6章 適應型保全市場:各用途
- 網路·保全
- 應用·保全
- 終端安全
- 雲端保全
- 其他
第7章 適應型保全市場:各業界
- BFSI
- IT·通訊
- 零售·電子商務
- 製造業
- 醫療保健
- 能源·公共產業
- 政府·防衛
- 其他
第8章 適應型保全市場:各地區
- 北美
- 美國
- 加拿大
- 歐洲
- 英國
- 德國
- 法國
- 義大利
- 西班牙
- 其他歐洲
- 亞太地區
- 中國
- 日本
- 印度
- 澳洲
- 韓國
- 其他亞太地區
- 南美
- 南美
- 中東
- 非洲
第9章 競爭情形
- 簡介
- 主要成功策略
- 主要十大公司的產品製圖
- 競爭儀表板
- 競爭熱圖
- 主要企業的定位,2022年
第10章 企業簡介
- Aruba Networks Inc.
- Cisco Systems Inc.
- Cloudwick Inc.
- Fortinet, Inc.
- IBM Corporation
- Juniper Networks Inc.
- Panda Security Inc.
- Rapid7 Inc.
- RSA Security LLC
- Trend Micro Incorporated
According to a new report published by Allied Market Research, titled, "Adaptive Security Market," The adaptive security market was valued at $8.6 billion in 2022, and is estimated to reach $40.9 billion by 2032, growing at a CAGR of 17.2% from 2023 to 2032.
Furthermore, the integration of advanced technologies such as cloud computing has the potential to create several benefits for businesses and consumers, including detecting and responding to emerging threats more effectively. An adaptive security service can help to improve efficiency and productivity for businesses and businesses, as well as reduce costs. Moreover, it can provide enhanced security solutions and a better customer experience for end users. In addition, adaptive security strategies provide flexibility and scalability to adapt to evolving threat landscapes and changing business requirements. Such aforementioned factors are anticipated to provide lucrative opportunities for market growth during the forecast period.
Moreover, it creates opportunities for adaptive security solutions to minimize the impact of security incidents and improve system quality security, as various quantum computing technologies enhance security and transparency, which positively impacts the growth of the market in the forecast period. In addition, the growing trend of technological advancements and the surge in usage of mobile and internet-enabled devices are major factors driving the market growth. Moreover, growing demand to strengthen the regulatory and security compliance standards in several industries is anticipated to accelerate the market demand and hence, drive global market growth. Furthermore, the need for effective incident response and recovery solutions, which creates opportunities for adaptive security solutions to minimize the impact of security incidents and improve the quality of the system. Moreover, with the increasing reliance on digital technologies, organizations aim to provide a seamless and secure user experience, which in turn, is expected to offer remunerative opportunities for the expansion of the global market during the forecast period.
In addition, the adaptive security market is witnessing significant growth, owing to several key factors including the ever-evolving threat landscape is a major driving force. Whereas traditional security mediums are often inadequate in handling sophisticated cyber threats, enabling adaptive security solutions necessary to address the evolving structure of attacks. As attackers become more advanced and use complex techniques, organizations are recognizing the need for adaptive security to detect and respond to emerging threats in real time.
Rise in demand for enhanced security solutions and rise in adoption of digitalized security solutions are positively impacting the growth of the market. In addition, the surge in integration of government initiatives in security standards is expected to fuel the growth of the market during the forecast period. However, the high implementation cost of adaptive security solutions and dearth of skilled cybersecurity professionals and strategic planning are projected to limit the market growth. Moreover, the advancement of AI and ML technologies and collaboration and partnerships with other vendors are also anticipated creating lucrative opportunities for the global adaptive security market growth.
The adaptive security market is segmented into component, deployment mode, application, industry vertical, and region. By component, it is bifurcated into solution and services. By deployment mode, it is divided into on-premise and cloud. Based on application, it is categorized into network security, application security, end point security, cloud security and others. By industry vertical, the market is classified into BFSI, IT & telecom, retail and e-commerce, manufacturing, healthcare, energy and utilities, government & defense and others. Region wise, it is analyzed across North America, Europe, Asia-Pacific, and LAMEA.
The global adaptive security market is dominated by key players such as Aruba Networks Inc., Cisco Systems Inc., Cloudwick Inc., Fortinet, Inc., IBM Corporation, Juniper Networks Inc., Panda Security Inc., Rapid7 Inc., RSA Security LLC and Trend Micro Incorporated. These major players have adopted various key development strategies such as business expansion, new product launches, and partnerships, which help to drive the growth of the adaptive security market globally.
Key Benefits for Stakeholders
- The study provides an in-depth analysis of the adaptive security market forecast along with the current and future trends to explain the imminent investment pockets.
- Information about key drivers, restraints, and opportunities and their impact analysis on adaptive security market trends is provided in the report.
- The Porter's five forces analysis illustrates the potency of the buyers and suppliers operating in the industry.
- The quantitative analysis of the adaptive security market from 2022 to 2032 is provided to determine the market potential.
Key Market Segments
By Component
- Solution
- Service
By Deployment Mode
- On-Premise
- Cloud
By Application
- Network Security
- Application Security
- End Point Security
- Cloud Security
- Others
By Industry Vertical
- BFSI
- IT and Telecom
- Retail and Ecommerce
- Manufacturing
- Healthcare
- Energy and Utilities
- Government and Defense
- Others
By Region
- North America
- U.S.
- Canada
- Europe
- UK
- Germany
- France
- Italy
- Spain
- Rest of Europe
- Asia-Pacific
- China
- Japan
- India
- Australia
- South Korea
- Rest of Asia-Pacific
- LAMEA
- Latin America
- Middle East
- Africa
Key Market Players:
- Aruba Networks Inc.
- Cisco Systems Inc.
- Cloudwick Inc.
- Fortinet, Inc.
- IBM Corporation
- Juniper Networks Inc.
- Panda Security Inc.
- Rapid7 Inc.
- RSA Security LLC
- Trend Micro Incorporated
TABLE OF CONTENTS
CHAPTER 1: INTRODUCTION
- 1.1. Report description
- 1.2. Key market segments
- 1.3. Key benefits to the stakeholders
- 1.4. Research Methodology
- 1.4.1. Primary research
- 1.4.2. Secondary research
- 1.4.3. Analyst tools and models
CHAPTER 2: EXECUTIVE SUMMARY
- 2.1. CXO Perspective
CHAPTER 3: MARKET OVERVIEW
- 3.1. Market definition and scope
- 3.2. Key findings
- 3.2.1. Top impacting factors
- 3.2.2. Top investment pockets
- 3.3. Porter's five forces analysis
- 3.3.1. Bargaining power of suppliers
- 3.3.2. Bargaining power of buyers
- 3.3.3. Threat of substitutes
- 3.3.4. Threat of new entrants
- 3.3.5. Intensity of rivalry
- 3.4. Market dynamics
- 3.4.1. Drivers
- 3.4.1.1. Rising adoption of digitalization in businesses
- 3.4.1.2. The rise in demand of enhanced security solution
- 3.4.1.3. Surge in integration of government initiatives in security standards
- 3.4.1. Drivers
- 3.4.2. Restraints
- 3.4.2.1. Dearth of skilled cybersecurity professional and strategic planning
- 3.4.2.2. High implementation cost of adaptive security solution
- 3.4.3. Opportunities
- 3.4.3.1. The advancement of Artificial Intelligence (AI) and Machine Learning (ML) technologies
- 3.4.3.2. Collaboration and partnerships with other vendors
- 3.5. COVID-19 Impact Analysis on the market
CHAPTER 4: ADAPTIVE SECURITY MARKET, BY COMPONENT
- 4.1. Overview
- 4.1.1. Market size and forecast
- 4.2. Solution
- 4.2.1. Key market trends, growth factors and opportunities
- 4.2.2. Market size and forecast, by region
- 4.2.3. Market share analysis by country
- 4.3. Service
- 4.3.1. Key market trends, growth factors and opportunities
- 4.3.2. Market size and forecast, by region
- 4.3.3. Market share analysis by country
CHAPTER 5: ADAPTIVE SECURITY MARKET, BY DEPLOYMENT MODE
- 5.1. Overview
- 5.1.1. Market size and forecast
- 5.2. On-Premise
- 5.2.1. Key market trends, growth factors and opportunities
- 5.2.2. Market size and forecast, by region
- 5.2.3. Market share analysis by country
- 5.3. Cloud
- 5.3.1. Key market trends, growth factors and opportunities
- 5.3.2. Market size and forecast, by region
- 5.3.3. Market share analysis by country
CHAPTER 6: ADAPTIVE SECURITY MARKET, BY APPLICATION
- 6.1. Overview
- 6.1.1. Market size and forecast
- 6.2. Network Security
- 6.2.1. Key market trends, growth factors and opportunities
- 6.2.2. Market size and forecast, by region
- 6.2.3. Market share analysis by country
- 6.3. Application Security
- 6.3.1. Key market trends, growth factors and opportunities
- 6.3.2. Market size and forecast, by region
- 6.3.3. Market share analysis by country
- 6.4. End Point Security
- 6.4.1. Key market trends, growth factors and opportunities
- 6.4.2. Market size and forecast, by region
- 6.4.3. Market share analysis by country
- 6.5. Cloud Security
- 6.5.1. Key market trends, growth factors and opportunities
- 6.5.2. Market size and forecast, by region
- 6.5.3. Market share analysis by country
- 6.6. Others
- 6.6.1. Key market trends, growth factors and opportunities
- 6.6.2. Market size and forecast, by region
- 6.6.3. Market share analysis by country
CHAPTER 7: ADAPTIVE SECURITY MARKET, BY INDUSTRY VERTICAL
- 7.1. Overview
- 7.1.1. Market size and forecast
- 7.2. BFSI
- 7.2.1. Key market trends, growth factors and opportunities
- 7.2.2. Market size and forecast, by region
- 7.2.3. Market share analysis by country
- 7.3. IT and Telecom
- 7.3.1. Key market trends, growth factors and opportunities
- 7.3.2. Market size and forecast, by region
- 7.3.3. Market share analysis by country
- 7.4. Retail and Ecommerce
- 7.4.1. Key market trends, growth factors and opportunities
- 7.4.2. Market size and forecast, by region
- 7.4.3. Market share analysis by country
- 7.5. Manufacturing
- 7.5.1. Key market trends, growth factors and opportunities
- 7.5.2. Market size and forecast, by region
- 7.5.3. Market share analysis by country
- 7.6. Healthcare
- 7.6.1. Key market trends, growth factors and opportunities
- 7.6.2. Market size and forecast, by region
- 7.6.3. Market share analysis by country
- 7.7. Energy and Utilities
- 7.7.1. Key market trends, growth factors and opportunities
- 7.7.2. Market size and forecast, by region
- 7.7.3. Market share analysis by country
- 7.8. Government and Defense
- 7.8.1. Key market trends, growth factors and opportunities
- 7.8.2. Market size and forecast, by region
- 7.8.3. Market share analysis by country
- 7.9. Others
- 7.9.1. Key market trends, growth factors and opportunities
- 7.9.2. Market size and forecast, by region
- 7.9.3. Market share analysis by country
CHAPTER 8: ADAPTIVE SECURITY MARKET, BY REGION
- 8.1. Overview
- 8.1.1. Market size and forecast By Region
- 8.2. North America
- 8.2.1. Key trends and opportunities
- 8.2.2. Market size and forecast, by Component
- 8.2.3. Market size and forecast, by Deployment Mode
- 8.2.4. Market size and forecast, by Application
- 8.2.5. Market size and forecast, by Industry Vertical
- 8.2.6. Market size and forecast, by country
- 8.2.6.1. U.S.
- 8.2.6.1.1. Key market trends, growth factors and opportunities
- 8.2.6.1.2. Market size and forecast, by Component
- 8.2.6.1.3. Market size and forecast, by Deployment Mode
- 8.2.6.1.4. Market size and forecast, by Application
- 8.2.6.1.5. Market size and forecast, by Industry Vertical
- 8.2.6.2. Canada
- 8.2.6.2.1. Key market trends, growth factors and opportunities
- 8.2.6.2.2. Market size and forecast, by Component
- 8.2.6.2.3. Market size and forecast, by Deployment Mode
- 8.2.6.2.4. Market size and forecast, by Application
- 8.2.6.2.5. Market size and forecast, by Industry Vertical
- 8.3. Europe
- 8.3.1. Key trends and opportunities
- 8.3.2. Market size and forecast, by Component
- 8.3.3. Market size and forecast, by Deployment Mode
- 8.3.4. Market size and forecast, by Application
- 8.3.5. Market size and forecast, by Industry Vertical
- 8.3.6. Market size and forecast, by country
- 8.3.6.1. UK
- 8.3.6.1.1. Key market trends, growth factors and opportunities
- 8.3.6.1.2. Market size and forecast, by Component
- 8.3.6.1.3. Market size and forecast, by Deployment Mode
- 8.3.6.1.4. Market size and forecast, by Application
- 8.3.6.1.5. Market size and forecast, by Industry Vertical
- 8.3.6.2. Germany
- 8.3.6.2.1. Key market trends, growth factors and opportunities
- 8.3.6.2.2. Market size and forecast, by Component
- 8.3.6.2.3. Market size and forecast, by Deployment Mode
- 8.3.6.2.4. Market size and forecast, by Application
- 8.3.6.2.5. Market size and forecast, by Industry Vertical
- 8.3.6.3. France
- 8.3.6.3.1. Key market trends, growth factors and opportunities
- 8.3.6.3.2. Market size and forecast, by Component
- 8.3.6.3.3. Market size and forecast, by Deployment Mode
- 8.3.6.3.4. Market size and forecast, by Application
- 8.3.6.3.5. Market size and forecast, by Industry Vertical
- 8.3.6.4. Italy
- 8.3.6.4.1. Key market trends, growth factors and opportunities
- 8.3.6.4.2. Market size and forecast, by Component
- 8.3.6.4.3. Market size and forecast, by Deployment Mode
- 8.3.6.4.4. Market size and forecast, by Application
- 8.3.6.4.5. Market size and forecast, by Industry Vertical
- 8.3.6.5. Spain
- 8.3.6.5.1. Key market trends, growth factors and opportunities
- 8.3.6.5.2. Market size and forecast, by Component
- 8.3.6.5.3. Market size and forecast, by Deployment Mode
- 8.3.6.5.4. Market size and forecast, by Application
- 8.3.6.5.5. Market size and forecast, by Industry Vertical
- 8.3.6.6. Rest of Europe
- 8.3.6.6.1. Key market trends, growth factors and opportunities
- 8.3.6.6.2. Market size and forecast, by Component
- 8.3.6.6.3. Market size and forecast, by Deployment Mode
- 8.3.6.6.4. Market size and forecast, by Application
- 8.3.6.6.5. Market size and forecast, by Industry Vertical
- 8.4. Asia-Pacific
- 8.4.1. Key trends and opportunities
- 8.4.2. Market size and forecast, by Component
- 8.4.3. Market size and forecast, by Deployment Mode
- 8.4.4. Market size and forecast, by Application
- 8.4.5. Market size and forecast, by Industry Vertical
- 8.4.6. Market size and forecast, by country
- 8.4.6.1. China
- 8.4.6.1.1. Key market trends, growth factors and opportunities
- 8.4.6.1.2. Market size and forecast, by Component
- 8.4.6.1.3. Market size and forecast, by Deployment Mode
- 8.4.6.1.4. Market size and forecast, by Application
- 8.4.6.1.5. Market size and forecast, by Industry Vertical
- 8.4.6.2. Japan
- 8.4.6.2.1. Key market trends, growth factors and opportunities
- 8.4.6.2.2. Market size and forecast, by Component
- 8.4.6.2.3. Market size and forecast, by Deployment Mode
- 8.4.6.2.4. Market size and forecast, by Application
- 8.4.6.2.5. Market size and forecast, by Industry Vertical
- 8.4.6.3. India
- 8.4.6.3.1. Key market trends, growth factors and opportunities
- 8.4.6.3.2. Market size and forecast, by Component
- 8.4.6.3.3. Market size and forecast, by Deployment Mode
- 8.4.6.3.4. Market size and forecast, by Application
- 8.4.6.3.5. Market size and forecast, by Industry Vertical
- 8.4.6.4. Australia
- 8.4.6.4.1. Key market trends, growth factors and opportunities
- 8.4.6.4.2. Market size and forecast, by Component
- 8.4.6.4.3. Market size and forecast, by Deployment Mode
- 8.4.6.4.4. Market size and forecast, by Application
- 8.4.6.4.5. Market size and forecast, by Industry Vertical
- 8.4.6.5. South Korea
- 8.4.6.5.1. Key market trends, growth factors and opportunities
- 8.4.6.5.2. Market size and forecast, by Component
- 8.4.6.5.3. Market size and forecast, by Deployment Mode
- 8.4.6.5.4. Market size and forecast, by Application
- 8.4.6.5.5. Market size and forecast, by Industry Vertical
- 8.4.6.6. Rest of Asia-Pacific
- 8.4.6.6.1. Key market trends, growth factors and opportunities
- 8.4.6.6.2. Market size and forecast, by Component
- 8.4.6.6.3. Market size and forecast, by Deployment Mode
- 8.4.6.6.4. Market size and forecast, by Application
- 8.4.6.6.5. Market size and forecast, by Industry Vertical
- 8.5. LAMEA
- 8.5.1. Key trends and opportunities
- 8.5.2. Market size and forecast, by Component
- 8.5.3. Market size and forecast, by Deployment Mode
- 8.5.4. Market size and forecast, by Application
- 8.5.5. Market size and forecast, by Industry Vertical
- 8.5.6. Market size and forecast, by country
- 8.5.6.1. Latin America
- 8.5.6.1.1. Key market trends, growth factors and opportunities
- 8.5.6.1.2. Market size and forecast, by Component
- 8.5.6.1.3. Market size and forecast, by Deployment Mode
- 8.5.6.1.4. Market size and forecast, by Application
- 8.5.6.1.5. Market size and forecast, by Industry Vertical
- 8.5.6.2. Middle East
- 8.5.6.2.1. Key market trends, growth factors and opportunities
- 8.5.6.2.2. Market size and forecast, by Component
- 8.5.6.2.3. Market size and forecast, by Deployment Mode
- 8.5.6.2.4. Market size and forecast, by Application
- 8.5.6.2.5. Market size and forecast, by Industry Vertical
- 8.5.6.3. Africa
- 8.5.6.3.1. Key market trends, growth factors and opportunities
- 8.5.6.3.2. Market size and forecast, by Component
- 8.5.6.3.3. Market size and forecast, by Deployment Mode
- 8.5.6.3.4. Market size and forecast, by Application
- 8.5.6.3.5. Market size and forecast, by Industry Vertical
CHAPTER 9: COMPETITIVE LANDSCAPE
- 9.1. Introduction
- 9.2. Top winning strategies
- 9.3. Product Mapping of Top 10 Player
- 9.4. Competitive Dashboard
- 9.5. Competitive Heatmap
- 9.6. Top player positioning, 2022
CHAPTER 10: COMPANY PROFILES
- 10.1. Aruba Networks Inc.
- 10.1.1. Company overview
- 10.1.2. Key Executives
- 10.1.3. Company snapshot
- 10.1.4. Operating business segments
- 10.1.5. Product portfolio
- 10.1.6. Business performance
- 10.1.7. Key strategic moves and developments
- 10.2. Cisco Systems Inc.
- 10.2.1. Company overview
- 10.2.2. Key Executives
- 10.2.3. Company snapshot
- 10.2.4. Operating business segments
- 10.2.5. Product portfolio
- 10.2.6. Business performance
- 10.2.7. Key strategic moves and developments
- 10.3. Cloudwick Inc.
- 10.3.1. Company overview
- 10.3.2. Key Executives
- 10.3.3. Company snapshot
- 10.3.4. Operating business segments
- 10.3.5. Product portfolio
- 10.3.6. Key strategic moves and developments
- 10.4. Fortinet, Inc.
- 10.4.1. Company overview
- 10.4.2. Key Executives
- 10.4.3. Company snapshot
- 10.4.4. Operating business segments
- 10.4.5. Product portfolio
- 10.4.6. Business performance
- 10.4.7. Key strategic moves and developments
- 10.5. IBM Corporation
- 10.5.1. Company overview
- 10.5.2. Key Executives
- 10.5.3. Company snapshot
- 10.5.4. Operating business segments
- 10.5.5. Product portfolio
- 10.5.6. Business performance
- 10.5.7. Key strategic moves and developments
- 10.6. Juniper Networks Inc.
- 10.6.1. Company overview
- 10.6.2. Key Executives
- 10.6.3. Company snapshot
- 10.6.4. Operating business segments
- 10.6.5. Product portfolio
- 10.6.6. Business performance
- 10.6.7. Key strategic moves and developments
- 10.7. Panda Security Inc.
- 10.7.1. Company overview
- 10.7.2. Key Executives
- 10.7.3. Company snapshot
- 10.7.4. Operating business segments
- 10.7.5. Product portfolio
- 10.7.6. Key strategic moves and developments
- 10.8. Rapid7 Inc.
- 10.8.1. Company overview
- 10.8.2. Key Executives
- 10.8.3. Company snapshot
- 10.8.4. Operating business segments
- 10.8.5. Product portfolio
- 10.8.6. Key strategic moves and developments
- 10.9. RSA Security LLC
- 10.9.1. Company overview
- 10.9.2. Key Executives
- 10.9.3. Company snapshot
- 10.9.4. Operating business segments
- 10.9.5. Product portfolio
- 10.9.6. Key strategic moves and developments
- 10.10. Trend Micro Incorporated
- 10.10.1. Company overview
- 10.10.2. Key Executives
- 10.10.3. Company snapshot
- 10.10.4. Operating business segments
- 10.10.5. Product portfolio
- 10.10.6. Business performance
- 10.10.7. Key strategic moves and developments
LIST OF TABLES
- TABLE 01. GLOBAL ADAPTIVE SECURITY MARKET, BY COMPONENT, 2022-2032 ($MILLION)
- TABLE 02. ADAPTIVE SECURITY MARKET FOR SOLUTION, BY REGION, 2022-2032 ($MILLION)
- TABLE 03. ADAPTIVE SECURITY MARKET FOR SERVICE, BY REGION, 2022-2032 ($MILLION)
- TABLE 04. GLOBAL ADAPTIVE SECURITY MARKET, BY DEPLOYMENT MODE, 2022-2032 ($MILLION)
- TABLE 05. ADAPTIVE SECURITY MARKET FOR ON-PREMISE, BY REGION, 2022-2032 ($MILLION)
- TABLE 06. ADAPTIVE SECURITY MARKET FOR CLOUD, BY REGION, 2022-2032 ($MILLION)
- TABLE 07. GLOBAL ADAPTIVE SECURITY MARKET, BY APPLICATION, 2022-2032 ($MILLION)
- TABLE 08. ADAPTIVE SECURITY MARKET FOR NETWORK SECURITY, BY REGION, 2022-2032 ($MILLION)
- TABLE 09. ADAPTIVE SECURITY MARKET FOR APPLICATION SECURITY, BY REGION, 2022-2032 ($MILLION)
- TABLE 10. ADAPTIVE SECURITY MARKET FOR END POINT SECURITY, BY REGION, 2022-2032 ($MILLION)
- TABLE 11. ADAPTIVE SECURITY MARKET FOR CLOUD SECURITY, BY REGION, 2022-2032 ($MILLION)
- TABLE 12. ADAPTIVE SECURITY MARKET FOR OTHERS, BY REGION, 2022-2032 ($MILLION)
- TABLE 13. GLOBAL ADAPTIVE SECURITY MARKET, BY INDUSTRY VERTICAL, 2022-2032 ($MILLION)
- TABLE 14. ADAPTIVE SECURITY MARKET FOR BFSI, BY REGION, 2022-2032 ($MILLION)
- TABLE 15. ADAPTIVE SECURITY MARKET FOR IT AND TELECOM, BY REGION, 2022-2032 ($MILLION)
- TABLE 16. ADAPTIVE SECURITY MARKET FOR RETAIL AND ECOMMERCE, BY REGION, 2022-2032 ($MILLION)
- TABLE 17. ADAPTIVE SECURITY MARKET FOR MANUFACTURING, BY REGION, 2022-2032 ($MILLION)
- TABLE 18. ADAPTIVE SECURITY MARKET FOR HEALTHCARE, BY REGION, 2022-2032 ($MILLION)
- TABLE 19. ADAPTIVE SECURITY MARKET FOR ENERGY AND UTILITIES, BY REGION, 2022-2032 ($MILLION)
- TABLE 20. ADAPTIVE SECURITY MARKET FOR GOVERNMENT AND DEFENSE, BY REGION, 2022-2032 ($MILLION)
- TABLE 21. ADAPTIVE SECURITY MARKET FOR OTHERS, BY REGION, 2022-2032 ($MILLION)
- TABLE 22. ADAPTIVE SECURITY MARKET, BY REGION, 2022-2032 ($MILLION)
- TABLE 23. NORTH AMERICA ADAPTIVE SECURITY MARKET, BY COMPONENT, 2022-2032 ($MILLION)
- TABLE 24. NORTH AMERICA ADAPTIVE SECURITY MARKET, BY DEPLOYMENT MODE, 2022-2032 ($MILLION)
- TABLE 25. NORTH AMERICA ADAPTIVE SECURITY MARKET, BY APPLICATION, 2022-2032 ($MILLION)
- TABLE 26. NORTH AMERICA ADAPTIVE SECURITY MARKET, BY INDUSTRY VERTICAL, 2022-2032 ($MILLION)
- TABLE 27. NORTH AMERICA ADAPTIVE SECURITY MARKET, BY COUNTRY, 2022-2032 ($MILLION)
- TABLE 28. U.S. ADAPTIVE SECURITY MARKET, BY COMPONENT, 2022-2032 ($MILLION)
- TABLE 29. U.S. ADAPTIVE SECURITY MARKET, BY DEPLOYMENT MODE, 2022-2032 ($MILLION)
- TABLE 30. U.S. ADAPTIVE SECURITY MARKET, BY APPLICATION, 2022-2032 ($MILLION)
- TABLE 31. U.S. ADAPTIVE SECURITY MARKET, BY INDUSTRY VERTICAL, 2022-2032 ($MILLION)
- TABLE 32. CANADA ADAPTIVE SECURITY MARKET, BY COMPONENT, 2022-2032 ($MILLION)
- TABLE 33. CANADA ADAPTIVE SECURITY MARKET, BY DEPLOYMENT MODE, 2022-2032 ($MILLION)
- TABLE 34. CANADA ADAPTIVE SECURITY MARKET, BY APPLICATION, 2022-2032 ($MILLION)
- TABLE 35. CANADA ADAPTIVE SECURITY MARKET, BY INDUSTRY VERTICAL, 2022-2032 ($MILLION)
- TABLE 36. EUROPE ADAPTIVE SECURITY MARKET, BY COMPONENT, 2022-2032 ($MILLION)
- TABLE 37. EUROPE ADAPTIVE SECURITY MARKET, BY DEPLOYMENT MODE, 2022-2032 ($MILLION)
- TABLE 38. EUROPE ADAPTIVE SECURITY MARKET, BY APPLICATION, 2022-2032 ($MILLION)
- TABLE 39. EUROPE ADAPTIVE SECURITY MARKET, BY INDUSTRY VERTICAL, 2022-2032 ($MILLION)
- TABLE 40. EUROPE ADAPTIVE SECURITY MARKET, BY COUNTRY, 2022-2032 ($MILLION)
- TABLE 41. UK ADAPTIVE SECURITY MARKET, BY COMPONENT, 2022-2032 ($MILLION)
- TABLE 42. UK ADAPTIVE SECURITY MARKET, BY DEPLOYMENT MODE, 2022-2032 ($MILLION)
- TABLE 43. UK ADAPTIVE SECURITY MARKET, BY APPLICATION, 2022-2032 ($MILLION)
- TABLE 44. UK ADAPTIVE SECURITY MARKET, BY INDUSTRY VERTICAL, 2022-2032 ($MILLION)
- TABLE 45. GERMANY ADAPTIVE SECURITY MARKET, BY COMPONENT, 2022-2032 ($MILLION)
- TABLE 46. GERMANY ADAPTIVE SECURITY MARKET, BY DEPLOYMENT MODE, 2022-2032 ($MILLION)
- TABLE 47. GERMANY ADAPTIVE SECURITY MARKET, BY APPLICATION, 2022-2032 ($MILLION)
- TABLE 48. GERMANY ADAPTIVE SECURITY MARKET, BY INDUSTRY VERTICAL, 2022-2032 ($MILLION)
- TABLE 49. FRANCE ADAPTIVE SECURITY MARKET, BY COMPONENT, 2022-2032 ($MILLION)
- TABLE 50. FRANCE ADAPTIVE SECURITY MARKET, BY DEPLOYMENT MODE, 2022-2032 ($MILLION)
- TABLE 51. FRANCE ADAPTIVE SECURITY MARKET, BY APPLICATION, 2022-2032 ($MILLION)
- TABLE 52. FRANCE ADAPTIVE SECURITY MARKET, BY INDUSTRY VERTICAL, 2022-2032 ($MILLION)
- TABLE 53. ITALY ADAPTIVE SECURITY MARKET, BY COMPONENT, 2022-2032 ($MILLION)
- TABLE 54. ITALY ADAPTIVE SECURITY MARKET, BY DEPLOYMENT MODE, 2022-2032 ($MILLION)
- TABLE 55. ITALY ADAPTIVE SECURITY MARKET, BY APPLICATION, 2022-2032 ($MILLION)
- TABLE 56. ITALY ADAPTIVE SECURITY MARKET, BY INDUSTRY VERTICAL, 2022-2032 ($MILLION)
- TABLE 57. SPAIN ADAPTIVE SECURITY MARKET, BY COMPONENT, 2022-2032 ($MILLION)
- TABLE 58. SPAIN ADAPTIVE SECURITY MARKET, BY DEPLOYMENT MODE, 2022-2032 ($MILLION)
- TABLE 59. SPAIN ADAPTIVE SECURITY MARKET, BY APPLICATION, 2022-2032 ($MILLION)
- TABLE 60. SPAIN ADAPTIVE SECURITY MARKET, BY INDUSTRY VERTICAL, 2022-2032 ($MILLION)
- TABLE 61. REST OF EUROPE ADAPTIVE SECURITY MARKET, BY COMPONENT, 2022-2032 ($MILLION)
- TABLE 62. REST OF EUROPE ADAPTIVE SECURITY MARKET, BY DEPLOYMENT MODE, 2022-2032 ($MILLION)
- TABLE 63. REST OF EUROPE ADAPTIVE SECURITY MARKET, BY APPLICATION, 2022-2032 ($MILLION)
- TABLE 64. REST OF EUROPE ADAPTIVE SECURITY MARKET, BY INDUSTRY VERTICAL, 2022-2032 ($MILLION)
- TABLE 65. ASIA-PACIFIC ADAPTIVE SECURITY MARKET, BY COMPONENT, 2022-2032 ($MILLION)
- TABLE 66. ASIA-PACIFIC ADAPTIVE SECURITY MARKET, BY DEPLOYMENT MODE, 2022-2032 ($MILLION)
- TABLE 67. ASIA-PACIFIC ADAPTIVE SECURITY MARKET, BY APPLICATION, 2022-2032 ($MILLION)
- TABLE 68. ASIA-PACIFIC ADAPTIVE SECURITY MARKET, BY INDUSTRY VERTICAL, 2022-2032 ($MILLION)
- TABLE 69. ASIA-PACIFIC ADAPTIVE SECURITY MARKET, BY COUNTRY, 2022-2032 ($MILLION)
- TABLE 70. CHINA ADAPTIVE SECURITY MARKET, BY COMPONENT, 2022-2032 ($MILLION)
- TABLE 71. CHINA ADAPTIVE SECURITY MARKET, BY DEPLOYMENT MODE, 2022-2032 ($MILLION)
- TABLE 72. CHINA ADAPTIVE SECURITY MARKET, BY APPLICATION, 2022-2032 ($MILLION)
- TABLE 73. CHINA ADAPTIVE SECURITY MARKET, BY INDUSTRY VERTICAL, 2022-2032 ($MILLION)
- TABLE 74. JAPAN ADAPTIVE SECURITY MARKET, BY COMPONENT, 2022-2032 ($MILLION)
- TABLE 75. JAPAN ADAPTIVE SECURITY MARKET, BY DEPLOYMENT MODE, 2022-2032 ($MILLION)
- TABLE 76. JAPAN ADAPTIVE SECURITY MARKET, BY APPLICATION, 2022-2032 ($MILLION)
- TABLE 77. JAPAN ADAPTIVE SECURITY MARKET, BY INDUSTRY VERTICAL, 2022-2032 ($MILLION)
- TABLE 78. INDIA ADAPTIVE SECURITY MARKET, BY COMPONENT, 2022-2032 ($MILLION)
- TABLE 79. INDIA ADAPTIVE SECURITY MARKET, BY DEPLOYMENT MODE, 2022-2032 ($MILLION)
- TABLE 80. INDIA ADAPTIVE SECURITY MARKET, BY APPLICATION, 2022-2032 ($MILLION)
- TABLE 81. INDIA ADAPTIVE SECURITY MARKET, BY INDUSTRY VERTICAL, 2022-2032 ($MILLION)
- TABLE 82. AUSTRALIA ADAPTIVE SECURITY MARKET, BY COMPONENT, 2022-2032 ($MILLION)
- TABLE 83. AUSTRALIA ADAPTIVE SECURITY MARKET, BY DEPLOYMENT MODE, 2022-2032 ($MILLION)
- TABLE 84. AUSTRALIA ADAPTIVE SECURITY MARKET, BY APPLICATION, 2022-2032 ($MILLION)
- TABLE 85. AUSTRALIA ADAPTIVE SECURITY MARKET, BY INDUSTRY VERTICAL, 2022-2032 ($MILLION)
- TABLE 86. SOUTH KOREA ADAPTIVE SECURITY MARKET, BY COMPONENT, 2022-2032 ($MILLION)
- TABLE 87. SOUTH KOREA ADAPTIVE SECURITY MARKET, BY DEPLOYMENT MODE, 2022-2032 ($MILLION)
- TABLE 88. SOUTH KOREA ADAPTIVE SECURITY MARKET, BY APPLICATION, 2022-2032 ($MILLION)
- TABLE 89. SOUTH KOREA ADAPTIVE SECURITY MARKET, BY INDUSTRY VERTICAL, 2022-2032 ($MILLION)
- TABLE 90. REST OF ASIA-PACIFIC ADAPTIVE SECURITY MARKET, BY COMPONENT, 2022-2032 ($MILLION)
- TABLE 91. REST OF ASIA-PACIFIC ADAPTIVE SECURITY MARKET, BY DEPLOYMENT MODE, 2022-2032 ($MILLION)
- TABLE 92. REST OF ASIA-PACIFIC ADAPTIVE SECURITY MARKET, BY APPLICATION, 2022-2032 ($MILLION)
- TABLE 93. REST OF ASIA-PACIFIC ADAPTIVE SECURITY MARKET, BY INDUSTRY VERTICAL, 2022-2032 ($MILLION)
- TABLE 94. LAMEA ADAPTIVE SECURITY MARKET, BY COMPONENT, 2022-2032 ($MILLION)
- TABLE 95. LAMEA ADAPTIVE SECURITY MARKET, BY DEPLOYMENT MODE, 2022-2032 ($MILLION)
- TABLE 96. LAMEA ADAPTIVE SECURITY MARKET, BY APPLICATION, 2022-2032 ($MILLION)
- TABLE 97. LAMEA ADAPTIVE SECURITY MARKET, BY INDUSTRY VERTICAL, 2022-2032 ($MILLION)
- TABLE 98. LAMEA ADAPTIVE SECURITY MARKET, BY COUNTRY, 2022-2032 ($MILLION)
- TABLE 99. LATIN AMERICA ADAPTIVE SECURITY MARKET, BY COMPONENT, 2022-2032 ($MILLION)
- TABLE 100. LATIN AMERICA ADAPTIVE SECURITY MARKET, BY DEPLOYMENT MODE, 2022-2032 ($MILLION)
- TABLE 101. LATIN AMERICA ADAPTIVE SECURITY MARKET, BY APPLICATION, 2022-2032 ($MILLION)
- TABLE 102. LATIN AMERICA ADAPTIVE SECURITY MARKET, BY INDUSTRY VERTICAL, 2022-2032 ($MILLION)
- TABLE 103. MIDDLE EAST ADAPTIVE SECURITY MARKET, BY COMPONENT, 2022-2032 ($MILLION)
- TABLE 104. MIDDLE EAST ADAPTIVE SECURITY MARKET, BY DEPLOYMENT MODE, 2022-2032 ($MILLION)
- TABLE 105. MIDDLE EAST ADAPTIVE SECURITY MARKET, BY APPLICATION, 2022-2032 ($MILLION)
- TABLE 106. MIDDLE EAST ADAPTIVE SECURITY MARKET, BY INDUSTRY VERTICAL, 2022-2032 ($MILLION)
- TABLE 107. AFRICA ADAPTIVE SECURITY MARKET, BY COMPONENT, 2022-2032 ($MILLION)
- TABLE 108. AFRICA ADAPTIVE SECURITY MARKET, BY DEPLOYMENT MODE, 2022-2032 ($MILLION)
- TABLE 109. AFRICA ADAPTIVE SECURITY MARKET, BY APPLICATION, 2022-2032 ($MILLION)
- TABLE 110. AFRICA ADAPTIVE SECURITY MARKET, BY INDUSTRY VERTICAL, 2022-2032 ($MILLION)
- TABLE 111. ARUBA NETWORKS INC.: KEY EXECUTIVES
- TABLE 112. ARUBA NETWORKS INC.: COMPANY SNAPSHOT
- TABLE 113. ARUBA NETWORKS INC.: SERVICE SEGMENTS
- TABLE 114. ARUBA NETWORKS INC.: PRODUCT PORTFOLIO
- TABLE 115. ARUBA NETWORKS INC.: KEY STRATERGIES
- TABLE 116. CISCO SYSTEMS INC.: KEY EXECUTIVES
- TABLE 117. CISCO SYSTEMS INC.: COMPANY SNAPSHOT
- TABLE 118. CISCO SYSTEMS INC.: PRODUCT SEGMENTS
- TABLE 119. CISCO SYSTEMS INC.: PRODUCT PORTFOLIO
- TABLE 120. CISCO SYSTEMS INC.: KEY STRATERGIES
- TABLE 121. CLOUDWICK INC.: KEY EXECUTIVES
- TABLE 122. CLOUDWICK INC.: COMPANY SNAPSHOT
- TABLE 123. CLOUDWICK INC.: SERVICE SEGMENTS
- TABLE 124. CLOUDWICK INC.: PRODUCT PORTFOLIO
- TABLE 125. CLOUDWICK INC.: KEY STRATERGIES
- TABLE 126. FORTINET, INC.: KEY EXECUTIVES
- TABLE 127. FORTINET, INC.: COMPANY SNAPSHOT
- TABLE 128. FORTINET, INC.: SERVICE SEGMENTS
- TABLE 129. FORTINET, INC.: PRODUCT PORTFOLIO
- TABLE 130. FORTINET, INC.: KEY STRATERGIES
- TABLE 131. IBM CORPORATION: KEY EXECUTIVES
- TABLE 132. IBM CORPORATION: COMPANY SNAPSHOT
- TABLE 133. IBM CORPORATION: SERVICE SEGMENTS
- TABLE 134. IBM CORPORATION: PRODUCT PORTFOLIO
- TABLE 135. IBM CORPORATION: KEY STRATERGIES
- TABLE 136. JUNIPER NETWORKS INC.: KEY EXECUTIVES
- TABLE 137. JUNIPER NETWORKS INC.: COMPANY SNAPSHOT
- TABLE 138. JUNIPER NETWORKS INC.: PRODUCT SEGMENTS
- TABLE 139. JUNIPER NETWORKS INC.: PRODUCT PORTFOLIO
- TABLE 140. JUNIPER NETWORKS INC.: KEY STRATERGIES
- TABLE 141. PANDA SECURITY INC.: KEY EXECUTIVES
- TABLE 142. PANDA SECURITY INC.: COMPANY SNAPSHOT
- TABLE 143. PANDA SECURITY INC.: SERVICE SEGMENTS
- TABLE 144. PANDA SECURITY INC.: PRODUCT PORTFOLIO
- TABLE 145. PANDA SECURITY INC.: KEY STRATERGIES
- TABLE 146. RAPID7 INC.: KEY EXECUTIVES
- TABLE 147. RAPID7 INC.: COMPANY SNAPSHOT
- TABLE 148. RAPID7 INC.: SERVICE SEGMENTS
- TABLE 149. RAPID7 INC.: PRODUCT PORTFOLIO
- TABLE 150. RAPID7 INC.: KEY STRATERGIES
- TABLE 151. RSA SECURITY LLC: KEY EXECUTIVES
- TABLE 152. RSA SECURITY LLC: COMPANY SNAPSHOT
- TABLE 153. RSA SECURITY LLC: SERVICE SEGMENTS
- TABLE 154. RSA SECURITY LLC: PRODUCT PORTFOLIO
- TABLE 155. RSA SECURITY LLC: KEY STRATERGIES
- TABLE 156. TREND MICRO INCORPORATED: KEY EXECUTIVES
- TABLE 157. TREND MICRO INCORPORATED: COMPANY SNAPSHOT
- TABLE 158. TREND MICRO INCORPORATED: SERVICE SEGMENTS
- TABLE 159. TREND MICRO INCORPORATED: PRODUCT PORTFOLIO
- TABLE 160. TREND MICRO INCORPORATED: KEY STRATERGIES
LIST OF FIGURES
- FIGURE 01. ADAPTIVE SECURITY MARKET, 2022-2032
- FIGURE 02. SEGMENTATION OF ADAPTIVE SECURITY MARKET, 2022-2032
- FIGURE 03. TOP INVESTMENT POCKETS IN ADAPTIVE SECURITY MARKET (2023-2032)
- FIGURE 04. MODERATE-TO-HIGH BARGAINING POWER OF SUPPLIERS
- FIGURE 05. MODERATE BARGAINING POWER OF BUYERS
- FIGURE 06. LOW THREAT OF SUBSTITUTES
- FIGURE 07. LOW-TO-HIGH THREAT OF NEW ENTRANTS
- FIGURE 08. LOW-TO-HIGH INTENSITY OF RIVALRY
- FIGURE 09. DRIVERS, RESTRAINTS AND OPPORTUNITIES: GLOBALADAPTIVE SECURITY MARKET
- FIGURE 10. ADAPTIVE SECURITY MARKET, BY COMPONENT, 2022(%)
- FIGURE 11. COMPARATIVE SHARE ANALYSIS OF ADAPTIVE SECURITY MARKET FOR SOLUTION, BY COUNTRY 2022 AND 2032(%)
- FIGURE 12. COMPARATIVE SHARE ANALYSIS OF ADAPTIVE SECURITY MARKET FOR SERVICE, BY COUNTRY 2022 AND 2032(%)
- FIGURE 13. ADAPTIVE SECURITY MARKET, BY DEPLOYMENT MODE, 2022(%)
- FIGURE 14. COMPARATIVE SHARE ANALYSIS OF ADAPTIVE SECURITY MARKET FOR ON-PREMISE, BY COUNTRY 2022 AND 2032(%)
- FIGURE 15. COMPARATIVE SHARE ANALYSIS OF ADAPTIVE SECURITY MARKET FOR CLOUD, BY COUNTRY 2022 AND 2032(%)
- FIGURE 16. ADAPTIVE SECURITY MARKET, BY APPLICATION, 2022(%)
- FIGURE 17. COMPARATIVE SHARE ANALYSIS OF ADAPTIVE SECURITY MARKET FOR NETWORK SECURITY, BY COUNTRY 2022 AND 2032(%)
- FIGURE 18. COMPARATIVE SHARE ANALYSIS OF ADAPTIVE SECURITY MARKET FOR APPLICATION SECURITY, BY COUNTRY 2022 AND 2032(%)
- FIGURE 19. COMPARATIVE SHARE ANALYSIS OF ADAPTIVE SECURITY MARKET FOR END POINT SECURITY, BY COUNTRY 2022 AND 2032(%)
- FIGURE 20. COMPARATIVE SHARE ANALYSIS OF ADAPTIVE SECURITY MARKET FOR CLOUD SECURITY, BY COUNTRY 2022 AND 2032(%)
- FIGURE 21. COMPARATIVE SHARE ANALYSIS OF ADAPTIVE SECURITY MARKET FOR OTHERS, BY COUNTRY 2022 AND 2032(%)
- FIGURE 22. ADAPTIVE SECURITY MARKET, BY INDUSTRY VERTICAL, 2022(%)
- FIGURE 23. COMPARATIVE SHARE ANALYSIS OF ADAPTIVE SECURITY MARKET FOR BFSI, BY COUNTRY 2022 AND 2032(%)
- FIGURE 24. COMPARATIVE SHARE ANALYSIS OF ADAPTIVE SECURITY MARKET FOR IT AND TELECOM, BY COUNTRY 2022 AND 2032(%)
- FIGURE 25. COMPARATIVE SHARE ANALYSIS OF ADAPTIVE SECURITY MARKET FOR RETAIL AND ECOMMERCE, BY COUNTRY 2022 AND 2032(%)
- FIGURE 26. COMPARATIVE SHARE ANALYSIS OF ADAPTIVE SECURITY MARKET FOR MANUFACTURING, BY COUNTRY 2022 AND 2032(%)
- FIGURE 27. COMPARATIVE SHARE ANALYSIS OF ADAPTIVE SECURITY MARKET FOR HEALTHCARE, BY COUNTRY 2022 AND 2032(%)
- FIGURE 28. COMPARATIVE SHARE ANALYSIS OF ADAPTIVE SECURITY MARKET FOR ENERGY AND UTILITIES, BY COUNTRY 2022 AND 2032(%)
- FIGURE 29. COMPARATIVE SHARE ANALYSIS OF ADAPTIVE SECURITY MARKET FOR GOVERNMENT AND DEFENSE, BY COUNTRY 2022 AND 2032(%)
- FIGURE 30. COMPARATIVE SHARE ANALYSIS OF ADAPTIVE SECURITY MARKET FOR OTHERS, BY COUNTRY 2022 AND 2032(%)
- FIGURE 31. ADAPTIVE SECURITY MARKET BY REGION, 2022
- FIGURE 32. U.S. ADAPTIVE SECURITY MARKET, 2022-2032 ($MILLION)
- FIGURE 33. CANADA ADAPTIVE SECURITY MARKET, 2022-2032 ($MILLION)
- FIGURE 34. UK ADAPTIVE SECURITY MARKET, 2022-2032 ($MILLION)
- FIGURE 35. GERMANY ADAPTIVE SECURITY MARKET, 2022-2032 ($MILLION)
- FIGURE 36. FRANCE ADAPTIVE SECURITY MARKET, 2022-2032 ($MILLION)
- FIGURE 37. ITALY ADAPTIVE SECURITY MARKET, 2022-2032 ($MILLION)
- FIGURE 38. SPAIN ADAPTIVE SECURITY MARKET, 2022-2032 ($MILLION)
- FIGURE 39. REST OF EUROPE ADAPTIVE SECURITY MARKET, 2022-2032 ($MILLION)
- FIGURE 40. CHINA ADAPTIVE SECURITY MARKET, 2022-2032 ($MILLION)
- FIGURE 41. JAPAN ADAPTIVE SECURITY MARKET, 2022-2032 ($MILLION)
- FIGURE 42. INDIA ADAPTIVE SECURITY MARKET, 2022-2032 ($MILLION)
- FIGURE 43. AUSTRALIA ADAPTIVE SECURITY MARKET, 2022-2032 ($MILLION)
- FIGURE 44. SOUTH KOREA ADAPTIVE SECURITY MARKET, 2022-2032 ($MILLION)
- FIGURE 45. REST OF ASIA-PACIFIC ADAPTIVE SECURITY MARKET, 2022-2032 ($MILLION)
- FIGURE 46. LATIN AMERICA ADAPTIVE SECURITY MARKET, 2022-2032 ($MILLION)
- FIGURE 47. MIDDLE EAST ADAPTIVE SECURITY MARKET, 2022-2032 ($MILLION)
- FIGURE 48. AFRICA ADAPTIVE SECURITY MARKET, 2022-2032 ($MILLION)
- FIGURE 49. TOP WINNING STRATEGIES, BY YEAR
- FIGURE 50. TOP WINNING STRATEGIES, BY DEVELOPMENT
- FIGURE 51. TOP WINNING STRATEGIES, BY COMPANY
- FIGURE 52. PRODUCT MAPPING OF TOP 10 PLAYERS
- FIGURE 53. COMPETITIVE DASHBOARD
- FIGURE 54. COMPETITIVE HEATMAP: ADAPTIVE SECURITY MARKET
- FIGURE 55. TOP PLAYER POSITIONING, 2022
- FIGURE 56. ARUBA NETWORKS INC.: NET REVENUE, 2019-2021 ($MILLION)
- FIGURE 57. ARUBA NETWORKS INC.: NET REVENUE, 2019-2021 ($MILLION)
- FIGURE 58. ARUBA NETWORKS INC.: REVENUE SHARE BY REGION, 2021 (%)
- FIGURE 59. CISCO SYSTEMS INC.: RESEARCH & DEVELOPMENT EXPENDITURE, 2020-2022 ($MILLION)
- FIGURE 60. CISCO SYSTEMS INC.: NET SALES, 2020-2022 ($MILLION)
- FIGURE 61. CISCO SYSTEMS INC.: REVENUE SHARE BY SEGMENT, 2022 (%)
- FIGURE 62. CISCO SYSTEMS INC.: REVENUE SHARE BY REGION, 2022 (%)
- FIGURE 63. FORTINET, INC.: NET REVENUE, 2020-2022 ($MILLION)
- FIGURE 64. FORTINET, INC.: RESEARCH & DEVELOPMENT EXPENDITURE, 2020-2021 ($MILLION)
- FIGURE 65. FORTINET, INC.: REVENUE SHARE BY SEGMENT, 2022 (%)
- FIGURE 66. FORTINET, INC.: REVENUE SHARE BY REGION, 2021 (%)
- FIGURE 67. IBM CORPORATION: RESEARCH & DEVELOPMENT EXPENDITURE, 2020-2022 ($MILLION)
- FIGURE 68. IBM CORPORATION: NET REVENUE, 2020-2022 ($MILLION)
- FIGURE 69. IBM CORPORATION: REVENUE SHARE BY SEGMENT, 2022 (%)
- FIGURE 70. IBM CORPORATION: REVENUE SHARE BY REGION, 2022 (%)
- FIGURE 71. JUNIPER NETWORKS INC.: NET REVENUE, 2019-2021 ($MILLION)
- FIGURE 72. JUNIPER NETWORKS INC.: RESEARCH & DEVELOPMENT EXPENDITURE, 2019-2021 ($MILLION)
- FIGURE 73. JUNIPER NETWORKS INC.: REVENUE SHARE BY REGION, 2021 (%)
- FIGURE 74. JUNIPER NETWORKS INC.: REVENUE SHARE BY SEGMENT, 2021 (%)
- FIGURE 75. TREND MICRO INCORPORATED: NET REVENUE, 2019-2021 ($MILLION)
- FIGURE 76. TREND MICRO INCORPORATED: REVENUE SHARE BY REGION, 2020 (%)


