


 |
市場調查報告書
商品編碼
1298379
有機化學品市場:按最終用途行業劃分的副產品:2023-2032 年全球機會分析和行業預測Organic Chemicals Market By Product, By End Use Industry : Global Opportunity Analysis and Industry Forecast, 2023-2032 |
||||||
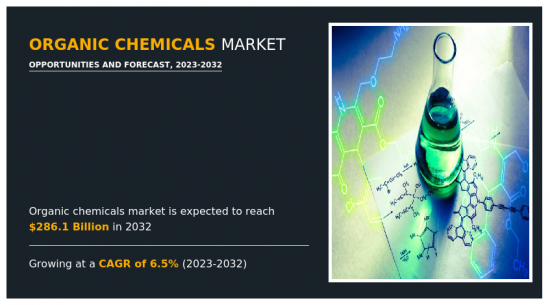
2022年有機化學品市場價值為1532億美元,預計到2032年將達到2860億美元,2023年至2032年復合年增長率為6.5%。
有機化學品或化合物是一類特殊的含有碳氫鍵的化合物。碳表現出一種稱為鏈化的獨特性質,使其能夠形成許多具有不同碳氫鍵的有機化合物及其衍生物。這些化學物質可以自然獲得,也可以通過人造過程生產。有機化學品分為香料、空氣清新劑和各種醇類,廣泛應用於食品飲料、藥品、化妝品、化肥等行業。
人們對自我美容活動的認識不斷增強,導致個人護理領域的需求顯著增加,其中脂肪族碳氫化合物被廣泛用於製造各種個人護理產品,例如嬰兒油、嬰兒洗髮水、護髮素、防曬霜、面霜和乳液。連接到這可能是脂肪烴有機化學品市場增長的關鍵因素之一。此外,意大利、日本等國家老年人口的不斷增長正在推動對基於脂肪烴的抗衰老霜的需求。這些因素預計將促進個人護理和化妝品應用有機化學品的銷售,推動市場的增長。
此外,可支配收入的增加加上時尚意識的提高,導致紡織行業出現了巨大的需求,酮被廣泛用作紡織行業的溶劑。這一因素可能是導致酮類有機化學品市場增長的主要驅動因素之一。此外,對各種消費品的需求不斷增長,導致發達經濟體和新興經濟體快速工業化,有機醛用於生產各種工業化學品、染料和溶劑。這可能會推動預測期內對醛的需求。
有機化學品的最大優點之一是它們大多數可以從植物、動物、煤炭、石油和木材等自然資源中生產。它們幾乎在世界各地都很容易買到。這使得有機化學品很容易獲得。此外,企業社會責任(CSR)活動的增加和使用無害化學品意識的增強等因素推動了有機化學品在多個最終用途領域的普及。這可能會推動預測期內對有機化學品的需求。
然而,鋁鑄造涉及多個步驟,例如熔化金屬、將熔融金屬轉移至模具型腔以及使熔融金屬凝固。這些過程需要相對大量的熱能。此外,整個過程由各種專為在高溫應用中運行而製造的先進設備組成。這些因素使得鋁鑄造成為一種昂貴的工藝,這反過來可能會阻礙投資潛力較低的製造商進入鋁鑄造市場。因此,與鋁鑄件生產相關的高投資成本可能會阻礙預測期內的市場增長。
相反,有機化工行業是技術驅動型行業,研發投入巨大,在價值鏈中發揮著關鍵作用。這些研發投資和創新應用降低的生產成本預計將為行業參與者帶來許多機會。旨在鼓勵印度等新興經濟體製造業的政府舉措預計將為有機化學品市場發展開闢新的機遇。
目錄
第 1 章 簡介
第二章執行摘要
第三章市場概況
- 市場定義和範圍
- 主要發現
- 影響因素
- 主要投資機會
- 波特五力分析
- 供應商的議價能力
- 買方議價能力
- 替代品的威脅
- 新進入者的威脅
- 競爭強度
- 市場動態
- 促進者
- 食品和飲料行業越來越多地採用有機化學品
- 醫藥行業需求旺盛
- 建築領域對油漆和塗料的需求增加
- 天然原料
- 阻礙因素
- 有機化學品成本高
- 機會
- 玩家整合
- 激活技術主導的研發活動
- 促進者
- COVID-19 市場影響分析
- 關鍵監管分析
- 專利情況
- 價格分析
- 監管指南
- 價值鏈分析
4. 按產品劃分的有機化學品市場
- 概述
- 市場規模及預測
- 酸
- 主要市場趨勢、增長動力和機遇
- 市場規模/預測:按地區
- 市場份額分析:按國家分類
- 酸、有機化學品市場,按類型
- 醋酸市場規模和預測:按地區
- 醋酸市場規模及預測:按國家劃分
- 乳酸市場規模和預測:按地區
- 乳酸市場規模及預測:按國家劃分
- 檸檬酸市場規模及預測:按地區
- 檸檬酸市場規模及預測:按國家劃分
- 其他市場規模/預測:按地區
- 其他市場規模/預測:按國家分類
- 醇和醚
- 主要市場趨勢、增長動力和機遇
- 市場規模/預測:按地區
- 市場份額分析:按國家分類
- 胺和□胺
- 主要市場趨勢、增長動力和機遇
- 市場規模/預測:按地區
- 市場份額分析:按國家分類
- 醛和酮
- 主要市場趨勢、增長動力和機遇
- 市場規模/預測:按地區
- 市場份額分析:按國家分類
- 其他
- 主要市場趨勢、增長動力和機遇
- 市場規模/預測:按地區
- 市場份額分析:按國家分類
5 有機化學品市場(按最終用途行業)
- 概述
- 市場規模及預測
- 藥品
- 主要市場趨勢、增長動力和機遇
- 市場規模/預測:按地區
- 市場份額分析:按國家分類
- 農藥
- 主要市場趨勢、增長動力和機遇
- 市場規模/預測:按地區
- 市場份額分析:按國家分類
- 個人護理和化妝品
- 主要市場趨勢、增長動力和機遇
- 市場規模/預測:按地區
- 市場份額分析:按國家分類
- 飲食
- 主要市場趨勢、增長動力和機遇
- 市場規模/預測:按地區
- 市場份額分析:按國家分類
- 其他
- 主要市場趨勢、增長動力和機遇
- 市場規模/預測:按地區
- 市場份額分析:按國家分類
6. 按地區劃分的有機化學品市場
- 概述
- 市場規模/預測:按地區
- 北美
- 主要趨勢和機遇
- 市場規模/預測:按產品分類
- 北美酸、有機化學品市場,按類型
- 市場規模和預測:按最終用途行業
- 市場規模/預測:按國家
- 美國
- 主要市場趨勢、增長動力和機遇
- 市場規模/預測:按產品分類
- 美國酸、有機化學品市場,按類型
- 市場規模和預測:按最終用途行業
- 加拿大
- 主要市場趨勢、增長動力和機遇
- 市場規模/預測:按產品分類
- 加拿大酸、有機化學品市場,按類型
- 市場規模和預測:按最終用途行業
- 墨西哥
- 主要市場趨勢、增長動力和機遇
- 市場規模/預測:按產品分類
- 墨西哥酸、有機化學品市場,按類型
- 市場規模和預測:按最終用途行業
- 歐洲
- 主要趨勢和機遇
- 市場規模/預測:按產品分類
- 歐洲酸和有機化學品市場:按類型
- 市場規模和預測:按最終用途行業
- 市場規模/預測:按國家
- 德國
- 主要市場趨勢、增長動力和機遇
- 市場規模/預測:按產品分類
- 德國酸、有機化學品市場:按類型
- 市場規模和預測:按最終用途行業
- 英國
- 主要市場趨勢、增長動力和機遇
- 市場規模/預測:按產品分類
- 英國酸、有機化學品市場,按類型
- 市場規模和預測:按最終用途行業
- 法國
- 主要市場趨勢、增長動力和機遇
- 市場規模/預測:按產品分類
- 法國酸、有機化學品市場:按類型
- 市場規模和預測:按最終用途行業
- 西班牙
- 主要市場趨勢、增長動力和機遇
- 市場規模/預測:按產品分類
- 西班牙酸、有機化學品市場:按類型
- 市場規模和預測:按最終用途行業
- 意大利
- 主要市場趨勢、增長動力和機遇
- 市場規模/預測:按產品分類
- 意大利酸、有機化學品市場:按類型
- 市場規模和預測:按最終用途行業
- 歐洲其他地區
- 主要市場趨勢、增長動力和機遇
- 市場規模/預測:按產品分類
- 其他歐洲酸和有機化學品市場(按類型)
- 市場規模和預測:按最終用途行業
- 亞太地區
- 主要趨勢和機遇
- 市場規模/預測:按產品分類
- 亞太地區酸、有機化學品市場,按類型
- 市場規模和預測:按最終用途行業
- 市場規模/預測:按國家
- 中國
- 主要市場趨勢、增長動力和機遇
- 市場規模/預測:按產品分類
- 中國酸、有機化學品市場:按類型
- 市場規模和預測:按最終用途行業
- 印度
- 主要市場趨勢、增長動力和機遇
- 市場規模/預測:按產品分類
- 印度酸、有機化學品市場:按類型
- 市場規模和預測:按最終用途行業
- 日本
- 主要市場趨勢、增長動力和機遇
- 市場規模/預測:按產品分類
- 日本酸和有機化學品市場:按類型
- 市場規模和預測:按最終用途行業
- 韓國
- 主要市場趨勢、增長動力和機遇
- 市場規模/預測:按產品分類
- 韓國酸、有機化學品市場:按類型
- 市場規模和預測:按最終用途行業
- 澳大利亞
- 主要市場趨勢、增長動力和機遇
- 市場規模/預測:按產品分類
- 澳大利亞酸、有機化學品市場,按類型
- 市場規模和預測:按最終用途行業
- 亞太其他地區
- 主要市場趨勢、增長動力和機遇
- 市場規模/預測:按產品分類
- 其他亞太酸、有機化學品市場,按類型
- 市場規模和預測:按最終用途行業
- 拉丁美洲/中東/非洲
- 主要趨勢和機遇
- 市場規模/預測:按產品分類
- LAMEA 酸、有機化學品市場:按類型
- 市場規模和預測:按最終用途行業
- 市場規模/預測:按國家
- 巴西
- 主要市場趨勢、增長動力和機遇
- 市場規模/預測:按產品分類
- 巴西酸、有機化學品市場:按類型
- 市場規模和預測:按最終用途行業
- 沙特阿拉伯
- 主要市場趨勢、增長動力和機遇
- 市場規模/預測:按產品分類
- 沙特阿拉伯酸、有機化學品市場:按類型
- 市場規模和預測:按最終用途行業
- 南非共和國
- 主要市場趨勢、增長動力和機遇
- 市場規模/預測:按產品分類
- 南非酸、有機化學品市場:按類型
- 市場規模和預測:按最終用途行業
- 其他地區
- 主要市場趨勢、增長動力和機遇
- 市場規模/預測:按產品分類
- LAMEA 其他地區的酸、有機化學品市場:按類型
- 市場規模和預測:按最終用途行業
第7章 競爭格局
- 介紹
- 關鍵成功策略
- 10大公司產品圖
- 比賽儀表板
- 比賽熱圖
- 2022 年頂級公司定位
第八章公司簡介
- TCI America
- BASF SE
- Dow
- akzonobel
- Cargill
- vinati organics limited
- Hindustan Organic Chemicals Limited
- Royal Dutch Shell plc
- neogen chemicals limited
- CHEMPLAST SANMAR LIMITED
The organic chemicals market valued for $153.2 billion in 2022 and is estimated to reach $286.0 billion by 2032, exhibiting a CAGR of 6.5% from 2023 to 2032.
Organic chemical or compound is a special category of compound that contains carbon-hydrogen bonds. Carbon shows a unique property called catenation that enables it to form numerous organic compounds with different carbon hydrogen bonds and its derivatives. These chemicals can be obtained naturally or can also be produced by artificial processes as well. Organic chemicals are classified into flavoring agents, aromatic agents, & various alcohols, and are widely used in industries such as food & beverages, pharmaceuticals, cosmetics, and fertilizers.
The rise in awareness for self-grooming activities have led the personal care sector to witness a significant increase in demand where aliphatic hydrocarbons are widely used for producing a wide range of personal care products such as baby oil, baby shampoos, hair conditions, sunscreens, creams & lotions, and others. This may act as one the key drivers responsible for the growth of the organic chemicals market for aliphatic hydrocarbons. Furthermore, increase in geriatric population in countries such as Italy, Japan, and others have fostered the demand for aliphatic hydrocarbon-based anti-ageing creams. This factor is anticipated to increase the sales of organic chemicals for personal care & cosmetics applications; thus, boosting the market growth.
Furthermore, the increase in disposable income coupled with rise in fashion consciousness has led the textile sector to witness a significant demand where ketones are widely used as solvents in textile sector. This factor may act as one of the key drivers responsible for the growth of the organic chemicals market for ketones type. Furthermore, rise in demand for a wide range of consumer goods has led to rapid industrialization in both developed and developing economies where organic aldehydes are used in manufacturing various industrial chemicals, dyes, and solvents. This may fuel the demand for aldehydes during the forecast period.
One of the greatest advantages of organic chemicals is that majority of it can be manufactured from natural sources such as plants, animals, coal, petroleum, and wood. These are easily available in almost every region across the globe. This factor has eased the availability of organic chemicals. Moreover, factor such as rise in corporate social responsibility (CSR) activities coupled with growth in awareness for using non-toxic chemicals have surged the popularity of organic chemicals among several end-use sectors. This may fuel the demand for organic chemicals during the forecast period.
However, aluminum casting involves several processes such as melting of metal, transferring the molten metal to mold cavity, and solidification of molten metal. These processes require a relatively large amount of heat energy. Furthermore, the overall process consists of different sophisticated equipment that are fabricated to work at high temperature application. These factors make aluminum casting an expensive process which in turn may restrain manufacturers with less investment potential to enter into aluminum casting market. Thus, high investment costs associated with the production of aluminum castings may hamper the market growth during the forecast period.
On the contrary, since the organic chemical industry is technology-driven, there is huge spending on R&D and this plays a crucial role in the value chain. These R&D investments regarding innovative applications as well as a reduction in production costs are expected to bring numerous opportunities for the industry players. The government initiatives with an aim to encourage the manufacturing industry in emerging economies such as India are anticipated to open new opportunities for organic chemicals market development.
The organic chemicals market is segmented on the basis of product, application, and region. On the basis of product, the market is categorized into acids, alcohols & ethers, amines & amides, aldehydes & ketones, and others. On the basis of end-use industry, it is divided into pharmaceuticals, agrochemicals, personal care & cosmetics, food & beverages, and others. Region-wise, the market is studied across North America, Europe, Asia-Pacific, and LAMEA.
The global organic chemicals market profiles leading players that include: Akzonobel, BASF SE, Cargill, CHEMPLAST SANMAR LIMITED, Dow, Hindustan Organic Chemicals Limited, Neogen Chemicals Limited, Royal Dutch Shell plc, TCI America, Vinati organics Limited. The global organic chemicals market report provides in-depth competitive analysis as well as profiles of these major players.
Key Benefits For Stakeholders
- This report provides a quantitative analysis of the market segments, current trends, estimations, and dynamics of the organic chemicals market analysis from 2022 to 2032 to identify the prevailing organic chemicals market opportunities.
- The market research is offered along with information related to key drivers, restraints, and opportunities.
- Porter's five forces analysis highlights the potency of buyers and suppliers to enable stakeholders make profit-oriented business decisions and strengthen their supplier-buyer network.
- In-depth analysis of the organic chemicals market segmentation assists to determine the prevailing market opportunities.
- Major countries in each region are mapped according to their revenue contribution to the global market.
- Market player positioning facilitates benchmarking and provides a clear understanding of the present position of the market players.
- The report includes the analysis of the regional as well as global organic chemicals market trends, key players, market segments, application areas, and market growth strategies.
Key Market Segments
By Product
- Acids
- Type
- Acetic Acid
- Lactic Acid
- Citric Acid
- Others
- Alcohols and Ethers
- Amines and Amides
- Aldehydes and Ketones
- Others
By End Use Industry
- Agrochemicals
- Personal Care and Cosmetics
- Food and Beverages
- Others
- Pharmaceuticals
By Region
- North America
- U.S.
- Canada
- Mexico
- Europe
- Germany
- UK
- France
- Spain
- Italy
- Rest of Europe
- Asia-Pacific
- China
- India
- Japan
- South Korea
- Australia
- Rest of Asia-Pacific
- LAMEA
- Brazil
- Saudi Arabia
- South Africa
- Rest of LAMEA
Key Market Players:
- akzonobel
- BASF SE
- Cargill
- CHEMPLAST SANMAR LIMITED
- Dow
- Hindustan Organic Chemicals Limited
- neogen chemicals limited
- Royal Dutch Shell plc
- TCI America
- vinati organics limited
TABLE OF CONTENTS
CHAPTER 1: INTRODUCTION
- 1.1. Report description
- 1.2. Key market segments
- 1.3. Key benefits to the stakeholders
- 1.4. Research Methodology
- 1.4.1. Primary research
- 1.4.2. Secondary research
- 1.4.3. Analyst tools and models
CHAPTER 2: EXECUTIVE SUMMARY
- 2.1. CXO Perspective
CHAPTER 3: MARKET OVERVIEW
- 3.1. Market definition and scope
- 3.2. Key findings
- 3.2.1. Top impacting factors
- 3.2.2. Top investment pockets
- 3.3. Porter's five forces analysis
- 3.3.1. Bargaining power of suppliers
- 3.3.2. Bargaining power of buyers
- 3.3.3. Threat of substitutes
- 3.3.4. Threat of new entrants
- 3.3.5. Intensity of rivalry
- 3.4. Market dynamics
- 3.4.1. Drivers
- 3.4.1.1. Increasing adoption of organic chemicals in food & beverage industry
- 3.4.1.2. Robust demand from the pharmaceutical sector
- 3.4.1.3. Rise in demand for paints & coatings from architecture sector
- 3.4.1.4. Natural raw material sources
- 3.4.1. Drivers
- 3.4.2. Restraints
- 3.4.2.1. High costs of organic chemicals
- 3.4.3. Opportunities
- 3.4.3.1. Consolidation of players
- 3.4.3.2. Rise in technology-driven R&D activities
- 3.5. COVID-19 Impact Analysis on the market
- 3.6. Key Regulation Analysis
- 3.7. Patent Landscape
- 3.8. Pricing Analysis
- 3.9. Regulatory Guidelines
- 3.10. Value Chain Analysis
CHAPTER 4: ORGANIC CHEMICALS MARKET, BY PRODUCT
- 4.1. Overview
- 4.1.1. Market size and forecast
- 4.2. Acids
- 4.2.1. Key market trends, growth factors and opportunities
- 4.2.2. Market size and forecast, by region
- 4.2.3. Market share analysis by country
- 4.2.4. Acids Organic Chemicals Market by Type
- 4.2.4.1. Acetic Acid Market size and forecast, by region
- 4.2.4.2. Acetic Acid Market size and forecast, by country
- 4.2.4.3. Lactic Acid Market size and forecast, by region
- 4.2.4.4. Lactic Acid Market size and forecast, by country
- 4.2.4.5. Citric Acid Market size and forecast, by region
- 4.2.4.6. Citric Acid Market size and forecast, by country
- 4.2.4.7. Others Market size and forecast, by region
- 4.2.4.8. Others Market size and forecast, by country
- 4.3. Alcohols and Ethers
- 4.3.1. Key market trends, growth factors and opportunities
- 4.3.2. Market size and forecast, by region
- 4.3.3. Market share analysis by country
- 4.4. Amines and Amides
- 4.4.1. Key market trends, growth factors and opportunities
- 4.4.2. Market size and forecast, by region
- 4.4.3. Market share analysis by country
- 4.5. Aldehydes and Ketones
- 4.5.1. Key market trends, growth factors and opportunities
- 4.5.2. Market size and forecast, by region
- 4.5.3. Market share analysis by country
- 4.6. Others
- 4.6.1. Key market trends, growth factors and opportunities
- 4.6.2. Market size and forecast, by region
- 4.6.3. Market share analysis by country
CHAPTER 5: ORGANIC CHEMICALS MARKET, BY END USE INDUSTRY
- 5.1. Overview
- 5.1.1. Market size and forecast
- 5.2. Pharmaceuticals
- 5.2.1. Key market trends, growth factors and opportunities
- 5.2.2. Market size and forecast, by region
- 5.2.3. Market share analysis by country
- 5.3. Agrochemicals
- 5.3.1. Key market trends, growth factors and opportunities
- 5.3.2. Market size and forecast, by region
- 5.3.3. Market share analysis by country
- 5.4. Personal Care and Cosmetics
- 5.4.1. Key market trends, growth factors and opportunities
- 5.4.2. Market size and forecast, by region
- 5.4.3. Market share analysis by country
- 5.5. Food and Beverages
- 5.5.1. Key market trends, growth factors and opportunities
- 5.5.2. Market size and forecast, by region
- 5.5.3. Market share analysis by country
- 5.6. Others
- 5.6.1. Key market trends, growth factors and opportunities
- 5.6.2. Market size and forecast, by region
- 5.6.3. Market share analysis by country
CHAPTER 6: ORGANIC CHEMICALS MARKET, BY REGION
- 6.1. Overview
- 6.1.1. Market size and forecast By Region
- 6.2. North America
- 6.2.1. Key trends and opportunities
- 6.2.2. Market size and forecast, by Product
- 6.2.2.1. North America Acids Organic Chemicals Market by Type
- 6.2.3. Market size and forecast, by End Use Industry
- 6.2.4. Market size and forecast, by country
- 6.2.4.1. U.S.
- 6.2.4.1.1. Key market trends, growth factors and opportunities
- 6.2.4.1.2. Market size and forecast, by Product
- 6.2.4.1.2.1. U.S. Acids Organic Chemicals Market by Type
- 6.2.4.1.3. Market size and forecast, by End Use Industry
- 6.2.4.2. Canada
- 6.2.4.2.1. Key market trends, growth factors and opportunities
- 6.2.4.2.2. Market size and forecast, by Product
- 6.2.4.2.2.1. Canada Acids Organic Chemicals Market by Type
- 6.2.4.2.3. Market size and forecast, by End Use Industry
- 6.2.4.3. Mexico
- 6.2.4.3.1. Key market trends, growth factors and opportunities
- 6.2.4.3.2. Market size and forecast, by Product
- 6.2.4.3.2.1. Mexico Acids Organic Chemicals Market by Type
- 6.2.4.3.3. Market size and forecast, by End Use Industry
- 6.3. Europe
- 6.3.1. Key trends and opportunities
- 6.3.2. Market size and forecast, by Product
- 6.3.2.1. Europe Acids Organic Chemicals Market by Type
- 6.3.3. Market size and forecast, by End Use Industry
- 6.3.4. Market size and forecast, by country
- 6.3.4.1. Germany
- 6.3.4.1.1. Key market trends, growth factors and opportunities
- 6.3.4.1.2. Market size and forecast, by Product
- 6.3.4.1.2.1. Germany Acids Organic Chemicals Market by Type
- 6.3.4.1.3. Market size and forecast, by End Use Industry
- 6.3.4.2. UK
- 6.3.4.2.1. Key market trends, growth factors and opportunities
- 6.3.4.2.2. Market size and forecast, by Product
- 6.3.4.2.2.1. UK Acids Organic Chemicals Market by Type
- 6.3.4.2.3. Market size and forecast, by End Use Industry
- 6.3.4.3. France
- 6.3.4.3.1. Key market trends, growth factors and opportunities
- 6.3.4.3.2. Market size and forecast, by Product
- 6.3.4.3.2.1. France Acids Organic Chemicals Market by Type
- 6.3.4.3.3. Market size and forecast, by End Use Industry
- 6.3.4.4. Spain
- 6.3.4.4.1. Key market trends, growth factors and opportunities
- 6.3.4.4.2. Market size and forecast, by Product
- 6.3.4.4.2.1. Spain Acids Organic Chemicals Market by Type
- 6.3.4.4.3. Market size and forecast, by End Use Industry
- 6.3.4.5. Italy
- 6.3.4.5.1. Key market trends, growth factors and opportunities
- 6.3.4.5.2. Market size and forecast, by Product
- 6.3.4.5.2.1. Italy Acids Organic Chemicals Market by Type
- 6.3.4.5.3. Market size and forecast, by End Use Industry
- 6.3.4.6. Rest of Europe
- 6.3.4.6.1. Key market trends, growth factors and opportunities
- 6.3.4.6.2. Market size and forecast, by Product
- 6.3.4.6.2.1. Rest of Europe Acids Organic Chemicals Market by Type
- 6.3.4.6.3. Market size and forecast, by End Use Industry
- 6.4. Asia-Pacific
- 6.4.1. Key trends and opportunities
- 6.4.2. Market size and forecast, by Product
- 6.4.2.1. Asia-Pacific Acids Organic Chemicals Market by Type
- 6.4.3. Market size and forecast, by End Use Industry
- 6.4.4. Market size and forecast, by country
- 6.4.4.1. China
- 6.4.4.1.1. Key market trends, growth factors and opportunities
- 6.4.4.1.2. Market size and forecast, by Product
- 6.4.4.1.2.1. China Acids Organic Chemicals Market by Type
- 6.4.4.1.3. Market size and forecast, by End Use Industry
- 6.4.4.2. India
- 6.4.4.2.1. Key market trends, growth factors and opportunities
- 6.4.4.2.2. Market size and forecast, by Product
- 6.4.4.2.2.1. India Acids Organic Chemicals Market by Type
- 6.4.4.2.3. Market size and forecast, by End Use Industry
- 6.4.4.3. Japan
- 6.4.4.3.1. Key market trends, growth factors and opportunities
- 6.4.4.3.2. Market size and forecast, by Product
- 6.4.4.3.2.1. Japan Acids Organic Chemicals Market by Type
- 6.4.4.3.3. Market size and forecast, by End Use Industry
- 6.4.4.4. South Korea
- 6.4.4.4.1. Key market trends, growth factors and opportunities
- 6.4.4.4.2. Market size and forecast, by Product
- 6.4.4.4.2.1. South Korea Acids Organic Chemicals Market by Type
- 6.4.4.4.3. Market size and forecast, by End Use Industry
- 6.4.4.5. Australia
- 6.4.4.5.1. Key market trends, growth factors and opportunities
- 6.4.4.5.2. Market size and forecast, by Product
- 6.4.4.5.2.1. Australia Acids Organic Chemicals Market by Type
- 6.4.4.5.3. Market size and forecast, by End Use Industry
- 6.4.4.6. Rest of Asia-Pacific
- 6.4.4.6.1. Key market trends, growth factors and opportunities
- 6.4.4.6.2. Market size and forecast, by Product
- 6.4.4.6.2.1. Rest of Asia-Pacific Acids Organic Chemicals Market by Type
- 6.4.4.6.3. Market size and forecast, by End Use Industry
- 6.5. LAMEA
- 6.5.1. Key trends and opportunities
- 6.5.2. Market size and forecast, by Product
- 6.5.2.1. LAMEA Acids Organic Chemicals Market by Type
- 6.5.3. Market size and forecast, by End Use Industry
- 6.5.4. Market size and forecast, by country
- 6.5.4.1. Brazil
- 6.5.4.1.1. Key market trends, growth factors and opportunities
- 6.5.4.1.2. Market size and forecast, by Product
- 6.5.4.1.2.1. Brazil Acids Organic Chemicals Market by Type
- 6.5.4.1.3. Market size and forecast, by End Use Industry
- 6.5.4.2. Saudi Arabia
- 6.5.4.2.1. Key market trends, growth factors and opportunities
- 6.5.4.2.2. Market size and forecast, by Product
- 6.5.4.2.2.1. Saudi Arabia Acids Organic Chemicals Market by Type
- 6.5.4.2.3. Market size and forecast, by End Use Industry
- 6.5.4.3. South Africa
- 6.5.4.3.1. Key market trends, growth factors and opportunities
- 6.5.4.3.2. Market size and forecast, by Product
- 6.5.4.3.2.1. South Africa Acids Organic Chemicals Market by Type
- 6.5.4.3.3. Market size and forecast, by End Use Industry
- 6.5.4.4. Rest of LAMEA
- 6.5.4.4.1. Key market trends, growth factors and opportunities
- 6.5.4.4.2. Market size and forecast, by Product
- 6.5.4.4.2.1. Rest of LAMEA Acids Organic Chemicals Market by Type
- 6.5.4.4.3. Market size and forecast, by End Use Industry
CHAPTER 7: COMPETITIVE LANDSCAPE
- 7.1. Introduction
- 7.2. Top winning strategies
- 7.3. Product Mapping of Top 10 Player
- 7.4. Competitive Dashboard
- 7.5. Competitive Heatmap
- 7.6. Top player positioning, 2022
CHAPTER 8: COMPANY PROFILES
- 8.1. TCI America
- 8.1.1. Company overview
- 8.1.2. Key Executives
- 8.1.3. Company snapshot
- 8.1.4. Operating business segments
- 8.1.5. Product portfolio
- 8.2. BASF SE
- 8.2.1. Company overview
- 8.2.2. Key Executives
- 8.2.3. Company snapshot
- 8.2.4. Operating business segments
- 8.2.5. Product portfolio
- 8.2.6. Business performance
- 8.3. Dow
- 8.3.1. Company overview
- 8.3.2. Key Executives
- 8.3.3. Company snapshot
- 8.3.4. Operating business segments
- 8.3.5. Product portfolio
- 8.3.6. Business performance
- 8.4. akzonobel
- 8.4.1. Company overview
- 8.4.2. Key Executives
- 8.4.3. Company snapshot
- 8.4.4. Operating business segments
- 8.4.5. Product portfolio
- 8.4.6. Business performance
- 8.5. Cargill
- 8.5.1. Company overview
- 8.5.2. Key Executives
- 8.5.3. Company snapshot
- 8.5.4. Operating business segments
- 8.5.5. Product portfolio
- 8.6. vinati organics limited
- 8.6.1. Company overview
- 8.6.2. Key Executives
- 8.6.3. Company snapshot
- 8.6.4. Operating business segments
- 8.6.5. Product portfolio
- 8.6.6. Business performance
- 8.7. Hindustan Organic Chemicals Limited
- 8.7.1. Company overview
- 8.7.2. Key Executives
- 8.7.3. Company snapshot
- 8.7.4. Operating business segments
- 8.7.5. Product portfolio
- 8.7.6. Business performance
- 8.8. Royal Dutch Shell plc
- 8.8.1. Company overview
- 8.8.2. Key Executives
- 8.8.3. Company snapshot
- 8.8.4. Operating business segments
- 8.8.5. Product portfolio
- 8.8.6. Business performance
- 8.9. neogen chemicals limited
- 8.9.1. Company overview
- 8.9.2. Key Executives
- 8.9.3. Company snapshot
- 8.9.4. Operating business segments
- 8.9.5. Product portfolio
- 8.9.6. Business performance
- 8.10. CHEMPLAST SANMAR LIMITED
- 8.10.1. Company overview
- 8.10.2. Key Executives
- 8.10.3. Company snapshot
- 8.10.4. Operating business segments
- 8.10.5. Product portfolio
- 8.10.6. Business performance
LIST OF TABLES
- TABLE 01. GLOBAL ORGANIC CHEMICALS MARKET, BY PRODUCT, 2022-2032 ($MILLION)
- TABLE 02. GLOBAL ORGANIC CHEMICALS MARKET, BY PRODUCT, 2022-2032 (KILOTON)
- TABLE 03. ORGANIC CHEMICALS MARKET FOR ACIDS, BY REGION, 2022-2032 ($MILLION)
- TABLE 04. ORGANIC CHEMICALS MARKET FOR ACIDS, BY REGION, 2022-2032 (KILOTON)
- TABLE 05. GLOBAL ACIDS ORGANIC CHEMICALS MARKET, BY TYPE, 2022-2032 ($MILLION)
- TABLE 06. GLOBAL ACIDS ORGANIC CHEMICALS MARKET, BY TYPE, 2022-2032 (KILOTON)
- TABLE 07. ORGANIC CHEMICALS MARKET FOR ACETIC ACID, BY REGION, 2022-2032 ($MILLION)
- TABLE 08. ORGANIC CHEMICALS MARKET FOR ACETIC ACID, BY REGION, 2022-2032 (KILOTON)
- TABLE 09. ORGANIC CHEMICALS MARKET FOR LACTIC ACID, BY REGION, 2022-2032 ($MILLION)
- TABLE 10. ORGANIC CHEMICALS MARKET FOR LACTIC ACID, BY REGION, 2022-2032 (KILOTON)
- TABLE 11. ORGANIC CHEMICALS MARKET FOR CITRIC ACID, BY REGION, 2022-2032 ($MILLION)
- TABLE 12. ORGANIC CHEMICALS MARKET FOR CITRIC ACID, BY REGION, 2022-2032 (KILOTON)
- TABLE 13. ORGANIC CHEMICALS MARKET FOR OTHERS, BY REGION, 2022-2032 ($MILLION)
- TABLE 14. ORGANIC CHEMICALS MARKET FOR OTHERS, BY REGION, 2022-2032 (KILOTON)
- TABLE 15. ORGANIC CHEMICALS MARKET FOR ALCOHOLS AND ETHERS, BY REGION, 2022-2032 ($MILLION)
- TABLE 16. ORGANIC CHEMICALS MARKET FOR ALCOHOLS AND ETHERS, BY REGION, 2022-2032 (KILOTON)
- TABLE 17. ORGANIC CHEMICALS MARKET FOR AMINES AND AMIDES, BY REGION, 2022-2032 ($MILLION)
- TABLE 18. ORGANIC CHEMICALS MARKET FOR AMINES AND AMIDES, BY REGION, 2022-2032 (KILOTON)
- TABLE 19. ORGANIC CHEMICALS MARKET FOR ALDEHYDES AND KETONES, BY REGION, 2022-2032 ($MILLION)
- TABLE 20. ORGANIC CHEMICALS MARKET FOR ALDEHYDES AND KETONES, BY REGION, 2022-2032 (KILOTON)
- TABLE 21. ORGANIC CHEMICALS MARKET FOR OTHERS, BY REGION, 2022-2032 ($MILLION)
- TABLE 22. ORGANIC CHEMICALS MARKET FOR OTHERS, BY REGION, 2022-2032 (KILOTON)
- TABLE 23. GLOBAL ORGANIC CHEMICALS MARKET, BY END USE INDUSTRY, 2022-2032 ($MILLION)
- TABLE 24. GLOBAL ORGANIC CHEMICALS MARKET, BY END USE INDUSTRY, 2022-2032 (KILOTON)
- TABLE 25. ORGANIC CHEMICALS MARKET FOR PHARMACEUTICALS, BY REGION, 2022-2032 ($MILLION)
- TABLE 26. ORGANIC CHEMICALS MARKET FOR PHARMACEUTICALS, BY REGION, 2022-2032 (KILOTON)
- TABLE 27. ORGANIC CHEMICALS MARKET FOR AGROCHEMICALS, BY REGION, 2022-2032 ($MILLION)
- TABLE 28. ORGANIC CHEMICALS MARKET FOR AGROCHEMICALS, BY REGION, 2022-2032 (KILOTON)
- TABLE 29. ORGANIC CHEMICALS MARKET FOR PERSONAL CARE AND COSMETICS, BY REGION, 2022-2032 ($MILLION)
- TABLE 30. ORGANIC CHEMICALS MARKET FOR PERSONAL CARE AND COSMETICS, BY REGION, 2022-2032 (KILOTON)
- TABLE 31. ORGANIC CHEMICALS MARKET FOR FOOD AND BEVERAGES, BY REGION, 2022-2032 ($MILLION)
- TABLE 32. ORGANIC CHEMICALS MARKET FOR FOOD AND BEVERAGES, BY REGION, 2022-2032 (KILOTON)
- TABLE 33. ORGANIC CHEMICALS MARKET FOR OTHERS, BY REGION, 2022-2032 ($MILLION)
- TABLE 34. ORGANIC CHEMICALS MARKET FOR OTHERS, BY REGION, 2022-2032 (KILOTON)
- TABLE 35. ORGANIC CHEMICALS MARKET, BY REGION, 2022-2032 ($MILLION)
- TABLE 36. ORGANIC CHEMICALS MARKET, BY REGION, 2022-2032 (KILOTON)
- TABLE 37. NORTH AMERICA ORGANIC CHEMICALS MARKET, BY PRODUCT, 2022-2032 ($MILLION)
- TABLE 38. NORTH AMERICA ORGANIC CHEMICALS MARKET, BY PRODUCT, 2022-2032 (KILOTON)
- TABLE 39. NORTH AMERICA ACIDS ORGANIC CHEMICALS MARKET, BY TYPE, 2022-2032 ($MILLION)
- TABLE 40. NORTH AMERICA ACIDS ORGANIC CHEMICALS MARKET, BY TYPE, 2022-2032 (KILOTON)
- TABLE 41. NORTH AMERICA ORGANIC CHEMICALS MARKET, BY END USE INDUSTRY, 2022-2032 ($MILLION)
- TABLE 42. NORTH AMERICA ORGANIC CHEMICALS MARKET, BY END USE INDUSTRY, 2022-2032 (KILOTON)
- TABLE 43. NORTH AMERICA ORGANIC CHEMICALS MARKET, BY COUNTRY, 2022-2032 ($MILLION)
- TABLE 44. NORTH AMERICA ORGANIC CHEMICALS MARKET, BY COUNTRY, 2022-2032 (KILOTON)
- TABLE 45. U.S. ORGANIC CHEMICALS MARKET, BY PRODUCT, 2022-2032 ($MILLION)
- TABLE 46. U.S. ORGANIC CHEMICALS MARKET, BY PRODUCT, 2022-2032 (KILOTON)
- TABLE 47. U.S. ACIDS ORGANIC CHEMICALS MARKET, BY TYPE, 2022-2032 ($MILLION)
- TABLE 48. U.S. ACIDS ORGANIC CHEMICALS MARKET, BY TYPE, 2022-2032 (KILOTON)
- TABLE 49. U.S. ORGANIC CHEMICALS MARKET, BY END USE INDUSTRY, 2022-2032 ($MILLION)
- TABLE 50. U.S. ORGANIC CHEMICALS MARKET, BY END USE INDUSTRY, 2022-2032 (KILOTON)
- TABLE 51. CANADA ORGANIC CHEMICALS MARKET, BY PRODUCT, 2022-2032 ($MILLION)
- TABLE 52. CANADA ORGANIC CHEMICALS MARKET, BY PRODUCT, 2022-2032 (KILOTON)
- TABLE 53. CANADA ACIDS ORGANIC CHEMICALS MARKET, BY TYPE, 2022-2032 ($MILLION)
- TABLE 54. CANADA ACIDS ORGANIC CHEMICALS MARKET, BY TYPE, 2022-2032 (KILOTON)
- TABLE 55. CANADA ORGANIC CHEMICALS MARKET, BY END USE INDUSTRY, 2022-2032 ($MILLION)
- TABLE 56. CANADA ORGANIC CHEMICALS MARKET, BY END USE INDUSTRY, 2022-2032 (KILOTON)
- TABLE 57. MEXICO ORGANIC CHEMICALS MARKET, BY PRODUCT, 2022-2032 ($MILLION)
- TABLE 58. MEXICO ORGANIC CHEMICALS MARKET, BY PRODUCT, 2022-2032 (KILOTON)
- TABLE 59. MEXICO ACIDS ORGANIC CHEMICALS MARKET, BY TYPE, 2022-2032 ($MILLION)
- TABLE 60. MEXICO ACIDS ORGANIC CHEMICALS MARKET, BY TYPE, 2022-2032 (KILOTON)
- TABLE 61. MEXICO ORGANIC CHEMICALS MARKET, BY END USE INDUSTRY, 2022-2032 ($MILLION)
- TABLE 62. MEXICO ORGANIC CHEMICALS MARKET, BY END USE INDUSTRY, 2022-2032 (KILOTON)
- TABLE 63. EUROPE ORGANIC CHEMICALS MARKET, BY PRODUCT, 2022-2032 ($MILLION)
- TABLE 64. EUROPE ORGANIC CHEMICALS MARKET, BY PRODUCT, 2022-2032 (KILOTON)
- TABLE 65. EUROPE ACIDS ORGANIC CHEMICALS MARKET, BY TYPE, 2022-2032 ($MILLION)
- TABLE 66. EUROPE ACIDS ORGANIC CHEMICALS MARKET, BY TYPE, 2022-2032 (KILOTON)
- TABLE 67. EUROPE ORGANIC CHEMICALS MARKET, BY END USE INDUSTRY, 2022-2032 ($MILLION)
- TABLE 68. EUROPE ORGANIC CHEMICALS MARKET, BY END USE INDUSTRY, 2022-2032 (KILOTON)
- TABLE 69. EUROPE ORGANIC CHEMICALS MARKET, BY COUNTRY, 2022-2032 ($MILLION)
- TABLE 70. EUROPE ORGANIC CHEMICALS MARKET, BY COUNTRY, 2022-2032 (KILOTON)
- TABLE 71. GERMANY ORGANIC CHEMICALS MARKET, BY PRODUCT, 2022-2032 ($MILLION)
- TABLE 72. GERMANY ORGANIC CHEMICALS MARKET, BY PRODUCT, 2022-2032 (KILOTON)
- TABLE 73. GERMANY ACIDS ORGANIC CHEMICALS MARKET, BY TYPE, 2022-2032 ($MILLION)
- TABLE 74. GERMANY ACIDS ORGANIC CHEMICALS MARKET, BY TYPE, 2022-2032 (KILOTON)
- TABLE 75. GERMANY ORGANIC CHEMICALS MARKET, BY END USE INDUSTRY, 2022-2032 ($MILLION)
- TABLE 76. GERMANY ORGANIC CHEMICALS MARKET, BY END USE INDUSTRY, 2022-2032 (KILOTON)
- TABLE 77. UK ORGANIC CHEMICALS MARKET, BY PRODUCT, 2022-2032 ($MILLION)
- TABLE 78. UK ORGANIC CHEMICALS MARKET, BY PRODUCT, 2022-2032 (KILOTON)
- TABLE 79. UK ACIDS ORGANIC CHEMICALS MARKET, BY TYPE, 2022-2032 ($MILLION)
- TABLE 80. UK ACIDS ORGANIC CHEMICALS MARKET, BY TYPE, 2022-2032 (KILOTON)
- TABLE 81. UK ORGANIC CHEMICALS MARKET, BY END USE INDUSTRY, 2022-2032 ($MILLION)
- TABLE 82. UK ORGANIC CHEMICALS MARKET, BY END USE INDUSTRY, 2022-2032 (KILOTON)
- TABLE 83. FRANCE ORGANIC CHEMICALS MARKET, BY PRODUCT, 2022-2032 ($MILLION)
- TABLE 84. FRANCE ORGANIC CHEMICALS MARKET, BY PRODUCT, 2022-2032 (KILOTON)
- TABLE 85. FRANCE ACIDS ORGANIC CHEMICALS MARKET, BY TYPE, 2022-2032 ($MILLION)
- TABLE 86. FRANCE ACIDS ORGANIC CHEMICALS MARKET, BY TYPE, 2022-2032 (KILOTON)
- TABLE 87. FRANCE ORGANIC CHEMICALS MARKET, BY END USE INDUSTRY, 2022-2032 ($MILLION)
- TABLE 88. FRANCE ORGANIC CHEMICALS MARKET, BY END USE INDUSTRY, 2022-2032 (KILOTON)
- TABLE 89. SPAIN ORGANIC CHEMICALS MARKET, BY PRODUCT, 2022-2032 ($MILLION)
- TABLE 90. SPAIN ORGANIC CHEMICALS MARKET, BY PRODUCT, 2022-2032 (KILOTON)
- TABLE 91. SPAIN ACIDS ORGANIC CHEMICALS MARKET, BY TYPE, 2022-2032 ($MILLION)
- TABLE 92. SPAIN ACIDS ORGANIC CHEMICALS MARKET, BY TYPE, 2022-2032 (KILOTON)
- TABLE 93. SPAIN ORGANIC CHEMICALS MARKET, BY END USE INDUSTRY, 2022-2032 ($MILLION)
- TABLE 94. SPAIN ORGANIC CHEMICALS MARKET, BY END USE INDUSTRY, 2022-2032 (KILOTON)
- TABLE 95. ITALY ORGANIC CHEMICALS MARKET, BY PRODUCT, 2022-2032 ($MILLION)
- TABLE 96. ITALY ORGANIC CHEMICALS MARKET, BY PRODUCT, 2022-2032 (KILOTON)
- TABLE 97. ITALY ACIDS ORGANIC CHEMICALS MARKET, BY TYPE, 2022-2032 ($MILLION)
- TABLE 98. ITALY ACIDS ORGANIC CHEMICALS MARKET, BY TYPE, 2022-2032 (KILOTON)
- TABLE 99. ITALY ORGANIC CHEMICALS MARKET, BY END USE INDUSTRY, 2022-2032 ($MILLION)
- TABLE 100. ITALY ORGANIC CHEMICALS MARKET, BY END USE INDUSTRY, 2022-2032 (KILOTON)
- TABLE 101. REST OF EUROPE ORGANIC CHEMICALS MARKET, BY PRODUCT, 2022-2032 ($MILLION)
- TABLE 102. REST OF EUROPE ORGANIC CHEMICALS MARKET, BY PRODUCT, 2022-2032 (KILOTON)
- TABLE 103. REST OF EUROPE ACIDS ORGANIC CHEMICALS MARKET, BY TYPE, 2022-2032 ($MILLION)
- TABLE 104. REST OF EUROPE ACIDS ORGANIC CHEMICALS MARKET, BY TYPE, 2022-2032 (KILOTON)
- TABLE 105. REST OF EUROPE ORGANIC CHEMICALS MARKET, BY END USE INDUSTRY, 2022-2032 ($MILLION)
- TABLE 106. REST OF EUROPE ORGANIC CHEMICALS MARKET, BY END USE INDUSTRY, 2022-2032 (KILOTON)
- TABLE 107. ASIA-PACIFIC ORGANIC CHEMICALS MARKET, BY PRODUCT, 2022-2032 ($MILLION)
- TABLE 108. ASIA-PACIFIC ORGANIC CHEMICALS MARKET, BY PRODUCT, 2022-2032 (KILOTON)
- TABLE 109. ASIA-PACIFIC ACIDS ORGANIC CHEMICALS MARKET, BY TYPE, 2022-2032 ($MILLION)
- TABLE 110. ASIA-PACIFIC ACIDS ORGANIC CHEMICALS MARKET, BY TYPE, 2022-2032 (KILOTON)
- TABLE 111. ASIA-PACIFIC ORGANIC CHEMICALS MARKET, BY END USE INDUSTRY, 2022-2032 ($MILLION)
- TABLE 112. ASIA-PACIFIC ORGANIC CHEMICALS MARKET, BY END USE INDUSTRY, 2022-2032 (KILOTON)
- TABLE 113. ASIA-PACIFIC ORGANIC CHEMICALS MARKET, BY COUNTRY, 2022-2032 ($MILLION)
- TABLE 114. ASIA-PACIFIC ORGANIC CHEMICALS MARKET, BY COUNTRY, 2022-2032 (KILOTON)
- TABLE 115. CHINA ORGANIC CHEMICALS MARKET, BY PRODUCT, 2022-2032 ($MILLION)
- TABLE 116. CHINA ORGANIC CHEMICALS MARKET, BY PRODUCT, 2022-2032 (KILOTON)
- TABLE 117. CHINA ACIDS ORGANIC CHEMICALS MARKET, BY TYPE, 2022-2032 ($MILLION)
- TABLE 118. CHINA ACIDS ORGANIC CHEMICALS MARKET, BY TYPE, 2022-2032 (KILOTON)
- TABLE 119. CHINA ORGANIC CHEMICALS MARKET, BY END USE INDUSTRY, 2022-2032 ($MILLION)
- TABLE 120. CHINA ORGANIC CHEMICALS MARKET, BY END USE INDUSTRY, 2022-2032 (KILOTON)
- TABLE 121. INDIA ORGANIC CHEMICALS MARKET, BY PRODUCT, 2022-2032 ($MILLION)
- TABLE 122. INDIA ORGANIC CHEMICALS MARKET, BY PRODUCT, 2022-2032 (KILOTON)
- TABLE 123. INDIA ACIDS ORGANIC CHEMICALS MARKET, BY TYPE, 2022-2032 ($MILLION)
- TABLE 124. INDIA ACIDS ORGANIC CHEMICALS MARKET, BY TYPE, 2022-2032 (KILOTON)
- TABLE 125. INDIA ORGANIC CHEMICALS MARKET, BY END USE INDUSTRY, 2022-2032 ($MILLION)
- TABLE 126. INDIA ORGANIC CHEMICALS MARKET, BY END USE INDUSTRY, 2022-2032 (KILOTON)
- TABLE 127. JAPAN ORGANIC CHEMICALS MARKET, BY PRODUCT, 2022-2032 ($MILLION)
- TABLE 128. JAPAN ORGANIC CHEMICALS MARKET, BY PRODUCT, 2022-2032 (KILOTON)
- TABLE 129. JAPAN ACIDS ORGANIC CHEMICALS MARKET, BY TYPE, 2022-2032 ($MILLION)
- TABLE 130. JAPAN ACIDS ORGANIC CHEMICALS MARKET, BY TYPE, 2022-2032 (KILOTON)
- TABLE 131. JAPAN ORGANIC CHEMICALS MARKET, BY END USE INDUSTRY, 2022-2032 ($MILLION)
- TABLE 132. JAPAN ORGANIC CHEMICALS MARKET, BY END USE INDUSTRY, 2022-2032 (KILOTON)
- TABLE 133. SOUTH KOREA ORGANIC CHEMICALS MARKET, BY PRODUCT, 2022-2032 ($MILLION)
- TABLE 134. SOUTH KOREA ORGANIC CHEMICALS MARKET, BY PRODUCT, 2022-2032 (KILOTON)
- TABLE 135. SOUTH KOREA ACIDS ORGANIC CHEMICALS MARKET, BY TYPE, 2022-2032 ($MILLION)
- TABLE 136. SOUTH KOREA ACIDS ORGANIC CHEMICALS MARKET, BY TYPE, 2022-2032 (KILOTON)
- TABLE 137. SOUTH KOREA ORGANIC CHEMICALS MARKET, BY END USE INDUSTRY, 2022-2032 ($MILLION)
- TABLE 138. SOUTH KOREA ORGANIC CHEMICALS MARKET, BY END USE INDUSTRY, 2022-2032 (KILOTON)
- TABLE 139. AUSTRALIA ORGANIC CHEMICALS MARKET, BY PRODUCT, 2022-2032 ($MILLION)
- TABLE 140. AUSTRALIA ORGANIC CHEMICALS MARKET, BY PRODUCT, 2022-2032 (KILOTON)
- TABLE 141. AUSTRALIA ACIDS ORGANIC CHEMICALS MARKET, BY TYPE, 2022-2032 ($MILLION)
- TABLE 142. AUSTRALIA ACIDS ORGANIC CHEMICALS MARKET, BY TYPE, 2022-2032 (KILOTON)
- TABLE 143. AUSTRALIA ORGANIC CHEMICALS MARKET, BY END USE INDUSTRY, 2022-2032 ($MILLION)
- TABLE 144. AUSTRALIA ORGANIC CHEMICALS MARKET, BY END USE INDUSTRY, 2022-2032 (KILOTON)
- TABLE 145. REST OF ASIA-PACIFIC ORGANIC CHEMICALS MARKET, BY PRODUCT, 2022-2032 ($MILLION)
- TABLE 146. REST OF ASIA-PACIFIC ORGANIC CHEMICALS MARKET, BY PRODUCT, 2022-2032 (KILOTON)
- TABLE 147. REST OF ASIA-PACIFIC ACIDS ORGANIC CHEMICALS MARKET, BY TYPE, 2022-2032 ($MILLION)
- TABLE 148. REST OF ASIA-PACIFIC ACIDS ORGANIC CHEMICALS MARKET, BY TYPE, 2022-2032 (KILOTON)
- TABLE 149. REST OF ASIA-PACIFIC ORGANIC CHEMICALS MARKET, BY END USE INDUSTRY, 2022-2032 ($MILLION)
- TABLE 150. REST OF ASIA-PACIFIC ORGANIC CHEMICALS MARKET, BY END USE INDUSTRY, 2022-2032 (KILOTON)
- TABLE 151. LAMEA ORGANIC CHEMICALS MARKET, BY PRODUCT, 2022-2032 ($MILLION)
- TABLE 152. LAMEA ORGANIC CHEMICALS MARKET, BY PRODUCT, 2022-2032 (KILOTON)
- TABLE 153. LAMEA ACIDS ORGANIC CHEMICALS MARKET, BY TYPE, 2022-2032 ($MILLION)
- TABLE 154. LAMEA ACIDS ORGANIC CHEMICALS MARKET, BY TYPE, 2022-2032 (KILOTON)
- TABLE 155. LAMEA ORGANIC CHEMICALS MARKET, BY END USE INDUSTRY, 2022-2032 ($MILLION)
- TABLE 156. LAMEA ORGANIC CHEMICALS MARKET, BY END USE INDUSTRY, 2022-2032 (KILOTON)
- TABLE 157. LAMEA ORGANIC CHEMICALS MARKET, BY COUNTRY, 2022-2032 ($MILLION)
- TABLE 158. LAMEA ORGANIC CHEMICALS MARKET, BY COUNTRY, 2022-2032 (KILOTON)
- TABLE 159. BRAZIL ORGANIC CHEMICALS MARKET, BY PRODUCT, 2022-2032 ($MILLION)
- TABLE 160. BRAZIL ORGANIC CHEMICALS MARKET, BY PRODUCT, 2022-2032 (KILOTON)
- TABLE 161. BRAZIL ACIDS ORGANIC CHEMICALS MARKET, BY TYPE, 2022-2032 ($MILLION)
- TABLE 162. BRAZIL ACIDS ORGANIC CHEMICALS MARKET, BY TYPE, 2022-2032 (KILOTON)
- TABLE 163. BRAZIL ORGANIC CHEMICALS MARKET, BY END USE INDUSTRY, 2022-2032 ($MILLION)
- TABLE 164. BRAZIL ORGANIC CHEMICALS MARKET, BY END USE INDUSTRY, 2022-2032 (KILOTON)
- TABLE 165. SAUDI ARABIA ORGANIC CHEMICALS MARKET, BY PRODUCT, 2022-2032 ($MILLION)
- TABLE 166. SAUDI ARABIA ORGANIC CHEMICALS MARKET, BY PRODUCT, 2022-2032 (KILOTON)
- TABLE 167. SAUDI ARABIA ACIDS ORGANIC CHEMICALS MARKET, BY TYPE, 2022-2032 ($MILLION)
- TABLE 168. SAUDI ARABIA ACIDS ORGANIC CHEMICALS MARKET, BY TYPE, 2022-2032 (KILOTON)
- TABLE 169. SAUDI ARABIA ORGANIC CHEMICALS MARKET, BY END USE INDUSTRY, 2022-2032 ($MILLION)
- TABLE 170. SAUDI ARABIA ORGANIC CHEMICALS MARKET, BY END USE INDUSTRY, 2022-2032 (KILOTON)
- TABLE 171. SOUTH AFRICA ORGANIC CHEMICALS MARKET, BY PRODUCT, 2022-2032 ($MILLION)
- TABLE 172. SOUTH AFRICA ORGANIC CHEMICALS MARKET, BY PRODUCT, 2022-2032 (KILOTON)
- TABLE 173. SOUTH AFRICA ACIDS ORGANIC CHEMICALS MARKET, BY TYPE, 2022-2032 ($MILLION)
- TABLE 174. SOUTH AFRICA ACIDS ORGANIC CHEMICALS MARKET, BY TYPE, 2022-2032 (KILOTON)
- TABLE 175. SOUTH AFRICA ORGANIC CHEMICALS MARKET, BY END USE INDUSTRY, 2022-2032 ($MILLION)
- TABLE 176. SOUTH AFRICA ORGANIC CHEMICALS MARKET, BY END USE INDUSTRY, 2022-2032 (KILOTON)
- TABLE 177. REST OF LAMEA ORGANIC CHEMICALS MARKET, BY PRODUCT, 2022-2032 ($MILLION)
- TABLE 178. REST OF LAMEA ORGANIC CHEMICALS MARKET, BY PRODUCT, 2022-2032 (KILOTON)
- TABLE 179. REST OF LAMEA ACIDS ORGANIC CHEMICALS MARKET, BY TYPE, 2022-2032 ($MILLION)
- TABLE 180. REST OF LAMEA ACIDS ORGANIC CHEMICALS MARKET, BY TYPE, 2022-2032 (KILOTON)
- TABLE 181. REST OF LAMEA ORGANIC CHEMICALS MARKET, BY END USE INDUSTRY, 2022-2032 ($MILLION)
- TABLE 182. REST OF LAMEA ORGANIC CHEMICALS MARKET, BY END USE INDUSTRY, 2022-2032 (KILOTON)
- TABLE 183. TCI AMERICA: KEY EXECUTIVES
- TABLE 184. TCI AMERICA: COMPANY SNAPSHOT
- TABLE 185. TCI AMERICA: PRODUCT SEGMENTS
- TABLE 186. TCI AMERICA: PRODUCT PORTFOLIO
- TABLE 187. BASF SE: KEY EXECUTIVES
- TABLE 188. BASF SE: COMPANY SNAPSHOT
- TABLE 189. BASF SE: PRODUCT SEGMENTS
- TABLE 190. BASF SE: PRODUCT PORTFOLIO
- TABLE 191. DOW: KEY EXECUTIVES
- TABLE 192. DOW: COMPANY SNAPSHOT
- TABLE 193. DOW: PRODUCT SEGMENTS
- TABLE 194. DOW: PRODUCT PORTFOLIO
- TABLE 195. AKZONOBEL: KEY EXECUTIVES
- TABLE 196. AKZONOBEL: COMPANY SNAPSHOT
- TABLE 197. AKZONOBEL: PRODUCT SEGMENTS
- TABLE 198. AKZONOBEL: PRODUCT PORTFOLIO
- TABLE 199. CARGILL: KEY EXECUTIVES
- TABLE 200. CARGILL: COMPANY SNAPSHOT
- TABLE 201. CARGILL: PRODUCT SEGMENTS
- TABLE 202. CARGILL: PRODUCT PORTFOLIO
- TABLE 203. VINATI ORGANICS LIMITED: KEY EXECUTIVES
- TABLE 204. VINATI ORGANICS LIMITED: COMPANY SNAPSHOT
- TABLE 205. VINATI ORGANICS LIMITED: PRODUCT SEGMENTS
- TABLE 206. VINATI ORGANICS LIMITED: PRODUCT PORTFOLIO
- TABLE 207. HINDUSTAN ORGANIC CHEMICALS LIMITED: KEY EXECUTIVES
- TABLE 208. HINDUSTAN ORGANIC CHEMICALS LIMITED: COMPANY SNAPSHOT
- TABLE 209. HINDUSTAN ORGANIC CHEMICALS LIMITED: PRODUCT SEGMENTS
- TABLE 210. HINDUSTAN ORGANIC CHEMICALS LIMITED: PRODUCT PORTFOLIO
- TABLE 211. ROYAL DUTCH SHELL PLC: KEY EXECUTIVES
- TABLE 212. ROYAL DUTCH SHELL PLC: COMPANY SNAPSHOT
- TABLE 213. ROYAL DUTCH SHELL PLC: PRODUCT SEGMENTS
- TABLE 214. ROYAL DUTCH SHELL PLC: PRODUCT PORTFOLIO
- TABLE 215. NEOGEN CHEMICALS LIMITED: KEY EXECUTIVES
- TABLE 216. NEOGEN CHEMICALS LIMITED: COMPANY SNAPSHOT
- TABLE 217. NEOGEN CHEMICALS LIMITED: PRODUCT SEGMENTS
- TABLE 218. NEOGEN CHEMICALS LIMITED: PRODUCT PORTFOLIO
- TABLE 219. CHEMPLAST SANMAR LIMITED: KEY EXECUTIVES
- TABLE 220. CHEMPLAST SANMAR LIMITED: COMPANY SNAPSHOT
- TABLE 221. CHEMPLAST SANMAR LIMITED: PRODUCT SEGMENTS
- TABLE 222. CHEMPLAST SANMAR LIMITED: PRODUCT PORTFOLIO
LIST OF FIGURES
- FIGURE 01. ORGANIC CHEMICALS MARKET, 2022-2032
- FIGURE 02. SEGMENTATION OF ORGANIC CHEMICALS MARKET, 2022-2032
- FIGURE 03. TOP INVESTMENT POCKETS IN ORGANIC CHEMICALS MARKET (2023-2032)
- FIGURE 04. LOW BARGAINING POWER OF SUPPLIERS
- FIGURE 05. LOW BARGAINING POWER OF BUYERS
- FIGURE 06. LOW THREAT OF SUBSTITUTES
- FIGURE 07. LOW THREAT OF NEW ENTRANTS
- FIGURE 08. LOW INTENSITY OF RIVALRY
- FIGURE 09. DRIVERS, RESTRAINTS AND OPPORTUNITIES: GLOBALORGANIC CHEMICALS MARKET
- FIGURE 10. IMPACT OF KEY REGULATION: ORGANIC CHEMICALS MARKET
- FIGURE 11. PATENT ANALYSIS BY COMPANY
- FIGURE 12. PATENT ANALYSIS BY COUNTRY
- FIGURE 13. PRICING ANALYSIS: ORGANIC CHEMICALS MARKET 2022 AND 2032
- FIGURE 14. REGULATORY GUIDELINES: ORGANIC CHEMICALS MARKET
- FIGURE 15. VALUE CHAIN ANALYSIS: ORGANIC CHEMICALS MARKET
- FIGURE 16. ORGANIC CHEMICALS MARKET, BY PRODUCT, 2022(%)
- FIGURE 17. COMPARATIVE SHARE ANALYSIS OF ORGANIC CHEMICALS MARKET FOR ACIDS, BY COUNTRY 2022 AND 2032(%)
- FIGURE 18. COMPARATIVE SHARE ANALYSIS OF ORGANIC CHEMICALS MARKET FOR ALCOHOLS AND ETHERS, BY COUNTRY 2022 AND 2032(%)
- FIGURE 19. COMPARATIVE SHARE ANALYSIS OF ORGANIC CHEMICALS MARKET FOR AMINES AND AMIDES, BY COUNTRY 2022 AND 2032(%)
- FIGURE 20. COMPARATIVE SHARE ANALYSIS OF ORGANIC CHEMICALS MARKET FOR ALDEHYDES AND KETONES, BY COUNTRY 2022 AND 2032(%)
- FIGURE 21. COMPARATIVE SHARE ANALYSIS OF ORGANIC CHEMICALS MARKET FOR OTHERS, BY COUNTRY 2022 AND 2032(%)
- FIGURE 22. ORGANIC CHEMICALS MARKET, BY END USE INDUSTRY, 2022(%)
- FIGURE 23. COMPARATIVE SHARE ANALYSIS OF ORGANIC CHEMICALS MARKET FOR PHARMACEUTICALS, BY COUNTRY 2022 AND 2032(%)
- FIGURE 24. COMPARATIVE SHARE ANALYSIS OF ORGANIC CHEMICALS MARKET FOR AGROCHEMICALS, BY COUNTRY 2022 AND 2032(%)
- FIGURE 25. COMPARATIVE SHARE ANALYSIS OF ORGANIC CHEMICALS MARKET FOR PERSONAL CARE AND COSMETICS, BY COUNTRY 2022 AND 2032(%)
- FIGURE 26. COMPARATIVE SHARE ANALYSIS OF ORGANIC CHEMICALS MARKET FOR FOOD AND BEVERAGES, BY COUNTRY 2022 AND 2032(%)
- FIGURE 27. COMPARATIVE SHARE ANALYSIS OF ORGANIC CHEMICALS MARKET FOR OTHERS, BY COUNTRY 2022 AND 2032(%)
- FIGURE 28. ORGANIC CHEMICALS MARKET BY REGION, 2022
- FIGURE 29. U.S. ORGANIC CHEMICALS MARKET, 2022-2032 ($MILLION)
- FIGURE 30. CANADA ORGANIC CHEMICALS MARKET, 2022-2032 ($MILLION)
- FIGURE 31. MEXICO ORGANIC CHEMICALS MARKET, 2022-2032 ($MILLION)
- FIGURE 32. GERMANY ORGANIC CHEMICALS MARKET, 2022-2032 ($MILLION)
- FIGURE 33. UK ORGANIC CHEMICALS MARKET, 2022-2032 ($MILLION)
- FIGURE 34. FRANCE ORGANIC CHEMICALS MARKET, 2022-2032 ($MILLION)
- FIGURE 35. SPAIN ORGANIC CHEMICALS MARKET, 2022-2032 ($MILLION)
- FIGURE 36. ITALY ORGANIC CHEMICALS MARKET, 2022-2032 ($MILLION)
- FIGURE 37. REST OF EUROPE ORGANIC CHEMICALS MARKET, 2022-2032 ($MILLION)
- FIGURE 38. CHINA ORGANIC CHEMICALS MARKET, 2022-2032 ($MILLION)
- FIGURE 39. INDIA ORGANIC CHEMICALS MARKET, 2022-2032 ($MILLION)
- FIGURE 40. JAPAN ORGANIC CHEMICALS MARKET, 2022-2032 ($MILLION)
- FIGURE 41. SOUTH KOREA ORGANIC CHEMICALS MARKET, 2022-2032 ($MILLION)
- FIGURE 42. AUSTRALIA ORGANIC CHEMICALS MARKET, 2022-2032 ($MILLION)
- FIGURE 43. REST OF ASIA-PACIFIC ORGANIC CHEMICALS MARKET, 2022-2032 ($MILLION)
- FIGURE 44. BRAZIL ORGANIC CHEMICALS MARKET, 2022-2032 ($MILLION)
- FIGURE 45. SAUDI ARABIA ORGANIC CHEMICALS MARKET, 2022-2032 ($MILLION)
- FIGURE 46. SOUTH AFRICA ORGANIC CHEMICALS MARKET, 2022-2032 ($MILLION)
- FIGURE 47. REST OF LAMEA ORGANIC CHEMICALS MARKET, 2022-2032 ($MILLION)
- FIGURE 48. TOP WINNING STRATEGIES, BY YEAR
- FIGURE 49. TOP WINNING STRATEGIES, BY DEVELOPMENT
- FIGURE 50. TOP WINNING STRATEGIES, BY COMPANY
- FIGURE 51. PRODUCT MAPPING OF TOP 10 PLAYERS
- FIGURE 52. COMPETITIVE DASHBOARD
- FIGURE 53. COMPETITIVE HEATMAP: ORGANIC CHEMICALS MARKET
- FIGURE 54. TOP PLAYER POSITIONING, 2022
- FIGURE 55. BASF SE: NET SALES, 2020-2022 ($MILLION)
- FIGURE 56. BASF SE: REVENUE SHARE BY SEGMENT, 2022 (%)
- FIGURE 57. BASF SE: REVENUE SHARE BY REGION, 2022 (%)
- FIGURE 58. DOW: NET SALES, 2020-2022 ($MILLION)
- FIGURE 59. DOW: RESEARCH & DEVELOPMENT EXPENDITURE, 2020-2022 ($MILLION)
- FIGURE 60. DOW: REVENUE SHARE BY SEGMENT, 2022 (%)
- FIGURE 61. DOW: REVENUE SHARE BY REGION, 2022 (%)
- FIGURE 62. AKZONOBEL: NET REVENUE, 2020-2022 ($MILLION)
- FIGURE 63. VINATI ORGANICS LIMITED: NET REVENUE, 2020-2022 ($MILLION)
- FIGURE 64. HINDUSTAN ORGANIC CHEMICALS LIMITED: NET REVENUE, 2020-2022 ($MILLION)
- FIGURE 65. ROYAL DUTCH SHELL PLC: NET REVENUE, 2019-2021 ($MILLION)
- FIGURE 66. ROYAL DUTCH SHELL PLC: REVENUE SHARE BY SEGMENT, 2021 (%)
- FIGURE 67. ROYAL DUTCH SHELL PLC: REVENUE SHARE BY REGION, 2021 (%)
- FIGURE 68. NEOGEN CHEMICALS LIMITED: NET REVENUE, 2020-2022 ($MILLION)
- FIGURE 69. NEOGEN CHEMICALS LIMITED: REVENUE SHARE BY REGION, 2022 (%)
- FIGURE 70. CHEMPLAST SANMAR LIMITED: NET REVENUE, 2020-2022 ($MILLION)
- FIGURE 71. CHEMPLAST SANMAR LIMITED: REVENUE SHARE BY SEGMENT, 2022 (%)

