


 |
市場調查報告書
商品編碼
1077362
細胞浸潤、細胞遷移化驗市場:各化驗類型,各應用領域,使用的各檢測方法Cell Invasion and Migration Assay Market by Type of Assay (Cell Invasion Assay and Cell Migration Assay), Application Areas (Drug Discovery, Screening and Tumor Study), Detection Method Used (Colorimetry and Fluorometry) |
||||||
亮點範例
本報告提供全球細胞浸潤、細胞遷移化驗市場相關調查,市場概要,以及2022年~2035年的預測,各化驗類型,各應用領域,使用的各檢測方法趨勢,及加入此市場的主要企業簡介等資訊。
目錄
第1章 序文
第2章 摘要整理
第3章 簡介
- 章節概要
- 細胞浸潤、細胞遷移化驗概要
- 細胞浸潤、遷移化驗的分類
- 細胞浸潤、遷移化驗的套件零組件所扮演的角色
- 細胞浸潤、遷移化驗的應用
- 今後展望
第4章 市場形勢
- 章節概要
- 細胞浸潤、細胞遷移化驗:供應商的清單
- 細胞浸潤、細胞遷移化驗:市場形勢
第5章 產品競爭力分析
- 章節概要
- 主要的前提條件與參數
- 調查手法
- 產品的競爭力分析
- 產品的競爭力分析
第6章 企業簡介
- 章節概要
- Abcam
- BioVision
- Enzo Life Sciences
- MilliporeSigma
- R&D Systems
- Sigma-Aldrich
第7章 出版物的分析
- 章節概要
- 範圍與調查手法
- 細胞浸潤、細胞遷移化驗:出版物的清單
第8章 專利分析
第9章 津貼分析
第10章 鮑曼戰略鐘價格策略
第11章 市場預測機會分析
- 章節概要
- 預測調查手法主要的假設
- 全球細胞浸潤、細胞遷移化驗市場,2022年~2035年
- 細胞浸潤、細胞遷移化驗市場:各化驗類型分析
- 細胞浸潤、細胞遷移化驗市場:各應用領域分析
- 細胞浸潤、細胞遷移化驗市場:使用的各檢測方法分析
- 細胞浸潤、細胞遷移化驗市場:各地區分析
第12章 結論
第13章 附錄I:總計資料
第14章 附錄II:企業和組織的清單
Title:
Cell Invasion and Migration Assay
Market by Type of Assay (Cell Invasion Assay and Cell Migration Assay), Application Areas (Drug Discovery, Screening and Tumor Study), Detection Method Used (Colorimetry and Fluorometry) and Key Geographical Regions (North America, Europe, Asia-Pacific, Latin America, MENA and Rest of the World): Industry Trends and Global Forecasts, 2022 - 2035.
Example Highlights:
Overview
According to the World Health Organization (WHO), cancer is the second leading causes of mortality worldwide. In this context, it is important to highlight that around 10 million cancer deaths are reported globally each year. Further, it is estimated that, by 2030, around 21.4 million new patients are likely to be diagnosed with cancer annually. In fact, the global cancer burden is likely to increase by 70%, over the next two decades. With an aim to counter the rising number of cancer cases across the globe, several pharmaceutical players have developed cell invasion and migration assays to expediate the diagnosis process. It is worth highlighting that early diagnosis of cancer helps the patients to respond to therapy in an effective manner, thereby, increasing the chances of survival. Considering the various advantages offered by these cell-based assays, researchers across the globe have undertaken several initiatives to use these platforms for the diagnosis of a myriad of disease indications. The advancements in various technologies have propelled life science companies to use these assays in the drug discovery process, to enable the identification of potential lead candidates.
Given their extensive utilization in various drug discovery, tumor study and screening applications, there has been a significant rise in the revenue generation potential associated with cell invasion and migration assay kits. The current market landscape is consolidated and primarily dominated by the presence of large players. It is also worth mentioning that over 900 patents related to the implementation of invasion and migration assays have been filed / granted in the past few years, demonstrating the continued innovation in this domain. Taking into consideration both historical and recent developments, it is evident that the cell invasion and migration assay kits market is anticipated to grow at a significant pace in the coming years.
Scope of the Report
The "Cell Invasion and Migration Assay Market by Type of Assay (Cell Invasion Assay and Cell Migration Assay), Application Areas (Drug Discovery, Screening and Tumor Study), Detection Method Used (Colorimetry and Fluorometry) and Key Geographical Regions (North America, Europe, Asia-Pacific, Latin America, MENA and Rest of the World): Industry Trends and Global Forecasts, 2022 - 2035" report features an extensive study of the current market landscape and the likely future potential associated with the cell invasion and migration assay market, over the next decade. The study also includes a detailed analysis of key drivers and trends within this evolving market. Amongst other elements, the report features:
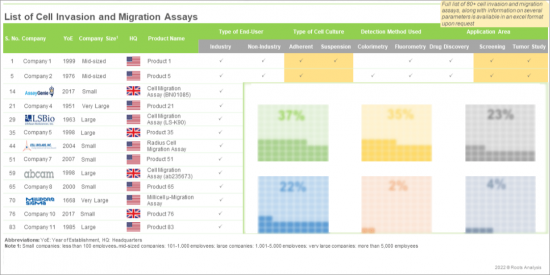
- A detailed overview of the current market landscape of companies engaged in offering cell invasion and migration assays based on several parameters, such as year of establishment, company size, location of headquarters, type of end-user (industry and non-industry).
- A detailed overview of the overall market landscape of cell invasion and migration assays, based on several relevant parameters, such as type of cell culture (adherent and suspension cell culture), type of assay (cell invasion and cell migration assay), number of wells (24-well, 32-well, 48-well, 96-well and 384-well), pore size of wells (3 µm, 5 µm , 8 µm , 9 µm and 12 µm), type of ECM coating (basement membrane extract, collagen I, collagen IV, fibronectin and laminin), storage temperature (ultra-low, frozen, refrigerated and room temperature), application area (drug discovery, screening and tumor study), detection method used (colorimetry and fluorometry) and number of assays performed.
- An insightful product competitiveness analysis of cell invasion and migration assays, based on their supplier strength (in terms of years of experience and company size) and product portfolio strength (which takes into account type of cell culture, number of wells, type of ECM coating, kit components, application area, detection method used and number of assays performed).
- Elaborate profiles of cell-based assay providers (large and mid-sized companies, established before 2000). Each profile features a brief overview of the company, along with information on its product portfolio, recent developments and an informed future outlook.
- A detailed review of around 675 peer-reviewed, scientific articles related to research on cell invasion and migration assays, based on several relevant parameters, such as year of publication, type of publication, popular keywords, top journals, top institutes and top authors (in terms of number of articles published).
- An in-depth analysis of patents related to cell invasion and migration assays filed / granted since 2017, based on several relevant parameters, such as publication year, geographical location / patent jurisdiction, legal status, CPC symbols, emerging focus areas, type of applicant and leading players (in terms of number of patents filed / granted). In addition, it features a patent valuation analysis which evaluates the qualitative and quantitative aspects of the patents.
- A detailed review of academic grants that have been awarded to various research institutes for projects focused on cell invasion and migration, during the period, 2017-2022, based on several parameters, such as year of grant award, amount awarded, support period, type of funding institute center, support period, grant application, purpose of grant award, grant activity code, NIH spending category, study section involved, popular NIH departments, recipient organization, regional distribution of recipient organization. Further, the chapter also highlights the popular recipient organizations, (in terms of number of grants and amount awarded) and prominent program officers.
- A Bowman's strategy clock framework to understand the pricing strategy of the cell invasion and migration assays offered by a company, along with its competitive position. In addition, it presents the equation devised to calculate the likely price of the cell invasion and migration assays based upon its characteristics.
One of the key objectives of the report was to estimate the existing market size and estimate the future size of cell invasion and migration assays market. We have provided informed estimates on the evolution of the market, over the period 2022-2035. Our year-wise projections of the current and future opportunity have further been segmented on the basis of [A] type of assay (cell invasion assay and cell migration assay), [B] application area(drug discovery, screening and tumor study), [C] detection method used (colorimetry and fluorometry) and [D] key geographical regions (North America, Europe, Asia-Pacific, Latin America, MENA and Rest of the World). In order to account for future uncertainties associated with some of the key parameters and to add robustness to our forecast model, we have provided three market forecast scenarios, portraying the conservative, base and optimistic tracks of the market's evolution.
All actual figures have been sourced and analyzed from publicly available information forums and primary research discussions. Financial figures mentioned in this report are in USD, unless otherwise specified.
Key Questions Answered:
- Which companies are engaged in offering cell invasion and migration assays kits?
- What is the most common assay format (in terms of number of wells) offered by cell invasion and migration assay providers?
- What are the key geographical regions where cell invasion and migration assay providers are located?
- What is the evolving trend of publications focused on cell invasion and migration assays?
- Which companies are actively filing patents to drive innovation in the field of cell invasion and migration assays?
- What are the key factors influencing the price of cell invasion and migration assays?
- What are the key challenges associated with cell invasion and migration assays?
- How is the current and future market opportunity likely to be distributed across key market segments?
Chapter Outlines
Chapter 2 is an executive summary of key insights captured during our research. It offers a high-level view on the current state of cell invasion and migration assays market and its likely evolution in the short to mid-term and long-term.
Chapter 3 provides a general introduction to cell invasion and migration, including a discussion on the Boyden Chamber's principle. It further highlights different types of cell invasion and migration assays, along with information on the key challenges associated with this domain. Furthermore, it provides information on the role of kit components in cell invasion and migration assays and their various applications.
Chapter 4 provides a detailed assessment of the current market landscape of companies engaged in offering cell invasion and migration assays based on several parameters, such as year of establishment, company size, location of headquarters, type of end-user (industry and non-industry). It is worth highlighting that during our research, we were able to identify 83 cell invasion and migration assays that were assessed on various relevant parameters, such as type of cell culture (adherent cell culture and suspension cell culture), type of assay (cell invasion assay and cell migration assay), number of wells (24-well, 32-well, 48-well, 96-well and 384-well), pore size of wells (3 µm, 5 µm , 8 µm , 9 µm and 12 µm), type of ECM coating (basement membrane extract, collagen I, collagen IV, fibronectin and laminin,), storage temperature (ultra-low, frozen, refrigerated and room temperature), application area (drug discovery, screening and tumor study), detection method used (colorimetry and fluorometry) and number of assays performed.
Chapter 5 provides an insightful product competitiveness analysis, highlighting the capabilities of cell invasion and migration assay kit providers, based on supplier strength (in terms of years of experience and company size) and product portfolio strength (taking into account type of cell culture, number of wells, type of ECM coating, kit components, application area, detection method used and number of assays performed).
Chapter 6 provides elaborate profiles of key players (large and mid-sized companies, established before 2000) offering cell-based assay products. Each profile features a brief overview of the company, along with information on its product portfolio, recent developments and an informed future outlook.
Chapter 7 provides a detailed review of around 675 peer-reviewed, scientific articles related to research on cell invasion and migration assays, based on several relevant parameters, such as year of publication, type of publication, and popular keywords, top journals, top institutes and top authors (in terms of number of articles published).
Chapter 8 presents an analysis of patents related to cell invasion and migration assays, filed / granted since 2017, based on several relevant parameters, such as publication year, geographical location / patent jurisdiction, legal status, CPC symbols, emerging focus areas, type of applicant and leading players (in terms of number of patents). In addition, it features a patent valuation analysis, which evaluates the qualitative and quantitative aspects of patents.
Chapter 9 presents an analysis on academic grants that have been awarded to various research institutes for projects focused on cell invasion and migration, during the period, 2017-2022, based on several relevant parameters, such as year of grant award, amount awarded, support period, type of funding institute center and support period, grant application, purpose of grant award, grant activity code, NIH spending category, study section involved, popular NIH departments, recipient organization, regional distribution of recipient organization. Further, the chapter also highlights the popular recipient organizations, (in terms of number of grants and amount awarded) and prominent program officers.
Chapter 10 presents a Bowman's strategy clock framework to understand the pricing strategy of the cell invasion and migration assays offered by a company, along with its competitive position. In addition, it presents the equation devised to calculate the likely price of the cell invasion and migration assays based upon its characteristics.
Chapter 11 presents an insightful market forecast analysis, highlighting the future potential of cell invasion and migration assays market till 2035. We have segmented the market on the basis of type of assay (cell invasion assay and cell migration assay), application area(drug discovery, screening and tumor study), detection method used (colorimetry and fluorometry) and key geographical regions (North America, Europe, Asia-Pacific, Latin America, MENA and Rest of the World).
Chapter 12 is a summary of the entire report. It provides the key takeaways and presents our independent opinion of the cell invasion and migration assays market, based on the research and analysis described in the previous chapters.
Chapter 13 is an appendix, which provides tabulated data and numbers for all the figures provided in the report.
Chapter 14 is an appendix, which provides the list of companies and organizations mentioned in the report.
TABLE OF CONTENTS
1. PREFACE
- 1.1. Scope of the Report
- 1.2. Research Methodology
- 1.3. Key Questions Answered
- 1.4. Chapter Outlines
2. EXECUTIVE SUMMARY
- 2.1. Chapter Overview
3. INTRODUCTION
- 3.1. Chapter Overview
- 3.2. Overview of Cell Invasion and Migration Assays
- 3.2.1. Introduction to Boyden Chamber Principle
- 3.3. Classification of Cell Invasion / Migration Assays
- 3.3.1. Scratch Assay
- 3.3.2. Cell Exclusion Assay
- 3.3.3. Spheroid Migration Assay
- 3.3.4. Microcarrier Bead Assay
- 3.3.5. Capillary Chamber Migration Assay
- 3.3.6. Trans-well Invasion Assay
- 3.3.7. Gelatin degradation assay
- 3.3.8. Spheroid Invasion Assay
- 3.4. Role of Kit Components in Cell Invasion / Migration Assays
- 3.5. Applications of Cell Invasion / Migration Assays
- 3.5.1. Screening and Detection
- 3.5.2. Drug Discovery
- 3.5.3. Cancer Research
- 3.6. Future Perspectives
4. MARKET LANDSCAPE
- 4.1. Chapter Overview
- 4.2. Cell Invasion and Migration Assays: List of Providers
- 4.2.1. Analysis by Year of Establishment
- 4.2.2. Analysis by Company Size
- 4.2.3. Analysis by Location of Headquarters
- 4.2.4. Analysis by Type of End-User
- 4.3. Cell Invasion and Migration Assays: Market Landscape
- 4.3.1. Analysis by Type of Cell Culture
- 4.3.2. Analysis by Type of Assay
- 4.3.3. Analysis by Number of Wells
- 4.3.4. Analysis by Pore Size of Wells
- 4.3.5. Analysis by Type of ECM Coating
- 4.3.6. Analysis by Storage Temperature
- 4.3.7. Analysis by Application Area
- 4.3.8. Analysis by Detection Method Used
- 4.3.9. Analysis by Number of Assays Performed
- 4.3.10. Analysis by Type of Assay and Detection Method Used
- 4.3.11. Analysis of Assay Providers by Type of Assay and Application Area (Grid Representation)
- 4.3.12. Analysis of Assays by Type of Assay, Number of Assays Performed and Number of Wells (Heat Map Representation)
5. PRODUCT COMPETITIVENESS ANALYSIS
- 5.1. Chapter Overview
- 5.2. Key Assumptions and Parameters
- 5.3. Methodology
- 5.4. Product Competitiveness Analysis
- 5.4.1. Cell Invasion Assays Offered by Small Companies
- 5.4.2. Cell Invasion Assays Offered by Mid-sized Companies
- 5.4.3. Cell Invasion Assays Offered by Large Companies
- 5.4.4. Cell Invasion Assays Offered by Very Large Companies
- 5.5. Product Competitiveness Analysis
- 5.5.1. Cell Migration Assays Offered by Small Companies
- 5.5.2. Cell Migration Assays Offered by Mid-sized Companies
- 5.5.3. Cell Migration Assays Offered by Large Companies
- 5.5.4. Cell Migration Assays Offered by Very Large Companies
6. COMPANY PROFILES
- 6.1. Chapter Overview
- 6.2. Abcam
- 6.2.1. Company Overview
- 6.2.2. Product Portfolio
- 6.2.3. Recent Developments and Future Outlook
- 6.3. BioVision
- 6.3.1. Company Overview
- 6.3.2. Product Portfolio
- 6.3.3. Recent Developments and Future Outlook
- 6.4. Enzo Life Sciences
- 6.4.1. Company Overview
- 6.4.2. Product Portfolio
- 6.4.3. Recent Developments and Future Outlook
- 6.5. MilliporeSigma
- 6.5.1. Company Overview
- 6.5.2. Product Portfolio
- 6.5.3. Recent Developments and Future Outlook
- 6.6. R&D Systems
- 6.6.1. Company Overview
- 6.6.2. Product Portfolio
- 6.6.3. Recent Developments and Future Outlook
- 6.7. Sigma-Aldrich
- 6.7.1. Company Overview
- 6.7.2. Product Portfolio
- 6.7.3. Recent Developments and Future Outlook
7. PUBLICATION ANALYSIS
- 7.1. Chapter Overview
- 7.2. Scope and Methodology
- 7.3. Cell Invasion and Migration Assays: List of Publications
- 7.3.1. Analysis by Quarterly Trend of Publications (2021-2022)
- 7.3.2. Analysis by Type of Publication
- 7.3.3. Most Popular Journals: Analysis by Number of Publications
- 7.3.4. Most Popular Publisher: Analysis by Number of Publications
- 7.3.5. Most Popular Copyright Holder: Analysis by Number of Publications
- 7.3.6. Publication Analysis: Most Popular Keywords
- 7.3.7. Analysis by Affiliated Institutes
- 7.3.8. Geographical Analysis of Affiliated Institutes
- 7.3.9. Analysis by Funding Institutes
8. PATENT ANALYSIS
- 8.1. Chapter Overview
- 8.2. Scope and Methodology
- 8.3. Cell Invasion and Migration Assays: Patent Analysis
- 8.3.1. Analysis by Type of Patent
- 8.3.2. Analysis by Patent Publication Year
- 8.3.3 Year-wise Trend by Number of Granted Patent and Patent Applications
- 8.3.4. Analysis by Issuing Authority
- 8.3.5. Analysis by Patent Age
- 8.3.6. Analysis by CPC Symbols
- 8.3.7. Leading Players: Analysis by Number of Patents
- 8.4 Cell Invasion and Migration Assays: Patent Benchmarking Analysis
- 8.4.1. Analysis by Patent Characteristics
- 8.4.2 Analysis by Geography
- 8.5. Cell Invasion and Migration Assays: Patent Valuation Analysis
9. GRANT ANALYSIS
- 9.1. Chapter Overview
- 9.2. Scope and Methodology
- 9.3. Cell Invasion and Migrations Assays: Grant Analysis
- 9.3.1. Analysis by Year of Grant Award
- 9.3.2. Analysis by Amount Awarded
- 9.3.3. Analysis by Support Period
- 9.3.4. Analysis by Funding Institute Center and Support Period
- 9.3.5. Analysis by Type of Grant Application
- 9.3.6. Analysis by Purpose of Grant Award
- 9.3.7. Analysis By Activity Code
- 9.3.8. Analysis by NIH Spending Category (Word Cloud Representation)
- 9.3.9. Analysis by Study Section Involved
- 9.3.10. Popular NIH Departments: Analysis by Number of Grants
- 9.3.11. Analysis by Type of Recipient Organization
- 9.3.12. Prominent Program Officers: Analysis by Number of Grants
- 9.3.13. Popular Recipient Organizations: Analysis by Number of Grants
- 9.3.14. Popular Recipient Organizations: Analysis by Grant Amount
- 9.3.15. Analysis by Region of Recipient Organization
10. BOWMAN CLOCK PRICING STRATEGY
- 10.1. Chapter Overview
- 10.2. Bowman Strategy Clock
- 10.2.1. Two Dimensions of Bowman Strategy Clock
- 10.2.2. Eight Positions on Bowman Strategy Clock
- 10.3. Roots Analysis Framework
- 10.3.1. Methodology
- 10.3.2. Theoretical Framework and Price Evaluation Hypothesis
- 10.3.3. Results and Interpretation
- 10.3.3.1. Product Price Evaluation Matrix: Information on Type of Assay
- 10.3.3.2. Product Price Evaluation Matrix: Information on Number of Wells
- 10.3.3.3. Product Price Evaluation Matrix: Information on Pore Size of Wells
- 10.3.3.4. Product Price Evaluation Matrix: Information on Type of ECM Coating
- 10.3.3.5. Product Price Evaluation Matrix: Information on Storage Temperature
- 10.3.3.6. Product Price Evaluation Matrix: Information on Application Area
- 10.3.3.7. Product Price Evaluation Matrix: Information on Detection Method Used
- 10.3.3.8. Product Price Evaluation Matrix: Information on Number of Assays Performed
11. MARKET FORECAST AND OPPORTUNITY ANALYSIS
- 11.1. Chapter Overview
- 11.2. Forecast Methodology and Key Assumptions
- 11.3. Global Cell Invasion and Migration Assays Market, 2022-2035
- 11.4 Cell Invasion and Migration Assays Market: Analysis by Type of Assay
- 11.4.1. Cell Invasion Assays Market, 2022-2035
- 11.4.2. Cell Migration Assays Market, 2022-2035
- 11.5. Cell Invasion and Migration Assays Market: Analysis by Application Area
- 11.5.1. Cell Invasion and Migration Assays Market for Drug Discovery, 2022-2035
- 11.5.2. Cell Invasion and Migration Assays Market for Screening, 2022-2035
- 11.5.3. Cell Invasion and Migration Assays Market for Tumor Study, 2022-2035
- 11.6. Cell Invasion and Migration Assays Market: Analysis by Detection Method Used
- 11.6.1. Cell Invasion and Migration Assays Market for Colorimetry, 2022-2035
- 11.6.2. Cell Invasion and Migration Assays Market for Fluorometry, 2022-2035
- 11.7. Cell Invasion and Migration Assays Market: Analysis by Geography
- 11.7.1. Cell Invasion and Migration Assays Market in North America, 2022-2035
- 11.7.2. Cell Invasion and Migration Assays Market in Europe, 2022-2035
- 11.7.3. Cell Invasion and Migration Assays Market in Asia-Pacific, 2022-2035
- 11.7.4. Cell Invasion and Migration Assays Market in Latin America, 2022-2035
- 11.7.5. Cell Invasion and Migration Assays Market in Middle East and North Africa, 2022-2035
- 11.7.6. Cell Invasion and Migration Assays Market in Rest of the World, 2022-2035
12. CONCLUSION
- 12.1. Chapter Overview
13. APPENDIX I: TABULATED DATA
14. APPENDIX II: LIST OF COMPANIES AND ORGANIZATIONS
List Of Figures
- Figure 2.1. Executive Summary: Overall Market Landscape
- Figure 2.2. Executive Summary: Publication Analysis
- Figure 2.3. Executive Summary: Patent Analysis
- Figure 2.4. Executive Summary: Grant Analysis
- Figure 2.5. Executive Summary: Bowman Clock Pricing Strategy
- Figure 2.6. Executive Summary: Market Forecast and Opportunity Analysis
- Figure 3.1. Mechanism of Cell Migration Assay
- Figure 3.2. Mechanism of Cell Invasion Assay
- Figure 4.1. Cell Invasion and Migration Assay Providers: Distribution by Year of Establishment
- Figure 4.2. Cell Invasion and Migration Assay Providers: Distribution by Company Size
- Figure 4.3. Cell Invasion and Migration Assay Providers: Distribution by Location of Headquarters
- Figure 4.4. Cell Invasion and Migration Assay Providers: Distribution by Type of End-User
- Figure 4.5. Cell Invasion and Migration Assays: Distribution by Type of Cell Culture
- Figure 4.6. Cell Invasion and Migration Assays: Distribution by Type of Assay
- Figure 4.7. Cell Invasion and Migration Assays: Distribution by Number of Wells
- Figure 4.8. Cell Invasion and Migration Assays: Distribution by Pore Size of Wells
- Figure 4.9. Cell Invasion and Migration Assays: Distribution by Type of ECM Coating
- Figure 4.10. Cell Invasion and Migration Assays: Distribution by Storage Temperature
- Figure 4.11. Cell Invasion and Migration Assays: Distribution by Application Area
- Figure 4.12. Cell Invasion and Migration Assays: Distribution by Detection Method Used
- Figure 4.13. Cell Invasion and Migration Assays: Distribution by Number of Assays Performed
- Figure 4.14. Cell Invasion and Migration Assays: Distribution by Type of Assay and Detection Method Used
- Figure 4.15. Cell Invasion and Migration Assay Providers: Distribution by Type of Assay and Application Area (Grid Representation)
- Figure 4.16. Cell Invasion and Migration Assays: Distribution of Assays by Type of Assay, Number of Assays Performed and Number of Wells (Heat Map Representation)
- Figure 5.1. Product Competitiveness Analysis: Distribution of Cell Invasion Assays Offered by Small Companies (Peer Group 1)
- Figure 5.2. Product Competitiveness Analysis: Distribution of Cell Invasion Assays Offered by Mid-sized Companies (Peer Group 2)
- Figure 5.3. Product Competitiveness Analysis: Distribution of Cell Invasion Assays Offered by Large Companies (Peer Group 3)
- Figure 5.4. Product Competitiveness Analysis: Distribution of Cell Invasion Assays Offered by Very Large Companies (Peer Group 4)
- Figure 5.5. Product Competitiveness Analysis: Distribution of Cell Migration Assays Offered by Small Companies (Peer Group 1)
- Figure 5.6. Product Competitiveness Analysis: Distribution of Cell Migration Assays Offered by Mid-sized Companies (Peer Group 2)
- Figure 5.7. Product Competitiveness Analysis: Distribution of Cell Migration Assays Offered by Large Companies (Peer Group 3)
- Figure 5.8. Product Competitiveness Analysis: Distribution of Cell Migration Assays Offered by Very Large Companies (Peer Group 4)
- Figure 7.1. Publication Analysis: Quarterly Distribution of Publications, 2021-2022
- Figure 7.2. Publication Analysis: Distribution by Type of Publication
- Figure 7.3. Most Popular Journals: Distribution by Number of Publications
- Figure 7.4. Most Popular Publishers: Distribution by Number of Publications
- Figure 7.5. Most Popular Copyright Holders: Distribution by Number of Publications
- Figure 7.6. Publication Analysis: Most Popular Keywords
- Figure 7.7. Publication Analysis: Distribution by Affiliated Institutes
- Figure 7.8. Publication Analysis: Geographical Distribution of Affiliated Institutes
- Figure 7.9. Publication Analysis: Distribution by Funding Institutes
- Figure 8.1. Patent Analysis: Distribution by Type of Patent
- Figure 8.2. Patent Analysis: Cumulative Distribution by Patent Publication Year, 2017-2022
- Figure 8.3. Patent Analysis: Year-wise Trend by Number of Granted Patent and Patent Applications, 2017-2022
- Figure 8.4. Patent Analysis: Distribution by Issuing Authority
- Figure 8.5. Patent Analysis: Distribution by Patent Age
- Figure 8.6. Patent Analysis: Distribution by CPC Symbols
- Figure 8.7. Leading Industry Players: Distribution by Number of Patents
- Figure 8.8. Leading Non-Industry Players: Distribution by Number of Patents
- Figure 8.9. Patent Benchmarking Analysis: Distribution of Leading Industry Players by Patent Characteristics (CPC Symbols)
- Figure 8.10. Patent Benchmarking Analysis: Distribution of Leading Industry Players by International Patents
- Figure 8.11. Cell Invasion and Migration Assays: Patent Valuation
- Figure 9.1. Grant Analysis: Cumulative Trend by Year of Grant Award, 2017-2022
- Figure 9.2. Grant Analysis: Distribution by Amount Awarded (USD Million), 2017-2022
- Figure 9.3. Grant Analysis: Distribution by Support Period
- Figure 9.4. Grant Analysis: Distribution by Funding Institute Center and Support Period
- Figure 9.5. Grant Analysis: Distribution by Type of Grant Application
- Figure 9.6. Grant Analysis: Distribution by Purpose of Grant Award
- Figure 9.7. Grant Analysis: Distribution by Activity Code
- Figure 9.8. Word Cloud: NIH Spending Category
- Figure 9.9. Grant Analysis: Distribution by Study Section Involved
- Figure 9.10. Popular NIH Departments: Distribution by Number of Grants
- Figure 9.11. Grant Analysis: Distribution by Type of Recipient Organization
- Figure 9.12. Prominent Program Officers: Distribution by Number of Grants
- Figure 9.13. Popular Recipient Organizations: Distribution by Number of Grants
- Figure 9.14. Popular Recipient Organization: Distribution by Grant Amount
- Figure 9.15. Grant Analysis: Distribution by Region of Recipient Organization
- Figure 10.1. Cell Invasion and Migration Assays: Bowman Clock Pricing Strategy Matrix
- Figure 10.2. Cell Invasion and Migration Assays: Bowman Clock Pricing Strategy Graphical Interpretation
- Figure 11.1. Global Cell Invasion and Migration Assays Market, 2022-2035 (USD Million)
- Figure 11.2. Cell Invasion and Migration Assays Market: Distribution by Type of Assay
- Figure 11.3. Cell Invasion Assays Market, 2022-2035 (USD Million)
- Figure 11.4. Cell Migration Assays Market, 2022-2035 (USD Million)
- Figure 11.5. Cell Invasion and Migration Assays Market: Distribution by Application Area
- Figure 11.6. Cell Invasion and Migration Assays Market for Drug Discovery, 2022-2035 (USD Million)
- Figure 11.7. Cell Invasion and Migration Assays Market for Screening, 2022-2035 (USD Million)
- Figure 11.8. Cell Invasion and Migration Assays Market for Tumor Study, 2022-2035 (USD Million)
- Figure 11.9. Cell Invasion and Migration Assays Market: Distribution by Detection Method Used
- Figure 11.10. Cell Invasion and Migration Assays Market for Colorimetry, 2022-2035 (USD Million)
- Figure 11.11. Cell Invasion and Migration Assays Market for Fluorometry, 2022-2035 (USD Million)
- Figure 11.12. Cell Invasion and Migration Assays Market: Distribution by Geography
- Figure 11.13. Cell Invasion and Migration Assays Market in North America, 2022-2035 (USD Million)
- Figure 11.14. Cell Invasion and Migration Assays Market in Europe, 2022-2035 (USD Million)
- Figure 11.15. Cell Invasion and Migration Assays Market in Asia-Pacific, 2022-2035 (USD Million)
- Figure 11.16. Cell Invasion and Migration Assays Market in Latin America, 2022-2035 (USD Million)
- Figure 11.17. Cell Invasion and Migration Assays Market in Middle East and North Africa, 2022-2035 (USD Million)
- Figure 11.18. Cell Invasion and Migration Assays Market in Rest of the World, 2022-2035 (USD Million)
- Figure 12.1. Concluding Remarks: Overall Market Landscape
- Figure 12.2. Concluding Remarks: Publication Analysis
- Figure 12.3. Concluding Remarks: Patent Analysis
- Figure 12.4. Concluding Remarks: Grant Analysis
- Figure 12.5. Concluding Remarks: Market Forecast and Opportunity Analysis
List Of Tables
- Table 3.1. Role of Kit Components in Cell Invasion / Migration Assays
- Table 4.1. Cell Invasion and Migration Assays: List of Providers
- Table 4.2. Cell Invasion and Migration Assays: Information on Type of Cell Culture
- Table 4.3. Cell Invasion and Migration Assays: Information on Type of Assay
- Table 4.4. Cell Invasion and Migration Assays: Information on Number of Wells
- Table 4.5. Cell Invasion and Migration Assays: Information on Pore Size of Wells
- Table 4.6. Cell Invasion and Migration Assays: Information on Type of ECM Coating
- Table 4.7. Cell Invasion and Migration Assays: Information on Storage Temperature
- Table 4.8. Cell Invasion and Migration Assays: Information on Application Area
- Table 4.9. Cell Invasion and Migration Assays: Information on Detection Method Used
- Table 4.10. Cell Invasion and Migration Assays: Information on Number of Assays Performed
- Table 6.1. Abcam: Key Highlights
- Table 6.2. Abcam: Product Portfolio
- Table 6.3. Abcam: Recent Developments and Future Outlook
- Table 6.4. BioVision: Key Highlights
- Table 6.5. BioVision: Product Portfolio
- Table 6.6. Enzo Life Sciences: Key Highlight
- Table 6.7. Enzo Life Sciences: Product Portfolio
- Table 6.8. MilliporeSigma: Key Highlights
- Table 6.9. MilliporeSigma: Product Portfolio
- Table 6.10. R&D Systems: Key Highlights
- Table 6.11. R&D Systems: Product Portfolio
- Table 6.12. Sigma-Aldrich: Key Highlights
- Table 6.13. Sigma-Aldrich: Product Portfolio
- Table 7.1. Cell Invasion and Migration Assays: List of Publications
- Table 8.1. Patent Analysis: CPC Symbols
- Table 8.2. Patent Analysis: Most Popular CPC Symbols
- Table 8.3. Patent Analysis: List of Top CPC Symbols
- Table 8.4. Patent Analysis: Categorization based on Weighted Valuation Scores
- Table 8.5. Patent Analysis: List of Relatively Higher Value Patents
- Table 10.1. Product Price Evaluation Matrix: Information on Type of Assay (USD)
- Table 10.2. Product Price Evaluation Matrix: Information on Number of Wells (USD)
- Table 10.3. Product Price Evaluation Matrix: Information on Pore Size of Wells (USD)
- Table 10.4. Product Price Evaluation Matrix: Information on Type of ECM Coating (USD)
- Table 10.5. Product Price Evaluation Matrix: Information on Storage Temperature (USD)
- Table 10.6. Product Price Evaluation Matrix: Information on Application Area (USD)
- Table 10.7. Product Price Evaluation Matrix: Information on Detection Method Used (USD)
- Table 10.8. Product Price Evaluation Matrix: Information on Number of Assays Performed (USD)
- Table 14.1. Cell Invasion and Migration Assay Providers: Distribution by Year of Establishment
- Table 14.2. Cell Invasion and Migration Assay Providers: Distribution by Company Size
- Table 14.3. Cell Invasion and Migration Assay Providers: Distribution by Location of Headquarters
- Table 14.4. Cell Invasion and Migration Assay Providers: Distribution by Type of End-User
- Table 14.5. Cell Invasion and Migration Assays: Distribution by Type of Cell Culture
- Table 14.6. Cell Invasion and Migration Assays: Distribution by Type of Assay
- Table 14.7. Cell Invasion and Migration Assays: Distribution by Number of Wells
- Table 14.8. Cell Invasion and Migration Assays: Distribution by Pore Size of Wells
- Table 14.9. Cell Invasion and Migration Assays: Distribution by Type of ECM Coating
- Table 14.10. Cell Invasion and Migration Assays: Distribution by Storage Temperature
- Table 14.11. Cell Invasion and Migration Assays: Distribution by Application Area
- Table 14.12. Cell Invasion and Migration Assays: Distribution by Detection Method Used
- Table 14.13. Cell Invasion and Migration Assays: Distribution by Number of Assays Performed
- Table 14.14. Cell Invasion and Migration Assays: Distribution by Type of Assay and Detection Method Used
- Table 14.15. Publication Analysis: Quarterly Distribution of Publications, 2021-2022
- Table 14.16. Publication Analysis: Distribution by Type of Publication
- Table 14.17. Most Popular Journals: Distribution by Number of Publications
- Table 14.18. Most Popular Publishers: Distribution by Number of Publications
- Table 14.19. Most Popular Copyright Holders: Distribution by Number of Publications
- Table 14.20. Publication Analysis: Most Popular Keywords
- Table 14.21. Publication Analysis: Distribution by Affiliated Institutes
- Table 14.22. Publication Analysis: Geographical Distribution of Affiliated Institutes
- Table 14.23. Publication Analysis: Distribution by Funding Institutes
- Table 14.24. Patent Analysis: Distribution by Type of Patent
- Table 14.25. Patent Analysis: Cumulative Distribution by Patent Publication Year, 2017-2022
- Table 14.26. Patent Analysis: Year-wise Trend by Number of Granted Patent and Patent Applications, 2017-2022
- Table 14.27. Patent Analysis: Distribution by Issuing Authority
- Table 14.28. Patent Analysis: Distribution by Patent Age
- Table 14.29. Leading Industry Players: Distribution by Number of Patents
- Table 14.30. Leading Non-Industry Players: Distribution by Number of Patents
- Table 14.31. Patent Benchmarking Analysis: Distribution of Leading Industry Players by International Patents
- Table 14.32. Cell Invasion and Migration Assays: Patent Valuation
- Table 14.33. Grant Analysis: Cumulative Trend by Year of Grant Award, 2017-2022
- Table 14.34. Grant Analysis: Distribution by Grant Amount Awarded (USD Million), 2017-2022
- Table 14.35. Grant Analysis: Distribution by Support Period
- Table 14.36. Grant Analysis: Distribution by Type of Grant Application
- Table 14.37. Grant Analysis: Distribution by Purpose of Grant Award
- Table 14.38. Grant Analysis: Distribution by Activity Code
- Table 14.39. Grant Analysis: Distribution by Study Section Involved
- Table 14.40. Popular NIH Departments: Distribution by Number of Grants
- Table 14.41. Grant Analysis: Distribution by Types of Recipient Organization
- Table 14.42. Prominent Program Officers: Distribution by Number of Grants
- Table 14.43. Popular Recipient Organization: Distribution by Number of Grants
- Table 14.44. Popular Recipient Organization: Distribution by Grant Amount
- Table 14.45. Global Cell Invasion and Migration Assays Market, Conservative, Base and Optimistic Scenarios, 2022-2035 (USD Million)
- Table 14.46. Cell Invasion and Migration Assays Market: Distribution by Type of Assay
- Table 14.47. Cell Invasion Assays Market, Conservative, Base and Optimistic Scenarios, 2022-2035 (USD Million)
- Table 14.48. Cell Migration Assays Market, Conservative, Base and Optimistic Scenarios, 2022-2035 (USD Million)
- Table 14.49. Cell Invasion and Migration Assays Market: Distribution by Application Area
- Table 14.50. Cell Invasion and Migration Assays Market for Drug Discovery, Conservative, Base and Optimistic Scenarios, 2022-2035 (USD Million)
- Table 14.51. Cell Invasion and Migration Assays Market for Screening, Conservative, Base and Optimistic Scenarios, 2022-2035 (USD Million)
- Table 14.52. Cell Invasion and Migration Assays Market for Tumor Study, Conservative, Base and Optimistic Scenarios, 2022-2035 (USD Million)
- Table 14.53. Cell Invasion and Migration Assays Market: Distribution by Detection Method Used
- Table 14.54. Cell Invasion and Migration Assays Market for Colorimetry, Conservative, Base and Optimistic Scenarios, 2022-2035 (USD Million)
- Table 14.55. Cell Invasion and Migration Assays Market for Fluorometry, Conservative, Base and Optimistic Scenarios, 2022-2035 (USD Million)
- Table 14.56. Cell Invasion and Migration Assays Market: Distribution by Geography
- Table 14.57. Cell Invasion and Migration Assays Market in North America, Conservative, Base and Optimistic Scenarios, 2022-2035 (USD Million)
- Table 14.58. Cell Invasion and Migration Assays Market in Europe, Conservative, Base and Optimistic Scenarios, 2022-2035 (USD Million)
- Table 14.59. Cell Invasion and Migration Assays Market in Asia-Pacific, Conservative, Base and Optimistic Scenarios, 2022-2035 (USD Million)
- Table 14.60. Cell Invasion and Migration Assays Market in Latin America, Conservative, Base and Optimistic Scenarios, 2022-2035 (USD Million)
- Table 14.61. Cell Invasion and Migration Assays Market in Middle East and North Africa, Conservative, Base and Optimistic Scenarios, 2022-2035 (USD Million)
- Table 14.62. Cell Invasion and Migration Assays Market in Rest of the World, Conservative, Base and Optimistic Scenarios, 2022-2035 (USD Million)
List Of Companies
The following companies and organizations have been mentioned in the report:
- 1. Abcam
- 2. Acomhal Research
- 3. Alabama State University
- 4. Albert Einstein College of Medicine
- 5. Assay Genie
- 6. Baltimore VA Medical Center
- 7. Baylor College of Medicine
- 8. Beckman Research Institute
- 9. BioVision
- 10. Boston University
- 11. Brigham and Women's Hospital
- 12. Brown University
- 13. California Institute of Technology
- 14. California State Polytechnic University
- 15. Carnegie Mellon University
- 16. Case Western Reserve University
- 17. Cedars-Sinai Medical Center
- 18. Cell Biolabs
- 19. Cell Reprogramming & Therapeutics
- 20. Cincinnati Children's Hospital Medical Center
- 21. Cleveland Clinic Lerner College of Medicine
- 22. Columbia University Health Sciences
- 23. Cornell University
- 24. Dana-Farber Cancer Institute
- 25. Drexel University
- 26. Duke University
- 27. Echelon Biosciences
- 28. Emory University
- 29. Endomet Biosciences
- 30. Enzo Life Sciences
- 31. Fesarius Therapeutics
- 32. Florida International University
- 33. Florida State University
- 34. Fox Chase Cancer Center
- 35. Fred Hutchinson Cancer Research Center
- 36. Georgetown University
- 37. H. Lee Moffitt Cancer Center & Research Institute
- 38. Icahn School of Medicine
- 39. Indiana University-Purdue University Indianapolis
- 40. Iowa State University
- 41. Johns Hopkins University
- 42. LifeSpan BioSciences
- 43. Massachusetts General Hospital
- 44. Massachusetts Institute of Technology
- 45. Mayo Clinic
- 46. Memorial Sloan Kettering Cancer Center
- 47. MilliporeSigma
- 48. Morehouse School of Medicine
- 49. MyBioSource
- 50. National Cancer Institute
- 51. New Mexico State University
- 52. New York University
- 53. North Carolina Agricultural and Technical State University
- 54. NYU Grossman School of Medicine
- 55. Ohio State University
- 56. Oregon Health & Science University
- 57. Penn State Health Milton S. Hershey Medical Center
- 58. Planet Biotechnology
- 59. Platypus Technologies
- 60. Ponce Health Sciences University
- 61. R&D Systems
- 62. Ralph H. Johnson VA Medical Center
- 63. Rockefeller University
- 64. Roswell Park Comprehensive Cancer Center
- 65. Rowan University
- 66. Rutgers Biomedical and Health Sciences
- 67. Salk Institute for Biological Studies
- 68. Sanford Burnham Prebys
- 69. Sapphire Biotech
- 70. Sigma-Aldrich
- 71. St. Joseph's Hospital and Medical Center
- 72. Stanford University
- 73. Stony Brook University
- 74. Stowers Institute for Medical Research
- 75. Syntrix Biosystems
- 76. Temple University
- 77. Texas A&M University
- 78. The Catholic University of America
- 79. The University of Texas
- 80. The University of Texas Health Science Center
- 81. The University of Texas MD Anderson Cancer Center
- 82. Tufts University
- 83. Tuskegee University
- 84. Universidad Central Del Caribe
- 85. University of Alabama
- 86. University of Arizona
- 87. University of Arkansas
- 88. University of California
- 89. University of Chicago
- 90. University of Colorado Denver
- 91. University of Connecticut
- 92. University of Delaware
- 93. University of Florida
- 94. University of Houston
- 95. University of Illinois
- 96. University of Kentucky
- 97. University of Louisville
- 98. University of Maryland
- 99. University of Miami
- 100. University of Michigan
- 101. University of Minnesota
- 102. University of Nevada
- 103. University of North Carolina
- 104. University of Oklahoma Health Sciences Center
- 105. University of Pennsylvania
- 106. University of Pittsburgh
- 107. University of Puerto Rico
- 108. University of South Dakota
- 109. University of Southern California
- 110. University of Toledo
- 111. University of Utah
- 112. University of Vermont College of Agriculture and Life Sciences
- 113. University of Virginia
- 114. University of Washington
- 115. University of Wisconsin-Madison
- 116. Upstate Medical University
- 117. Utah State University
- 118. VA Eastern Colorado Health Care System
- 119. Vanderbilt University
- 120. Vanderbilt University Medical Center
- 121. Veterans Health Administration
- 122. Washington University
- 123. Weill Medical College of Cornell University
- 124. West Virginia University
- 125. Whitehead Institute
- 126. Wistar Institute
- 127. Wright State University
- 128. Yale University


