


 |
市場調查報告書
商品編碼
1071812
代謝組學服務的全球市場:按應用領域(生物標誌物搜索、個性化醫療、疾病診斷、藥物發現、毒性測試),按提供的代謝組學服務類型Metabolomics Services Market by Area of Application (Biomarker Discovery, Personalized Medicine, Disease Diagnostics, Drug Discovery and Toxicological Testing), Type of Metabolomics Service(s) Offered |
||||||
洞察例子
目錄
第一章前言
第2章執行摘要
第三章介紹
第四章市場情況
- 章節概述
- 代謝組學服務商:整體市場情況
- 代謝組學服務商:行業入口
- 代謝組學服務商:非行業公司
第 5 章重要見解
第6章企業競爭力
- 章節概述
- 主要先決條件和參數
- 調查方法
第 7 章公司簡介
- 章節概述
- biocrates 生命科學
- 創新蛋白質組學
- DNA 專家
- 艾瑞米德研究服務
- 人類代謝組技術 (HMT)
- 代謝概況
- 新陳代謝
- MS-組學
- 新基因科技
- Synbio Technologies
第 8 章夥伴關係和合作
- 章節概述
- 合作模式
- 代謝組學服務提供商:夥伴關係和合作
第 9 章價值創造框架:解決代謝組學中未滿足需求的戰略指南
- 章節概述
- 代謝組學中未滿足的需求
- 靈敏度和選擇性:關鍵工具和技術
- 數據處理:關鍵工具和技術
第 10 章市場預測
- 章節概述
- 預測性調查方法和關鍵假設
- 2022-2035 年代謝組學服務市場
- 代謝組學服務市場:按應用領域分析,2022 年和 2035 年
- 生物標誌物搜索
- 個性化醫療
- 藥物發現
- 疾病診斷
- 毒性測試
- 代謝組學服務市場:按提供的代謝組學服務類型分析,2022 年和 2035 年
- 靶向代謝組學
- 非靶向代謝組學
- 代謝組學服務市場:按使用的代謝組分析技術類型進行分析,2022 年和 2035 年
- LC-MS 技術
- GC-MS技術
- 核磁共振技術
- 代謝組學服務市場:按最終用戶類型分析,2022 年和 2035 年
- 學術/研究所
- 製藥/生物技術公司
- CRO
- 代謝組學服務市場:2022 年和 2035 年主要區域分析
- 北美
- 歐洲
- 亞洲
- 拉丁美洲
- 中東和北非
- 其他領域
- 結束語
第11章結論
第 12 章執行洞察力
第十三章附錄一:聚合數據
第十四章附錄二:公司和組織名單
Title:
Metabolomics Services
Market by Area of Application (Biomarker Discovery, Personalized Medicine, Disease Diagnostics, Drug Discovery and Toxicological Testing), Type of Metabolomics Service(s) Offered (Targeted Metabolomics and Untargeted Metabolomics), Type of Metabolome Profiling Technique Used (LC-MS, GC-MS and NMR), Type of End User (Research / Academic Institutes, Pharma / Biotech Firms and CROs) and Key Geographies (North America, Europe, Asia, Latin America, Middle East and North Africa and Rest of the World): Industry Trends and Global Forecasts, 2022-2035.
Example Insights:
Overview
Since the initiation of the Human Metabolome Project in 2005, the metabolomics technique has gathered significant attention from the industry stakeholders. It is worth mentioning that about 40,000 small molecules constitute the human metabolome. Further, 30% of the known genetic disorders are associated with small-molecule metabolism. Therefore, metabolome profiling can assist in obtaining a better understanding of the disease. The approach has also demonstrated to be capable of identifying new biomarkers (for diagnosis and prognosis) and novel drug targets. In fact, 50% of the total drug candidates are reported to emanate from pre-existing metabolites. Integration of metabolomics with development projects holds the potential to significantly improve the efficiency and success rate of drug discovery, owing to its ability to differentiate promising candidates in the early stages. As a result, metabolomics has become an indispensable part of modern drug discovery and development process and disease diagnosis. Further, with the growing prominence of personalized medicine, there is an increased demand for rapid, highly sensitive and accurate quantification methods, such as metabolomics, to analyze clinical specimens. It is worth highlighting that various types of metabolite detection techniques, including targeted metabolomics and untargeted metabolomics, are being employed for diagnosis, severity determination and therapy development efforts against COVID-19. Specifically, studies have reported the potential implications of the serum metabolome in understanding the pathophysiology of the aforementioned disease.
Given the growing pipeline of biomarkers and drug discovery projects, the current demand for metabolite profiling is high. In this context, more than 18,000 drug candidates are being evaluated across different development stages, at present. Although some pharmaceutical companies have established in-house metabolomics research capabilities, significant capital investments and specialized requirements render this approach prohibitive for most stakeholders. Moreover, the associated metabolomics technologies, including chromatography and spectrometry, are complicated by multi-step analytical protocols and technically demanding expertise, which eventually leads to contamination of samples and lack of reproducibility in test results. This has created a demand for service providers having the required expertise in the global metabolomics market. In fact, since 2000, more than 70 players offering metabolomics services have been established. Amidst growing competition in the metabolomics services market, the implementation of cutting-edge tools and technologies, such as artificial intelligence, big data analytics, deep learning, machine learning and quantum computing, serves to differentiate the offerings of stakeholders. Hence, several service providers engaged in this upcoming market have actively begun expanding their respective service portfolios, either through undertaking strategic acquisitions or forming alliances with other specialty companies. Considering the ongoing advancements and active research efforts, the metabolomics services market size is anticipated to be quadruple in the foreseen future.
Scope of the Report
The "Metabolomics Services Market by Area of Application (Biomarker Discovery, Personalized Medicine, Disease Diagnostics, Drug Discovery and Toxicological Testing), Type of Metabolomics Service(s) Offered (Targeted Metabolomics and Untargeted Metabolomics), Type of Metabolome Profiling Techniques Used (LC-MS, GC-MS and NMR), Type of End User (Research / Academic Institutes, Pharma / Biotech Firms and CROs) and Key Geographies (North America, Europe, Asia, Latin America, Middle East and North Africa and Rest of the World): Industry Trends and Global Forecasts, 2022-2035" report features an extensive study of the current market landscape and future potential of the metabolomics services market. The study features an in-depth analysis, highlighting the capabilities of various stakeholders engaged in providing metabolomics services. Amongst other elements, the report features:
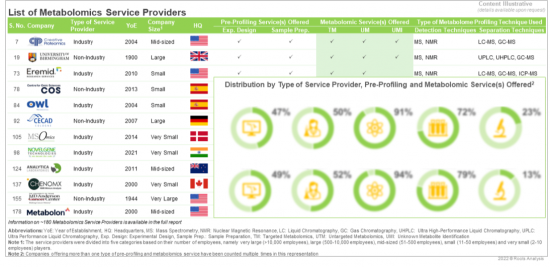
- A detailed review of the overall landscape of companies offering metabolomics services to various organizations, including research / academic institutes, pharma / biotech firms and CROs, along with analysis based on various relevant parameters, such as year of establishment, company size (in terms of employee count) and location of headquarters. The chapter also provides details related to pre-profiling service(s) offered (experiment design and sample preparation) , metabolomics service(s) offered (targeted metabolomics, untargeted metabolomics and unknown metabolite identification) , additional services offered (lipidomics, metabolic flux analysis, proteomics, and xenobiotic metabolites analysis) , type of metabolome profiling technique used (mass spectrometry, nuclear magnetic resonance, liquid chromatography, gas chromatography, inductively coupled plasma spectroscopy, capillary electrophoresis) , type of approach used for data analysis (multivariate analysis, univariate analysis, preprocess and normalization, clustering analysis, enrichment analysis and classification and feature selection) , type of biological sample analyzed (biological fluids, tissues, cells and stool) , source of biological sample (animal, microbe, human and plant) and area of application (biomarker discovery, disease diagnostics, drug discovery, toxicological testing and personalized medicine) .
- An in-depth analysis, highlighting the contemporary market trends, using eight schematic representations, including [A] waffle chart representations (based on regional distribution of various industry and non-industry players) , [B] world map representations (based on the country-wise distribution of various industry and non-industry players) , [C] a horizontally stacked bar chart representation (based on company / organization size and type of service provider) , [D] a mekko chart representation (based on area of application and company / organization size) , [E] a vertically stacked bar chart representation (based on type of metabolome profiling technique used and type of biological sample analyzed) , [F] a tree map representation (based on type of metabolome profiling technique and area of application) , [G] a 4D bubble analysis comparing the key players engaged in this domain, based on several relevant parameters (such as year of establishment, number of metabolomics services offered, company / organization size and region) , [H] a grid representation (based on company / organization size, region, type of metabolomics services offered, type of metabolome profiling technique used and area of application) .
- An in-depth company competitiveness analysis of metabolomics service providers, segmented into four categories, namely large and very large (>500 employees), mid-sized (51-500 employees), small (11-50 employees) and very small companies (<10 employees). Within the peer group, companies were ranked based on various relevant parameters, such as supplier power (based on the experience) and portfolio strength (based on parameters, such as number of pre-profiling profiling services offered, number of additional services offered, type of metabolome profiling technique used, type of approach used for data analysis, type of biological sample analysed, source of biological sample analysed and area of application) , as well as partnership activity (in terms of number of partnerships and type of agreement).
- Elaborate profiles of various prominent players that are currently engaged in offering metabolomics services. Each profile features a brief overview of the company (including information on year of establishment, number of employees, location of headquarters and key executives) , details related to its recent developments and an informed future outlook.
- An analysis of the partnerships that have been inked between several stakeholders engaged in providing metabolomic services, during the period 2014-2022, covering research agreements, R&D agreements, commercialization agreements, metabolomics data sharing agreements, acquisitions, service alliances, product development agreements and other agreements.
- An insightful framework depicting the implementation of several advanced tools and technologies, such as artificial intelligence, big data analytics, block chain, cloud computing, deep learning, machine learning and quantum computing, at different stages of a metabolomics study, which can assist service providers in addressing existing unmet needs. Further, it provides a detailed analysis on ease of implementation and associated risk in integrating above-mentioned technologies, based on the trends highlighted in published literature and patents.
One of the key objectives of the report was to estimate the existing market size and identify potential growth opportunities for metabolomics services market in the next 13 years. Additionally, it features market size projections for the metabolomics services market, wherein both the current and upcoming opportunity is segmented across [A] area of application (biomarker discovery, personalized medicine, disease diagnostics, drug discovery and toxicological testing) , [B] type of metabolomics service (targeted metabolomics and untargeted metabolomics) , [C] type metabolome profiling technique (LC-MS, GC-MS and NMR) , [D] type of end user (academic / research institutes, pharma / biotech firms, and CROs) and [E] key geographies (North America, Europe, Asia, Latin America, Middle East and North Africa and rest of the world). In order to account for future uncertainties and to add robustness to our model, we have provided three market forecast scenarios, namely the conservative, base and optimistic scenarios, which represent different tracks of the industry's evolution.
The opinions and insights presented in this study were influenced by discussions conducted with multiple stakeholders in this domain. The report features detailed transcripts of interviews held with the following individuals:
- Oliver Schimts (Head of Metabolome Data Science, BASF Metabolome Solutions)
- Manoj Kumar (Indian Representative - Eroth Technologies, biocrates life sciences)
- Bernhard Drotleff (Scientific Officer, European Molecular Biology Laboratory)
- Morten Danielsen (Chief Executive Officer, MS-Omics)
- Gilbert Skorski (Chairman and Chief Executive Officer, Phylogene)
Key Questions Answered:
- Who are the leading players engaged in providing metabolomics services?
- Which metabolomics services are most commonly offered by service providers engaged in this market?
- What is the relative competitiveness of metabolomics service providers?
- What types of partnership models are commonly being adopted by stakeholders in this industry?
- What is the likely performance enhancement value upon integrating novel tools / technologies in metabolomics studies?
- Which key market trends and driving factors are likely to impact the growth of the metabolomics services market?
- How is the current and future market opportunity likely to be distributed across key market segments?
Chapter Outlines
Chapter 2 is an executive summary of the insights captured during our research. The chapter offers a high-level view on the likely evolution of the metabolomics services market in the short to mid-term and long term.
Chapter 3 provides a general introduction to metabolomics, featuring information on various steps involved in the overall process. Further, it provides a detailed discussion on different approaches for metabolomics. In addition, the chapter includes details related to various applications and challenges associated with metabolomic studies. The chapter concludes with a discussion on key growth drivers, as well as upcoming trends in this field.
Chapter 4 includes detailed assessment of the overall landscape of the players offering metabolomics services to various organizations, including pharma / biotech firms, CROs and research / academic institutes, along with information on their year of establishment, company size (in terms of employee count) and location of headquarters (North America, Europe, Asia, Middle East and North Africa and Rest of The World). The chapter also provides details related to pre-profiling service(s) offered (experiment design and sample preparation) , metabolomics service(s) offered (targeted metabolomics, untargeted metabolomics and unknown metabolite identification) , additional services offered (lipidomics, metabolic flux analysis, proteomics, and xenobiotic metabolites analysis) , type of metabolome profiling technique used (mass spectrometry, nuclear magnetic resonance, liquid chromatography, gas chromatography, inductively coupled plasma spectroscopy, capillary electrophoresis) , type of approach used for data analysis (multivariate analysis, univariate analysis, preprocess and normalization, clustering analysis, enrichment analysis and classification and feature selection) , type of biological sample analyzed (biological fluids, tissues, cells and stool) , source of biological sample (animal, microbe, human and plant) , and area of application (biomarker discovery, disease diagnostics, drug discovery, toxicological testing and personalized medicine) .
Chapter 5 features an analysis, highlighting the contemporary market trends through eight schematic representations, including waffle chart representations based on regional distribution of various industry and non-industry players, world map representations based on the country-wise distribution of various industry and non-industry players, a horizontally stacked bar chart representation based on company / organization size and type of service provider, a mekko chart representation based on area of application and company / organization size, a vertically stacked bar chart representation based on type of metabolome profiling technique used and type of biological sample analyzed, a tree map representation based on type of metabolome profiling technique and area of application, a 4D bubble analysis comparing the key players engaged in this domain, based on several relevant parameters (such as year of establishment, number of metabolomics services offered, company / organization size and region) , and a grid representation based on company / organization size, region, type of metabolomics services offered, type of metabolome profiling technique used and area of application.
Chapter 6 provides an in-depth competitiveness analysis of metabolomics service providers, segmented into four categories, namely large and very large (>500 employees), mid-sized (51-500 employees) , small (11-50 employees) and very small companies (<10 employees). Within the peer group, companies were ranked based on various relevant parameters, such as supplier power (based on the experience) , their respective capabilities (number of pre-profiling profiling services offered, number of additional services offered, type of metabolome profiling technique used, type of approach used for data analysis, type of biological sample analysed, source of biological sample analysed and area of application) and partnership activity (in terms of number of partnerships and type of agreement) .
Chapter 7 includes detailed profiles of prominent players (shortlisted based on company competitiveness analysis) engaged in providing metabolomics services. Each profile features a brief overview of the company including information on several relevant parameters such as (year of establishment, number of employees, location of headquarters and key executives) . Further, the chapter also features details on recent developments and an informed future outlook.
Chapter 8 features an insightful analysis of the various partnerships and collaborations that have been inked amongst players in this market, during the period 2014-2022. Further, the partnership activity in this domain has been analyzed based on various parameters, such as year of partnership, type of partnership (research agreements, R&D agreements, commercialization agreements, metabolomics data sharing agreements, acquisitions, service alliances, product development agreements, and other related agreements) , type of partner (academic / research institutes, pharma / biotech firms, contract research organizations) , type of metabolomics service(s) offered (targeted metabolomics and untargeted metabolomics) , type of metabolome profiling technique used (LC-MS, GC-MS, NMR), area of application (biomarker discovery, disease diagnostics, drug discovery) and regional distribution of the collaborations.
Chapter 9 features an insightful framework depicting the implementation of several advanced tools and technologies, such as artificial intelligence, big data analytics, block chain, cloud computing, deep learning, machine learning, and quantum computing, at different stages of a metabolomics study, which can assist service providers to address unmet needs associated with such services. Further, it provides a detailed analysis on ease of implementation and associated risk in integrating above-mentioned technologies, based on the trends highlighted in published literature and patents.
Chapter 10 presents an insightful market forecast analysis, highlighting the future potential of metabolomics services market till the year 2035. In order to provide details on the future opportunity, our projections have been segmented across important market segments, namely [A] area of application (biomarker discovery, personalized medicine, disease diagnostics, drug discovery and toxicological testing) , [B] type of metabolomics services (targeted metabolomics and untargeted metabolomics) , [C] type metabolome profiling techniques (LC-MS, GC-MS and NMR) , [D] type of end user (academic / research institutes, pharma / biotech firms, and CROs) and [E] key geographies (North America, Europe, Asia, Latin America, Middle East and North Africa and rest of the world).
Chapter 11 summarizes the overall report. In this chapter, we have provided a list of key takeaways from the report, and expressed our independent opinion related to the research and analysis described in the previous chapters.
Chapter 12 provides the transcripts of interviews conducted with several key stakeholders of this market. In this chapter, we have presented the details of our conversation with Olivier Schmitz (Head of Metabolome Data Science, BASF Metabolome Solutions) , Manoj Kumar (Indian Partner - Eroth Technologies, biocrates life sciences) , Bernhard Drotleff (Scientific Officer, European Molecular Biology Laboratory) , Morten Danielsen (Chief Executive Officer, MS-Omics) and Gilbert Skorski (Chairman and Chief Executive Officer, Phylogene) .
Chapter 13 is an appendix, which provides tabulated data and numbers for all the figures provided in the report.
Chapter 14 is an appendix, which contains the list of companies and organizations mentioned in the report.
TABLE OF CONTENTS
1. PREFACE
- 1.1. Scope of the Report
- 1.2. Research Methodology
- 1.3. Key Questions Answered
- 1.4. Chapter Outlines
2. EXECUTIVE SUMMARY
3. INTRODUCTION
- 3.1. Chapter Overview
- 3.2. Introduction to Metabolomics
- 3.3. Steps Involved in a Metabolomics Study
- 3.3.1. Experimental Design
- 3.3.2. Sample Preparation
- 3.3.3. Data Acquisition
- 3.3.4. Data Processing
- 3.3.5. Statistical Analysis
- 3.4. Approaches Used for Metabolomics Analysis
- 3.4.1. Targeted Metabolomics
- 3.4.2. Untargeted Metabolomics
- 3.4.3. Unknown Metabolite Identification
- 3.5. Applications of Metabolomics
- 3.6. Challenges Related to Metabolomics
- 3.7. Need for Outsourcing Metabolomics Operations
- 3.8. Concluding Remarks
4. MARKET LANDSCAPE
- 4.1. Chapter Overview
- 4.2. Metabolomics Service Providers: Overall Market Landscape
- 4.3. Metabolomics Service Providers: Industry Players
- 4.3.1. Analysis by Year of Establishment
- 4.3.2. Analysis by Company Size
- 4.3.3. Analysis by Location of Headquarters
- 4.3.4. Analysis by Type of Pre-Profiling Service(s) Offered
- 4.3.5. Analysis by Type of Metabolomic Service(s) Offered
- 4.3.6. Analysis by Type of Additional Service(s) Offered
- 4.3.7. Analysis by Type of Metabolome Profiling Technique Used
- 4.3.8. Analysis by Type of Approach Used for Data Analysis
- 4.3.9. Analysis by Type of Biological Sample Analyzed
- 4.3.10. Analysis by Source of Biological Sample
- 4.3.11. Analysis by Area of Application
- 4.4. Metabolomics Service Providers: Non-Industry Players
- 4.4.1. Analysis by Year of Establishment
- 4.4.2. Analysis by Organization Size
- 4.4.3. Analysis by Location of Headquarters
- 4.4.4. Analysis by Type of Pre-Profiling Service(s) Offered
- 4.4.5. Analysis by Type of Metabolomic Service(s) Offered
- 4.4.6. Analysis by Type of Additional Service(s) Offered
- 4.4.7. Analysis by Type of Metabolome Profiling Technique Used
- 4.4.8. Analysis by Type of Approach Used for Data Analysis
- 4.4.9. Analysis by Type of Biological Sample Analyzed
- 4.4.10. Analysis by Source of Biological Sample
- 4.4.11. Analysis by Area of Application
5. KEY INSIGHTS
- 5.1. Chapter Overview
- 5.2. Analysis by Location of Headquarters and Type of Service Provider (Waffle Chart and World Map Representation)
- 5.3. Analysis by Company / Organization Size and Type of Service Provider (Horizontally Stacked Bar Chart)
- 5.4. Analysis by Area of Application and Company / Organization Size (Mekko Chart)
- 5.5. Analysis by Type of Metabolome Profiling Technique Used and Type of Biological Sample Analyzed (Vertically Stacked Bar Chart)
- 5.6. Analysis by Type of Metabolome Profiling Technique Used and Area of Application (Treemap Representation)
- 5.7. Analysis by Year of Establishment, Company / Organization Size, Number of Metabolomics Service(s) Offered and Region (4D Bubble Chart)
- 5.8. Analysis by Company / Organization Size, Region, Type of Metabolomics Service(s) Offered, Type of Metabolome Profiling Technique Used and Area of Application (Grid Representation)
6. COMPANY COMPETITIVENESS
- 6.1. Chapter Overview
- 6.2. Key Assumptions and Parameters
- 6.3. Methodology
- 6.3.1. Company Competitiveness Analysis: Very Small Companies
- 6.3.2. Company Competitiveness Analysis: Small Companies
- 6.3.3. Company Competitiveness Analysis: Mid-Sized Companies
- 6.3.4. Company Competitiveness Analysis: Large and Very Large Companies
7. COMPANY PROFILES
- 7.1. Chapter Overview
- 7.2. biocrates life sciences
- 7.2.1. Company Overview
- 7.2.2. Recent Developments and Future Outlook
- 7.3. Creative Proteomics
- 7.3.1. Company Overview
- 7.3.2. Recent Developments and Future Outlook
- 7.4. DNA Xperts
- 7.4.1. Company Overview
- 7.4.2. Recent Developments and Future Outlook
- 7.5. Eremid Research Services
- 7.5.1. Company Overview
- 7.5.2. Recent Developments and Future Outlook
- 7.6. Human Metabolome Technologies (HMT)
- 7.6.1. Company Overview
- 7.6.2. Recent Developments and Future Outlook
- 7.7. Metabo Profile
- 7.7.1. Company Overview
- 7.7.2. Recent Developments and Future Outlook
- 7.8. Metabolon
- 7.8.1. Company Overview
- 7.8.2. Recent Developments and Future Outlook
- 7.9. MS-Omics
- 7.9.1. Company Overview
- 7.9.2. Recent Developments and Future Outlook
- 7.10. Novelgene Technologies
- 7.10.1. Company Overview
- 7.10.2. Recent Developments and Future Outlook
- 7.11. Synbio Technologies
- 7.11.1. Company Overview
- 7.11.2. Recent Developments and Future Outlook
8. PARTNERSHIPS AND COLLABORATIONS
- 8.1. Chapter Overview
- 8.2. Partnership Models
- 8.3. Metabolomics Service Providers: Partnerships and Collaborations
- 8.3.1. Analysis by Year of Partnership
- 8.3.2. Analysis by Type of Partnership
- 8.3.2.1 Analysis by Year and Type of Partnership
- 8.3.2.2 Analysis by Type of Partnership and Company Size
- 8.3.3. Analysis by Type of Partner
- 8.3.4. Analysis by Type of Metabolomics Service(s) Offered
- 8.3.5. Analysis by Type of Metabolome Profiling Technique Used
- 8.3.6. Analysis by Area of Application
- 8.3.7. Most Active Players: Analysis by Number of Partnerships
- 8.3.8. Regional Analysis
- 8.3.8.1 Local and International Deals
- 8.3.8.2 Intercontinental and Intracontinental Deals
- 8.3.8.3 Analysis by Location of Headquarters of Partner
- 8.3.8.4 Analysis by Type of Partnership and Location of Headquarters of Partner
9. VALUE CREATION FRAMEWORK: A STRATEGIC GUIDE TO ADDRESS UNMET NEED IN METABOLOMICS
- 9.1. Chapter Overview
- 9.2. Unmet Need in Metabolomics
- 9.3. Sensitivity and Selectivity: Key Tools and Technologies
- 9.3.1. Key Assumptions and Methodology
- 9.3.2. Dynamic Nuclear Polarization (DNP)
- 9.3.3. Technology B
- 9.3.4. Technology C
- 9.3.5 Results and Discussion
- 9.4. Data Processing: Key Tools and Technologies
- 9.4.1. Key Assumptions and Methodology
- 9.4.2. Artificial Intelligence
- 9.4.3. Technology E
- 9.4.4. Technology F
- 9.4.5. Technology I
- 9.4.6. Technology J
- 9.4.7. Technology K
- 9.4.8. Quantum Computing
- 9.4.9. Trends in Research Activity
- 9.4.10. Trends in Intellectual Capital
- 9.4.11. Results and Discussion
10. MARKET FORECAST
- 10.1. Chapter Overview
- 10.2. Forecast Methodology and Key Assumptions
- 10.3. Metabolomics Services Market, 2022-2035
- 10.4. Metabolomics Services Market: Analysis by Area of Application, 2022 and 2035
- 10.4.1. Metabolomics Services Market for Biomarker Discovery, 2022- 2035
- 10.4.2. Metabolomics Services Market for Personalized Medicine, 2022-2035
- 10.4.3. Metabolomics Services Market for Drug Discovery, 2022-2035
- 10.4.4. Metabolomics Services Market for Disease Diagnostics, 2022- 2035
- 10.4.5. Metabolomics Services Market for Toxicological Testing, 2022-2035
- 10.5. Metabolomics Services Market: Analysis by Type of Metabolomics Service Offered, 2022 and 2035
- 10.5.1. Metabolomics Services Market for Targeted Metabolomics, 2022-2035
- 10.5.2. Metabolomics Services Market for Untargeted Metabolomics, 2022-2035
- 10.6. Metabolomics Services Market: Analysis by Type of Metabolome Profiling Technique Used, 2022 and 2035
- 10.6.1. Metabolomics Services Market for LC-MS Technique, 2022-2035
- 10.6.2. Metabolomics Services Market for GC-MS Technique, 2022-2035
- 10.6.3. Metabolomics Services Market for NMR Technique, 2022-2035
- 10.7. Metabolomics Services Market: Analysis by Type of End User, 2022 and 2035
- 10.7.1. Metabolomics Services Market for Academic / Research Institutes, 2022-2035
- 10.7.2. Metabolomics Services Market for Pharma / Biotech Companies, 2022-2035
- 10.7.3. Metabolomics Services Market for Contract Research Organizations (CROs), 2022-2035
- 10.8. Metabolomics Services Market: Analysis by Key Geographical Regions, 2022 and 2035
- 10.8.1. Metabolomics Services Market in North America, 2022-2035
- 10.8.2. Metabolomics Services Market in Europe, 2022-2035
- 10.8.3. Metabolomics Services Market in Asia, 2022-2035
- 10.8.4. Metabolomics Services Market in Latin America, 2022-2035
- 10.8.5. Metabolomics Services Market in Middle East and North Africa (MENA), 2022-2035
- 10.8.6. Metabolomics Services Market in Rest of the World, 2022-2035
- 10.9. Concluding Remarks
11. CONCLUSION
12. EXECUTIVE INSIGHTS
- 12.1. Chapter Overview
- 12.2. BASF Metabolome Solutions
- 12.2.1. Company Snapshot
- 12.2.2. Interview Transcript: Olivier Schmitz, Head of Metabolome Data Science
- 12.3. biocrates life sciences
- 12.3.1. Company Snapshot
- 12.3.2. Interview Transcript: Manoj, Indian Partner (Eroth Technologies)
- 12.4 European Molecular Biology Laboratory (EMBL)
- 12.4.1. Company Snapshot
- 12.4.1. Interview Transcript: Bernhard Drotleff, Scientific Officer
- 12.5. MS-Omics
- 12.5.1. Company Snapshot
- 12.5.2. Interview Transcript: Morten Danielsen, Chief Executive Officer
- 12.6. Phylogene
- 12.6.1. Company Snapshot
- 12.6.2. Interview Transcript: Gilbert Skorski, Chairman and Chief Executive Officer
13. APPENDIX I: TABULATED DATA
14. APPENDIX II: LIST OF COMPANIES AND ORGANIZATIONS
List Of Figures
- Figure 2.1 Executive Summary: Overall Market Landscape
- Figure 2.2 Executive Summary: Partnerships and Collaborations
- Figure 2.3 Executive Summary: Market Forecast
- Figure 3.1 Steps Involved in a Metabolomics Study
- Figure 3.2 Comparison between Mass Spectrometry and Nuclear Magnetic Resonance
- Figure 3.3 Applications of Metabolomics
- Figure 3.4 Challenges Related to Metabolomics
- Figure 4.1 Metabolomics Service Providers: Distribution by Type of Service Provider
- Figure 4.2 Metabolomics Service Providers (Industry Players): Distribution by Year of Establishment
- Figure 4.3 Metabolomics Service Providers (Industry Players): Distribution by Company Size
- Figure 4.4 Metabolomics Service Providers (Industry Players): Distribution by Location of Headquarters
- Figure 4.5 Metabolomics Service Providers (Industry Players): Distribution by Company Size and Location of Headquarters
- Figure 4.6 Metabolomics Service Providers (Industry Players): Distribution by Type of Pre-Profiling Service(s) Offered
- Figure 4.7 Metabolomics Service Providers (Industry Players): Distribution by Type of Metabolomics Service(s) Offered
- Figure 4.8 Metabolomics Service Providers (Industry Players): Distribution by Type of Additional Service(s) Offered
- Figure 4.9 Metabolomics Service Providers (Industry Players): Distribution by Type Detection Technique Used
- Figure 4.10 Metabolomics Service Providers (Industry Players): Distribution by Type of Separation Technique
- Figure 4.11 Metabolomics Service Providers (Industry Players): Distribution by Type of Approach Used for Data Analysis
- Figure 4.12 Metabolomics Service Providers (Industry Players): Distribution by Type of Biological Sample Analyzed
- Figure 4.13 Metabolomics Service Providers (Industry Players): Distribution by Source of Biological Sample
- Figure 4.14 Metabolomics Service Providers (Industry Players): Distribution by Area of Application
- Figure 4.15 Metabolomics Service Providers (Non-Industry Players): Distribution by Year of Establishment
- Figure 4.16 Metabolomics Service Providers (Non-Industry Players): Distribution by Organization Size
- Figure 4.17 Metabolomics Service Providers (Non-Industry Players): Distribution by Location of Headquarters
- Figure 4.18 Metabolomics Service Providers (Non-Industry Players): Distribution by Organization Size and Location of Headquarters
- Figure 4.19 Metabolomics Service Providers (Non-Industry Players): Distribution by Type of Pre-Profiling Service(s) Offered
- Figure 4.20 Metabolomics Service Providers (Non-Industry Players): Distribution by Type of Metabolomics Service(s) Offered
- Figure 4.21 Metabolomics Service Providers (Non-Industry Players): Distribution by Type of Additional Service(s) Offered
- Figure 4.22 Metabolomics Service Providers (Non-Industry Players): Distribution by Type of Detection Technique Used
- Figure 4.23 Metabolomics Service Providers (Non-Industry Players): Distribution by Type of Separation Technique Used
- Figure 4.24 Metabolomics Service Providers (Non-Industry Players): Distribution by Type of Approach Used for Data Analysis
- Figure 4.25 Metabolomics Service Providers (Non-Industry Players): Distribution by Type of Biological Sample Analyzed
- Figure 4.26 Metabolomics Service Providers (Non-Industry Players): Distribution by Source of Biological Sample
- Figure 4.27 Metabolomics Service Providers (Non-Industry Players): Distribution by Area of Application
- Figure 5.1 Key Insights: Distribution by Location of Headquarters (Region-wise) and Type of Service Provider
- Figure 5.2 Key Insights: Distribution of Industry Players by Location of Headquarters (Country-wise)
- Figure 5.3 Key Insights: Distribution of Non-Industry Players by Location of Headquarters (Country-wise)
- Figure 5.4 Key Insights: Distribution by Company / Organization Size and Type of Service Provider
- Figure 5.5 Key Insights: Distribution by Area of Application and Company / Organization Size
- Figure 5.6 Key Insights: Distribution by Type of Metabolome Profiling Technique Used and Type of Biological Sample Analyzed
- Figure 5.7 Key Insights: Distribution by Type of Metabolome Profiling Technique and Area of Application
- Figure 5.8 Key Insights: Distribution by Year of Establishment, Company / Organization Size, Number of Metabolomics Service(s) Offered and Region
- Figure 5.9 Key Insights: Distribution by Company / Organization Size, Region, Type of Metabolomic Service(s) Offered, Type of Metabolome Profiling Technique Used and Area of Application
- Figure 6.1 Company Competitiveness Analysis: Benchmarking of Service Strength
- Figure 6.2 Company Competitiveness Analysis: Benchmarking of Partnership Activity
- Figure 6.3 Company Competitiveness Analysis: Very Small Companies
- Figure 6.4 Company Competitiveness Analysis: Small Companies
- Figure 6.5 Company Competitiveness Analysis: Mid-sized Companies
- Figure 6.6 Company Competitiveness Analysis: Large and Very Large Companies
- Figure 8.1 Partnerships and Collaborations: Cumulative Year-wise Trend, 2014-2022
- Figure 8.2 Partnerships and Collaborations: Distribution by Type of Partnership
- Figure 8.3 Partnerships and Collaborations: Distribution by Year and Type of Partnership
- Figure 8.4 Partnerships and Collaborations: Distribution by Type of Partnership and Company Size
- Figure 8.5 Partnerships and Collaborations: Distribution by Type of Partner
- Figure 8.6 Partnerships and Collaborations: Distribution by Type of Metabolomic Service(s) Offered
- Figure 8.7 Partnerships and Collaborations: Distribution by Type of Metabolome Profiling Technique Used
- Figure 8.8 Partnerships and Collaborations: Distribution by Area of Application
- Figure 8.9 Partnerships and Collaborations: Distribution by Type of Partnership and Area of Application
- Figure 8.10 Partnerships and Collaborations: Distribution by Type of Metabolomics Service(s) Offered, Type of Metabolome Profiling Technique Used and Area of Application
- Figure 8.11 Most Active Players: Distribution by Number of Partnerships
- Figure 8.12 Partnerships and Collaborations: Local and International Agreements
- Figure 8.13 Partnerships and Collaborations: Intercontinental and Intracontinental Deals
- Figure 8.14 Partnerships and Collaborations: Distribution by Location of Headquarters of Partner (Country-wise)
- Figure 8.15 Partnerships and Collaborations: Distribution by Type of Partnership and Location of Headquarters of Partner
- Figure 9.1 Value Creation Framework: Likely Sensitivity Enhancement by Implementation of Key Tools and Technologies
- Figure 9.2 Value Creation Framework: Comparison of Key Tools / Technologies
- Figure 9.3 Value Creation Framework: Trends in Intellectual Property related to Integration of Key Tools and Technologies with Metabolomics
- Figure 9.4 Value Creation Framework: Trends in Research Activity related to Integration of Key Tools and Technologies with Metabolomics
- Figure 9.5 Value Creation Framework: Extent of Innovation versus Associated Risk Matrix
- Figure 10.1 Global Metabolomics Services Market, 2022-2035 (USD Million)
- Figure 10.2 Metabolomics Services Market: Distribution by Area of Application, 2022 and 2035
- Figure 10.3 Metabolomics Services Market for Biomarker Discovery, 2022-2035 (USD Million)
- Figure 10.4 Metabolomics Services Market for Personalized Medicine, 2022-2035 (USD Million)
- Figure 10.5 Metabolomics Services Market for Disease Diagnostics, 2022-2035 (USD Million)
- Figure 10.6 Metabolomics Services Market for Drug Discovery, 2022-2035 (USD Million)
- Figure 10.7 Metabolomics Services Market for Toxicological Testing, 2022-2035 (USD Million)
- Figure 10.8 Metabolomics Services Market: Distribution by Type of Metabolomics Service(s) Offered 2022 and 2035
- Figure 10.9 Metabolomics Services Market for Targeted Metabolomics, 2022-2035 (USD Million)
- Figure 10.10 Metabolomics Services Market for Untargeted Metabolomics, 2022-2035 (USD Million)
- Figure 10.11 Metabolomics Services Market: Distribution by Type of Metabolome Profiling Technique Used, 2022 and 2035
- Figure 10.12 Metabolomics Services Market for LC-MS Technique, 2022-2035 (USD Million)
- Figure 10.13 Metabolomics Services Market for GC-MS Technique, 2022-2035 (USD Million)
- Figure 10.14 Metabolomics Services Market for NMR Technique, 2022-2035 (USD Million)
- Figure 10.15 Metabolomics Services Market: Distribution by Type of End User, 2022 and 2035
- Figure 10.16 Metabolomics Services Market for Academic / Research Institutes, 2022-2035 (USD Million)
- Figure 10.17 Metabolomics Services Market for Pharma / Biotech Companies, 2022-2035 (USD Million)
- Figure 10.18 Metabolomics Services Market for Contract Research Organizations (CROs), 2022-2035 (USD Million)
- Figure 10.19 Metabolomics Services Market: Distribution by Key Geographical Regions, 2022 and 2035 (USD Million)
- Figure 10.20 Metabolomics Services Market in North America, 2022-2035 (USD Million)
- Figure 10.21 Metabolomics Services Market in Europe, 2022-2035 (USD Million)
- Figure 10.22 Metabolomics Services Market in Asia, 2022-2035 (USD Million)
- Figure 10.23 Metabolomics Services Market in Latin America, 2022-2035 (USD Million)
- Figure 10.24 Metabolomics Services Market in Middle East and North Africa (MENA), 2022-2035 (USD Million)
- Figure 10.25 Metabolomics Services Market in Rest of the World, 2022-2035 (USD Million)
- Figure 10.26 Metabolomics Services Market: Conservative, Base and Optimistic Scenarios, 2022, 2027 and 2035 (USD Million)
- Figure 11.1 Concluding Remarks: Current Market Landscape
- Figure 11.2 Concluding Remarks: Partnerships and Collaborations
- Figure 11.3 Concluding Remarks: Value Creation Framework
- Figure 11.4 Concluding Remarks: Market Forecast
List Of Tables
- Table 4.1 Metabolomics Service Providers: List of Players
- Table 4.2 Metabolomics Service Providers: List of Industry Players
- Table 4.3 Metabolomics Service Providers (Industry Players): Information on Type of Pre-Profiling Service(s) Offered
- Table 4.4 Metabolomics Service Providers (Industry Players): Information on Type of Metabolomic Service(s) Offered
- Table 4.5 Metabolomics Service Providers (Industry Players): Information on Type of Additional Service(s) Offered
- Table 4.6 Metabolomics Service Providers (Industry Players): Information on Type of Metabolome Profiling Technique Used
- Table 4.7 Metabolomics Service Providers (Industry Players): Information on Type of Approach Used for Data Analysis
- Table 4.8 Metabolomics Service Providers (Industry Players): Information on Type of Biological Sample Analyzed
- Table 4.9 Metabolomics Service Providers (Industry Players): Information on Source of Biological Sample
- Table 4.10 Metabolomics Service Providers (Industry Players): Information on Area of Application
- Table 4.11 Metabolomics Service Providers: List of Non-Industry Players
- Table 4.12 Metabolomics Service Providers (Non-Industry Players): Information on Type of Pre-Profiling Service(s) Offered
- Table 4.13 Metabolomics Service Providers (Non-Industry Players): Information on Type of Metabolomic Service(s) Offered
- Table 4.14 Metabolomics Service Providers (Non-Industry Players): Information on Type of Additional Service(s) Offered
- Table 4.15 Metabolomics Service Providers (Non-Industry Players): Information on Type of Metabolome Profiling Technique Used
- Table 4.16 Metabolomics Service Providers (Non-Industry Players): Information on Type of Approach Used for Data Analysis
- Table 4.17 Metabolomics Service Providers (Non-Industry Players): Information on Type of Biological Sample Analyzed
- Table 4.18 Metabolomics Service Providers (Non-Industry Players): Information on Source of Biological Sample
- Table 4.19 Metabolomics Service Providers (Non-Industry Players): Information on Area of Application
- Table 6.1 Company Competitiveness Analysis: Benchmarking of Service Strength
- Table 6.2 Company Competitiveness Analysis: Benchmarking of Partnership Activity
- Table 6.3 Company Competitiveness Analysis: List of Very Small Players
- Table 6.4 Company Competitiveness Analysis: List of Small Players
- Table 6.5 Company Competitiveness Analysis: List of Mid-sized Players
- Table 6.6 Company Competitiveness Analysis: List of Large and Very Large Players
- Table 7.1 Metabolomics Service Providers: List of Companies Profiled
- Table 7.2 biocrates life sciences: Company Overview
- Table 7.3 biocrates life sciences: Recent Developments and Future Outlook
- Table 7.4 Creative Proteomics: Company Overview
- Table 7.5 DNA Xperts: Company Overview
- Table 7.6 Eremid Research Services: Company Overview
- Table 7.7 Eremid Research Services: Recent Developments and Future Outlook
- Table 7.8 Human Metabolome Technologies (HMT): Company Overview
- Table 7.9 Human Metabolome Technologies (HMT): Recent Developments and Future Outlook
- Table 7.10 Metabo Profile: Company Overview
- Table 7.11 Metabo Profile: Recent Developments and Future Outlook
- Table 7.12 Metabolon: Company Overview
- Table 7.13 Metabolon: Recent Developments and Future Outlook
- Table 7.14 MS-Omics: Company Overview
- Table 7.15 MS-Omics: Recent Developments and Future Outlook
- Table 7.16 Novelgene Technologies: Company Overview
- Table 7.17 Synbio Technologies: Company Overview
- Table 7.18 Synbio Technologies: Recent Developments and Future Outlook
- Table 8.1 Partnerships and Collaborations: Information on Year of Agreement, Type of Partnership and Type of Partner, 2014-2022
- Table 8.2 Partnerships and Collaborations: Information on Type of Agreement (Local / International and Intercontinental / Intracontinental), 2014-2022
- Table 12.1 BASF Metabolome Solutions: Company Snapshot
- Table 12.2 biocrates life sciences: Company Snapshot
- Table 12.3 European Molecular Biology Laboratory (EMBL): Company Snapshot
- Table 12.4 MS-Omics: Company Snapshot
- Table 12.5 Phylogene: Company Snapshot
- Table 13.1 Metabolomic Service Providers: Distribution by Type of Service Provider
- Table 13.2 Metabolomics Service Providers (Industry Players): Distribution by Year of Establishment
- Table 13.3 Metabolomics Service Providers (Industry Players): Distribution by Company Size
- Table 13.4 Metabolomics Service Providers (Industry Players): Distribution by Location of Headquarters
- Table 13.5 Metabolomics Service Providers (Industry Players): Distribution by Company Size and Location of Headquarters
- Table 13.6 Metabolomics Service Providers (Industry Players): Distribution by Type of Pre-Profiling Service(s) Offered
- Table 13.7 Metabolomics Service Providers (Industry Players): Distribution by Type of Metabolomic Service(s) Offered
- Table 13.8 Metabolomics Service Providers (Industry Players): Distribution by Type of Additional Service(s) Offered
- Table 13.9 Metabolomics Service Providers (Industry Players): Distribution by Type Detection Technique Used
- Table 13.10 Metabolomics Service Providers (Industry Players): Distribution by Type Separation Technique Used
- Table 13.11 Metabolomics Service Providers (Industry Players): Distribution by Type of Approach used for Data Analysis
- Table 13.12 Metabolomics Service Providers (Industry Players): Distribution by Type of Biological Sample Analyzed
- Table 13.13 Metabolomics Service Providers (Industry Players): Distribution by Source of Biological Sample
- Table 13.14 Metabolomics Service Providers (Industry Players): Distribution by Area of Application
- Table 13.15 Metabolomics Service Providers (Non-Industry Players): Distribution by Year of Establishment
- Table 13.16 Metabolomics Service Providers (Non-Industry Players): Distribution by Organization Size
- Table 13.17 Metabolomics Service Providers (Non-Industry Players): Distribution by Location of Headquarters
- Table 13.18 Metabolomics Service Providers (Non-Industry Players): Distribution by Organization Size and Location of Headquarters
- Table 13.19 Metabolomics Service Providers (Non-Industry Players): Distribution by Type of Pre-Profiling Service(s) Offered
- Table 13.20 Metabolomics Service Providers (Non-Industry Players): Distribution by Metabolomics Service(s) Offered
- Table 13.21 Metabolomics Service Providers (Non-Industry Players): Distribution by Additional Service(s) Offered
- Table 13.22 Metabolomics Service Providers (Non-Industry Players): Distribution by Type of Detection Technique Used
- Table 13.23 Metabolomics Service Providers (Non-Industry Players): Distribution by Type of Detection Technique Used
- Table 13.24 Metabolomics Service Providers (Non-Industry Players): Distribution by Type of Approach used for Data Analysis
- Table 13.25 Metabolomics Service Providers (Non-Industry Players): Distribution by Type of Biological Sample Analyzed
- Table 13.26 Metabolomics Service Providers (Non-Industry Players): Distribution by Source of Biological Sample
- Table 13.27 Metabolomics Service Providers (Non-Industry Players): Distribution by Area of Application
- Table 13.28 Key Insights: Distribution by Location of Headquarters (Region-wise) and Type of Service Provider
- Table 13.29 Key Insights: Distribution of Industry Players by Location of Headquarters (Country-wise)
- Table 13.30 Key Insights: Distribution of Non-Industry Players by Location of Headquarters (Country-wise)
- Table 13.31 Key Insights: Distribution by Company / Organization Size and Type of Service Provider
- Table 13.32 Key Insights: Distribution by Area of Application and Company / Organization Size
- Table 13.33 Key Insights: Distribution by Type of Metabolome Profiling Technique Used and Type of Biological Sample Analyzed
- Table 13.34 Key Insights: Distribution by Type of Metabolome Profiling Technique and Area of Application
- Table 13.35 Company Competitiveness Analysis: Benchmarking of Services Strength
- Table 13.36 Company Competitiveness Analysis: Benchmarking of Partnership Activity
- Table 13.37 Partnerships and Collaborations: Cumulative Year-wise Trend, 2014-2022
- Table 13.38 Partnerships and Collaborations: Distribution by Type of Partnership
- Table 13.39 Partnerships and Collaborations: Distribution by Year and Type of Partnership
- Table 13.40 Partnerships and Collaborations: Distribution by Type of Partnership and Company Size
- Table 13.41 Partnerships and Collaborations: Distribution by Type of Partner
- Table 13.42 Partnerships and Collaborations: Distribution by Type of Metabolomics Service(s) Offered
- Table 13.43 Partnerships and Collaborations: Distribution by Type of Metabolome Profiling Technique Used
- Table 13.44 Partnerships and Collaborations: Distribution by Area of Application
- Table 13.45 Partnerships and Collaborations: Distribution by Type of Partnership and Area of Application
- Table 13.46 Most Active Players: Distribution by Number of Partnerships
- Table 13.47 Partnerships and Collaborations: Local and International Agreements
- Table 13.48 Partnerships and Collaborations: Intercontinental and Intracontinental Deals
- Table 13.49 Partnerships and Collaborations: Distribution by Location of Headquarters of Partner (Country-wise)
- Table 13.50 Partnerships and Collaborations: Distribution by Type of Partnership and Location of Headquarters of Partner
- Table 13.51 Value Creation Framework: Distribution by Relative Sensitivity and Key Tools and Technologies
- Table 13.52 Trends in Intellectual Property related to Integration of Key Tools and Technologies with Metabolomics
- Table 13.53 Value Creation Framework: Extent of Innovation versus Associated Risk Analysis
- Table 13.54 Value Creation Framework: Implementation of Key Tools / Technologies
- Table 13.55 Metabolomics Services Market, 2022-2035 (USD Million)
- Table 13.56 Metabolomics Services Market: Distribution by Area of Application, 2022 and 2035
- Table 13.57 Metabolomics Services Market for Biomarker Discovery, Conservative, Base and Optimistic Scenarios, 2022-2035 (USD Million)
- Table 13.58 Metabolomics Services Market for Personalized Medicine, Conservative, Base and Optimistic Scenarios, 2022-2035 (USD Million)
- Table 13.59 Metabolomics Services Market for Disease Diagnostics, Conservative, Base and Optimistic Scenarios, 2022-2035 (USD Million)
- Table 13.60 Metabolomics Services Market for Drug Discovery, Conservative, Base and Optimistic Scenarios, 2022-2035 (USD Million)
- Table 13.61 Metabolomics Services Market for Toxicological Testing, Conservative, Base and Optimistic Scenarios, 2022-2035 (USD Million)
- Table 13.62 Metabolomics Services Market: Distribution by Type of Metabolomics Service(s) Offered, 2022 and 2035
- Table 13.63 Metabolomics Services Market for Targeted Metabolomics, Conservative, Base and Optimistic Scenarios, 2022-2035 (USD Million)
- Table 13.64 Metabolomics Services Market for Untargeted Metabolomics, Conservative, Base and Optimistic Scenarios, 2022-2035 (USD Million)
- Table 13.65 Metabolomics Services Market: Distribution by Type of Metabolome Profiling Technique Used, 2022 and 2035
- Table 13.66 Metabolomics Services Market for LC-MS Technique, Conservative, Base and Optimistic Scenarios, 2022-2035 (USD Million)
- Table 13.67 Metabolomics Services Market for GC-MS Technique, Conservative, Base and Optimistic Scenarios, 2022-2035 (USD Million)
- Table 13.68 Metabolomics Services Market for NMR Technique, Conservative, Base and Optimistic Scenarios, 2022-2035 (USD Million)
- Table 13.69 Metabolomics Services Market: Distribution by Type of End User, 2022 and 2035
- Table 13.70 Metabolomics Services Market for Academic / Research Institutes, Conservative, Base and Optimistic Scenarios, 2022-2035 (USD Million)
- Table 13.71 Metabolomics Services Market for Pharma / Biotech Companies, Conservative, Base and Optimistic Scenarios, 2022-2035 (USD Million)
- Table 13.72 Metabolomics Services Market for Contract Research Organizations (CROs), Conservative, Base and Optimistic Scenarios, 2022-2035 (USD Million)
- Table 13.73 Metabolomics Services Market: Distribution by Key Geographical Regions, 2022 and 2035 (USD Million)
- Table 13.74 Metabolomics Services Market in North America, Conservative, Base and Optimistic Scenarios, 2022-2035 (USD Million)
- Table 13.75 Metabolomics Services Market in Europe, Conservative, Base and Optimistic Scenarios, 2022-2035 (USD Million)
- Table 13.76 Metabolomics Services Market in Asia, Conservative, Base and Optimistic Scenarios, 2022-2035 (USD Million)
- Table 13.77 Metabolomics Services Market in Latin America, Conservative, Base and Optimistic Scenarios, 2022-2035 (USD Million)
- Table 13.78 Metabolomics Services Market in Middle East and North Africa (MENA), Conservative, Base and Optimistic Scenarios, 2022-2035 (USD Million)
- Table 13.79 Metabolomics Services Market in Rest of the World, Conservative, Base and Optimistic Scenarios, 2022-2035 (USD Million)
- Table 13.80 Metabolomics Services Market: Conservative, Base and Optimistic Scenarios, 2022, 2027 and 2035 (USD Million)
List Of Companies
The following companies / institutes / government bodies and organizations have been mentioned in this report.
- 1. 1st BASE
- 2. Abramson Cancer Center, Penn Medicine
- 3. Absorption Systems (acquired by Pharmaron)
- 4. Afekta Technologies
- 5. Agilent Technologies
- 6. Albert Einstein College of Medicine
- 7. Analytica Laboratories
- 8. AnGes
- 9. Anti-Doping Laboratory Qatar
- 10. ARC-BIO, Colorado State University
- 11. Arome Science
- 12. AstraZeneca
- 13. Augusta University
- 14. Australian Institute for Bioengineering and Nanotechnology (AIBN)
- 15. Axon Scientific
- 16. AXYS Analytical Services
- 17. AYOXXA
- 18. Barc Lab
- 19. BASF Metabolome Solutions
- 20. Bayer
- 21. Baylor College of Medicine
- 22. BERG
- 23. Beth Israel Deaconess Medical Center
- 24. Beth Israel Deaconess Medical Center (BIDMC)
- 25. BGI Genomics
- 26. biocrates life sciences
- 27. Biomedical Research Core Facilities, University of Michigan
- 28. Biosfer Teslab
- 29. Biotechnology and Biomedicine Centre of the Academy of Sciences and Charles
- 30. BioXenClue
- 31. BioZone
- 32. Boehringer Ingelheim
- 33. Boston University
- 34. BPS Bioscience
- 35. Brigham and Women's Hospital
- 36. Bristol Myers Squibb
- 37. CD BioSciences
- 38. CECAD, University of Cologne
- 39. Cedars-Sinai
- 40. Center for Iron and Hematology Disorders, University of Utah
- 41. Centre for Cellular and Molecular Platforms (C-CAMP)
- 42. Centre for Omic Sciences (COS)
- 43. Centre for Organismal Studies, Heidelberg University
- 44. Chalmers University of Technology
- 45. Champions Oncology
- 46. Chenomx
- 47. Children's Hospital of Philadelphia
- 48. CHUM Research Center
- 49. CIC bioGUNE Basque Research and Technology Alliance
- 50. Cincinnati Children's Hospital Medical Center
- 51. Clarus Analytical
- 52. Cleveland Clinic Lerner Research Institute
- 53. Cornell Institute of Biotechnology (CIB)
- 54. Creative Bioarray
- 55. Creative Biogene
- 56. Creative Proteomics
- 57. Cytomics
- 58. Dana Faber Cancer Insitute
- 59. Department of Chemistry, University of Oxford
- 60. Diabetes Research Center, Washington University School of Medicine in St. Louis
- 61. DNA Genotek
- 62. DNA Xperts
- 63. Duke Center for Genomic and Computational Biology (GCB)
- 64. Duke-NUS Medical School
- 65. Eremid Research Services
- 66. European Molecular Biology Laboratory (EMBL)
- 67. Evotec
- 68. Faculty of Biology, Ludwig-Maximilians-Universität München
- 69. Firalis
- 70. Fraunhofer ITEM
- 71. Fred Hutchinson Cancer Research Center
- 72. Frontage Laboratories
- 73. Functional Genomics Center Zurich (FGCZ)
- 74. Fundación MEDINA
- 75. Gemini Biosciences
- 76. General Metabolics
- 77. Georgetown Lombardi Comprehensive Cancer Center
- 78. Germans Trias i Pujol Research Institute (IGTP)
- 79. Gillings School of Global Public Health
- 80. Giotto Biotech
- 81. GlaxoSmithKline
- 82. Helmholtz Zentrum München
- 83. HRL Holdings
- 84. HTG Molecular Diagnostics
- 85. Human Longevity
- 86. Human Metabolome Technologies (HMT)
- 87. Humboldt Universität zu Berlin
- 88. Immuron
- 89. Impulse Dynamics
- 90. Indiana Clinical and Translational Sciences Institute (CTSI)
- 91. Inivata
- 92. Institut Pasteur
- 93. Ion Source & Biotechnologies (ISB)
- 94. IRBM
- 95. Irving Institute for Clinical and Translational Research
- 96. ITSI-BIOSCIENCES
- 97. James Hutton Institute
- 98. John Innes Centre
- 99. JUNO Metabolomics
- 100. J-VPD
- 101. Karolinska Institutet
- 102. Leiden University Medical Center
- 103. Li Ka Shing Faculty of Medicine, The University of Hong Kong (HKUMed)
- 104. Lifeasible
- 105. Liquidia Corporation
- 106. M. J. Murdock Metabolomics Laboratory, Washington State University
- 107. Maastricht UMC+
- 108. MachPhy Solutions
- 109. Max Delbrück Center for Molecular Medicine
- 110. Max Planck Institute for Biology of Ageing
- 111. Max Planck Institute for Molecular Genetics (MPI-MG)
- 112. Max Planck Institute for Terrestrial Microbiology
- 113. Max Planck Institute of Immunobiology and Epigenetics
- 114. Mayo Clinic
- 115. MD Anderson Cancer Center
- 116. Medicilon
- 117. Merck
- 118. MetaboHUB
- 119. Metabolite Profiling Core Facility, Whitehead Institute
- 120. Metabolomics Core, North Carolina Diabetes Research Center
- 121. Metabolon
- 122. Metabolytica
- 123. Metabo-Profile
- 124. Metanomics Health
- 125. metaSysX
- 126. Metdia Biotech
- 127. Monash University
- 128. Montreal Heart Institute
- 129. MRC Cancer Unit, University of Cambridge
- 130. MS-Omics
- 131. MtoZ Biolabs
- 132. MTT Lab
- 133. Muses Labs
- 134. MYOS Corporation
- 135. National Biomedical Resource Indigenisation Consortium (NBRIC)
- 136. National Insitute of Allergy and Infectious Diseases
- 137. National Institute on Aging
- 138. Nebraska Center for Biotechnology, University of Nebraska-Lincoln
- 139. Next Trillion Sciences
- 140. North Carolina Biotechnology Center (NCBiotech)
- 141. North Carolina Research Campus (NCRC)
- 142. North Carolina State University
- 143. Northwest Metabolomics Research Cente (NW-MRC)
- 144. North-West University (NWU)
- 145. Northwestern University
- 146. Novelgene Technologies
- 147. Novo Nordisk
- 148. numares
- 149. NuSirt Biopharma
- 150. NYU Langone Health
- 151. OmicsGen LifeSciences
- 152. Oncology Institute of Southern Catalonia
- 153. Osaka University
- 154. Ospedale San Raffaele
- 155. OWL
- 156. Pacific Biosciences
- 157. Parker H
- 158. Perlman School of Medicine, University of Pennsylvania
- 159. Pharmacogenomics Laboratory, Université Laval
- 160. Pharmalegacy Laboratories
- 161. Pharmaron
- 162. PhenoSwitch Bioscience
- 163. Philippine Genome Center (PGC)
- 164. Philips
- 165. Phylogene
- 166. PROMETHEUS METABOLOMICS
- 167. ProSciento
- 168. Proteome Factory
- 169. Quintara Discovery (QDI)
- 170. Redox Biology Centre (RBC), University of Nebraska-Lincoln
- 171. Rosalind and Morris Goodman Cancer Institute, McGill University
- 172. Roy J
- 173. RTI International
- 174. Rubio Laboratorios
- 175. Ruiyi Biotechnology
- 176. Rutgers Cancer Institute
- 177. Sagimet Biosciences
- 178. Sandor Speciality Diagnostics
- 179. Sanyal Biotechnology
- 180. Sartorius
- 181. SCIEX
- 182. Segal Cancer Proteomics Centre (SCPC)
- 183. SGS
- 184. Swedish Metabolomics Centre (SMC), SciLifeLab
- 185. Synbio Technologies
- 186. SYNLAB Group
- 187. System Biosciences (SBI)
- 188. Systems Biology Lab
- 189. Takeda
- 190. Technion-Israel Institute of Technology
- 191. Texas A&M University
- 192. TGA Sciences
- 193. The Arctic University of Norway (UiT)
- 194. The Australian Wine Research Institute (AWRI)
- 195. The Canadian Frailty Network
- 196. The Canadian Longitudinal Study of Aging
- 197. The Center for Innovative Technology (CIT), Vanderbilt University
- 198. The McMaster Institute for Research on Aging
- 199. The Metabolomics Innovation Centre (TMIC)
- 200. The Ohio State University
- 201. The University of Edinburgh
- 202. The University of Melbourne
- 203. The University of Tennessee Health Science Center
- 204. The University of Western Australia
- 205. The Wistar Institute
- 206. Thermo Fischer Scientific
- 207. Thomas Jefferson University
- 208. Turku Bioscience
- 209. U.S. Army Research Institute of Environmental Medicine
- 210. U.S. Department of Veterans Affairs
- 211. UCLA Metabolomics Centre
- 212. University of Alabama at Birmingham
- 213. University of Birmingham
- 214. University of California, Riverside
- 215. University of Cambridge
- 216. University of Colorado Anschutz Medical Campus
- 217. University of Copenhagen
- 218. University of Eastern Piedmont
- 219. University of Florida
- 220. University of Fribourg
- 221. University of Gothenburg
- 222. University of Helsinki
- 223. University of Lausanne
- 224. University of Louisville
- 225. University of Maryland School of Pharmacy
- 226. University of Minnesota
- 227. University of North Texas
- 228. University of Oklahoma
- 229. University of Oslo
- 230. University of Oxford
- 231. University of Texas at Dallas
- 232. University of Victoria (UVic)
- 233. University of Virginia
- 234. University of York
- 235. UT Southwestern Medical Center
- 236. UTMB Mass Spectrometry Facility (MSF)
- 237. Utrecht University
- 238. Vanderbilt University
- 239. Verso Biosciences
- 240. Vienna BioCenter
- 241. W. M. Keck Metabolomics Research Laboratory, Iowa State University
- 242. Wake Forest School of Medicine
- 243. Washington University School of Medicine
- 244. Weill Cornell Medicine
- 245. Weizmann Institute of Science
- 246. West Coast Metabolomics Center
- 247. Xell (acquired by Sartorious)
- 248. X-omics
- 249. Yale University
- 250. Yenepoya Research Center (YRC)
- 251. Zhejiang Dian Diagn
 2024-2032 年代謝組學市場報告(按產品、適應症、應用和地區)
 全球代謝體學市場規模、佔有率、成長分析、按產品和服務、按最終應用分類 - 行業預測,2024-2031 年
 代謝組學市場:按產品/服務、適應症、應用、最終用戶分類 - 2024-2030 年全球預測
 代謝體學:全球市場的展望·預測 (2023-2028年)
 全球代謝組學市場研究報告 - 行業分析、規模、佔有率、成長、趨勢及2023年至2030年預測
 代謝組學市場:2023-2028年全球行業趨勢、佔有率、規模、成長、機會和預測
 代謝體學的全球市場
 代謝組學服務市場:按服務類型、技術(檢測技術、分離技術)、應用、最終用戶、地區 - 規模、份額、前景、機會分析,2022-2030 年
 全球代謝組學市場 - 市場規模、細分、前景、按產品/服務、適應症、應用、地區收入預測2022-2028
 2022-2029 年全球代謝組學市場