


 |
市場調查報告書
商品編碼
1071810
基於人工智能的藥物發現市場(第 2 版):按藥物發現步驟(目標識別/驗證、命中創建/先導識別、先導優化)、治療領域(腫瘤疾病、中樞神經系統疾病)分佈AI-based Drug Discovery Market (2nd Edition): Distribution by Drug Discovery Steps (Target Identification / Validation, Hit Generation / Lead Identification, Lead Optimization), Therapeutic Area (Oncological Disorders, CNS Disorders |
||||||
洞察範例
目錄
第一章前言
第2章執行摘要
第三章介紹
- 章節概述
- 人工智能
- 人工智能的一個子集
- 機器學習
- 數據科學
- 人工智能在醫療保健中的應用
- 藥物發現
- 疾病預測、診斷和治療
- 製造和供應鏈運營
- 營銷
- 臨床試驗
- 藥物發現中的人工智能
- 通路和靶點的識別
- 命中或線索識別
- 讀取優化
- 類藥物化合物的合成
- 在藥物發現過程中使用 AI 的好處
- 與採用人工智能相關的問題
- 結束語
第4章競爭態勢
- 章節概述
- 基於人工智能的藥物發現:整體市場狀況
第 5 章企業簡介:北美基於 AI 的藥物發現提供商
- 章節概述
- 原子級
- 生物合成
- 合作製藥
- 循環
- InveniAI
- 遞歸製藥
- Valo 健康
第 6 章企業概況概述:歐洲基於 AI 的藥物發現提供商
- 章節概述
- Aiforia Technologies
- 化學生活
- 深度物質
- 知識
- MAbSilico
- 優化
- Senshin Health
第7章企業概況概述:亞太地區基於人工智能的藥物發現提供商
- 章節概述
- 3BIGS
- 格羅
- Insilico Medicine
- 銳眼
第 8 章夥伴關係和合作
- 章節概述
- 合作模式
- 基於 AI 的藥物發現:夥伴關係與合作
第九章融資與投資分析
- 章節概述
- 資金類型
- 基於人工智能的藥物發現:融資和投資
第10章專利分析
- 章節概述
- 範圍及調查方法
- 基於人工智能的藥物發現:專利分析
- 基於人工智能的藥物發現:專利基準
- 基於人工智能的藥物發現:專利評估
第11章波特五力分析
- 章節概述
- 假設是一種研究方法
- 主要參數
- 結束語
第十二章企業評價分析
- 章節概述
- 企業評價分析:關鍵參數
- 調查方法
- 企業評價分析:Roots analysis unique score
第 13 章領先技術公司的基於人工智能的醫療保健計劃
第14章成本降低分析
第15章市場預測
- 章節概述
- 重要的先決條件和研究方法
- 2022-2035 年全球基於 AI 的藥物發現市場
第16章結論
第 17 章執行洞察力
第18章附錄一:聚合數據
第十九章附錄二:公司和組織名單
Title:
AI-based Drug Discovery Market (2nd Edition):
Distribution by Drug Discovery Steps (Target Identification / Validation, Hit Generation / Lead Identification, Lead Optimization), Therapeutic Area (Oncological Disorders, CNS Disorders, Infectious Diseases, Respiratory Disorders, Cardiovascular Disorders, Endocrine Disorders, Gastrointestinal Disorders, Musculoskeletal Disorders, Immunological Disorders, Dermatological Disorders and Others) and Key Geographies (North America, Europe, Asia-Pacific, Latin America, MENA, and RoW): Industry Trends and Global Forecasts, 2022-2035.
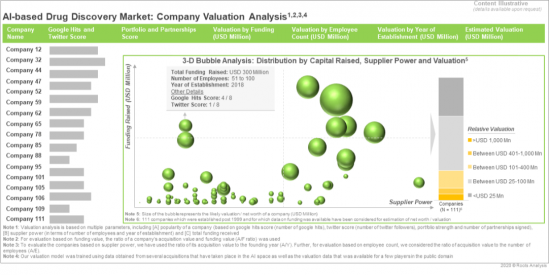
Example Insights:
Some playrers have managed to establish strong competitive positions; in future, we expect multiple acquisitions to take place wherein the relative valuation of a firm is likely to be a key determinant.
Overview
The discovery and development process of a novel therapeutic candidate is often tedious and fraught with several challenges.The key concern associated with the overall process is the high attrition rate, which is often attributed to the trial-and-error approach followed for the drug discovery process.In fact, only a small proportion of pharmacological leads are translated into viable product candidates for clinical studies. In addition, experts believe that close to 90% of the product candidates considered in such studies fail to advance further in the development process. This, in turn, often results in a massive financial burden. In this context, it is estimated that a prescription drug takes around 10 to 15 years and an average investment of USD 1 to 2 billion, in order to traverse from the bench to the market. Moreover, around one-third of the aforementioned expenditure is incurred during the drug discovery phase alone. Therefore, to address the existing concerns, such as rising capital requirements and failure of late-stage programs, pharmaceutical players are currently exploring the implementation of Artificial Intelligence (AI) based tools to better inform their discovery and development operations, using available chemical and biological data. Specifically, AI is believed to be capable of processing and analyzing large volumes of clinical / medical data, as well as leverage it to better inform modern drug discovery efforts. In this context, deep learning algorithms have been demonstrated to be able to cross-reference published scientific literature (structured data) with electronic health records (EHRs) and clinical trial information (unstructured data), in order to generate actionable insights for target identification, hit generation and lead optimization.
At present, machine learning, deep learning, supervised learning, unsupervised learning and natural language processing are some of the key AI-based tools being deployed across different processes, including drug discovery, within the healthcare sector. The use of AI-enabled technologies in drug discovery operations is expected to not only improve the overall R&D productivity, but also reduce clinical failure of product candidates, by enabling accurate prediction of its safety and efficacy during early stages of development. Close to 210 companies currently claim to offer AI-based services, platforms and tools for drug discovery. Further, over USD 10 billion has been invested in this market by both private and public sector investors, in the last five years. Interestingly, close to 50% of the aforementioned amount was invested in the last two years, reflecting the increasing interest of stakeholders in AI-based tools for drug discovery. Additionally, close to 440 recently instances of collaborations have been reported between industry / academic stakeholders in order to advance the development of various AI-based solutions for drug discovery. Considering the active initiatives being undertaken by players based in this domain, we are led to believe that the opportunity for stakeholders in this niche, albeit upcoming, industry is likely to grow at a commendable pace in the foreseen future.
Scope of the Report
The 'AI-based Drug Discovery Market (2nd Edition): Distribution by Drug Discovery Steps (Target Identification / Validation, Hit Generation / Lead Identification and Lead Optimization), Therapeutic Area (Oncological Disorders, CNS Disorders, Infectious Diseases, Respiratory Disorders, Cardiovascular Disorders, Endocrine Disorders, Gastrointestinal Disorders, Musculoskeletal Disorders, Immunological Disorders, Dermatological Disorders and Others) and Key Geographies (North America, Europe, Asia-Pacific, Latin America, MENA and Rest of the World): Industry Trends and Global Forecasts, 2022-2035' report features an extensive study of the current landscape and future potential of the players engaged in offering AI-based services, platforms and tools for the discovery of novel drug candidates. The study features an in-depth analysis, highlighting the capabilities of AI-based drug discovery service / technology providers. Amongst other elements, the report features:
- A detailed overview of the overall landscape of companies offering AI-based services, platforms and tools for drug discovery, along with information on several relevant parameters, such as their year of establishment, company size (in terms of employee count), location of headquarters (North America, Europe, Asia-Pacific and Rest of the World) and type of company (service providers, technology providers and in-house players). The chapter also covers details related to the type of AI technology (artificial intelligence (undefined), deep learning, machine learning (undefined) , natural language processing, data science, reinforcement learning, supervised learning and unsupervised learning), drug discovery steps (target discovery / identification / validation, lead identification / optimization / generation and ADME / toxicity testing) , type of drug molecule (small molecules, biologics and both) and target therapeutic area (oncological disorders, neurological disorders, infectious diseases, immunological disorders, cardiovascular disorders, rare diseases, metabolic disorders, respiratory disorders, gastrointestinal disorders, musculoskeletal disorders, dermatological disorders, hematological disorders, ophthalmic disorders and other disorders) .
- Elaborate profiles of prominent players (shortlisted based on a proprietary criterion) engaged in AI-based drug discovery domain, across North America, Europe and Asia-Pacific. Each profile provides an overview of the company, featuring information on the year of establishment, number of employees, location of their headquarters, key executives, details related to its AI-based drug discovery technology portfolio, recent developments and an informed future outlook.
- An analysis of partnerships inked between stakeholders engaged in this domain, during the period 2009-2022, covering research and development agreements, technology access / utilization agreements, acquisitions, technology licensing agreements, joint ventures / mergers, technology integration agreements, service agreements and other related agreements. Further, the partnership activity in this domain has been analyzed based on various parameters, such as year of partnership, type of partnership, target therapeutic area, focus area, type of partner company and most active players (in terms of number of partnerships). It also highlights the regional distribution of the partnership activity witnessed in this market.
- A detailed analysis of various investments, such as grants, awards, seed financing, venture capital financing, debt financing, capital raised from IPOs and subsequent offerings, that were undertaken by players engaged in this domain, during the period 2006-2022.
- An in-depth analysis of the various patents that have been filed / granted related to AI-based drug discovery technologies, from 2019 to February 2022, taking into consideration parameters, such as application year, geographical region, CPC symbols, emerging focus areas, type of applicant and leading players (in terms of size of intellectual property portfolio). It also includes a patent benchmarking analysis and a detailed valuation analysis.
- A qualitative analysis, highlighting the five competitive forces prevalent in this domain, including threats for new entrants, bargaining power of drug developers, bargaining power of AI-based drug discovery companies, threats of substitute technologies and rivalry among existing competitors.
- An elaborate valuation analysis of companies that are involved in the AI-based drug discovery market, based on our proprietary, multi-variable dependent valuation model to estimate the current valuation / net worth of industry players.
- An insightful analysis highlighting the likely cost saving potential associated with the use of AI in the drug discovery sector, based on information gathered from close to 15 countries, taking into consideration various parameters, such as pharmaceutical R&D expenditure, drug discovery expenditure / budget and adoption of AI across various drug discovery steps.
- One of the key objectives of the report was to evaluate the current opportunity and future potential associated with the AI-based drug discovery, over the coming 13 years. We have provided informed estimates of the likely evolution of the market in the short to mid-term and long term, for the period 2022-2035. Our year-wise projections of the current and future opportunity have further been segmented based on relevant parameters, such as [A] drug discovery steps (target identification / validation, hit generation / lead identification and lead optimization), [B] target therapeutic area (oncological disorders, CNS disorders, infectious diseases, respiratory disorders, cardiovascular disorders, endocrine disorders, gastrointestinal disorders, musculoskeletal disorders, immunological disorders, dermatological disorders and others) and [C] key geographical regions (North America, Europe, Asia-Pacific, MENA, Latin America and Rest of the world). To account for future uncertainties in the market and to add robustness to our model, we have provided three forecast scenarios, portraying the conservative, base and optimistic tracks of the market's evolution.
The opinions and insights presented in the report were also influenced by discussions held with senior stakeholders in the industry. The report features detailed transcripts of interviews held with the following individuals:
- Steve Yemm (Chief Commercial Officer, Aigenpulse) and Satnam Surae (Chief Product Officer, Aigenpulse)
- Ed Addison (Co-founder, Chairman and Chief Executive Officer, Cloud Pharmaceuticals)
- Bo Ram Beck (Head Researcher, DEARGEN)
- Simon Haworth (Chief Executive Officer, Intelligent Omics)
- Immanuel Lerner (Chief Executive Officer and Co-Founder, Pepticom)
Key Questions Answered:
- Who are the leading players engaged in the AI-based drug discovery market?
- Which of the key AI technologies are presently being most commonly adopted by drug discovery focused companies?
- What is the likely valuation / net worth of companies engaged in this domain?
- What is the likely cost saving potential associated with the use of AI in the drug discovery process?
- How is the intellectual property landscape for AI-based drug discovery technologies likely to evolve in the foreseen future?
- Which partnership models are most commonly adopted by stakeholders engaged in this industry?
- What is the overall trend of funding and investments within this domain?
- How is the current and future opportunity likely to be distributed across key market segments?
Chapter Outlines
Chapter 2 is an executive summary of the key insights captured during our research. It offers a high-level view on the likely evolution of the AI-based drug discovery market in the short to mid-term, and long term.
Chapter 3 provides a general overview on the digital revolution in the healthcare industry. It further features details on the applications of artificial intelligence and its subsets, including machine learning (supervised learning, unsupervised learning, reinforcement learning, deep learning, natural language processing) and data science. The chapter specifically emphasizes on the applications of AI in the healthcare sector, along with detailed information on drug discovery, drug manufacturing, drug marketing, diagnosis and treatment, and clinical trials. Additionally, it features detailed information on the different steps involved in the overall drug discovery process. The chapter concludes with a discussion on the advantages and challenges related to the use of AI in drug discovery.
Chapter 4 features a detailed review of the current market landscape of around 210 companies offering AI-based services, platforms and tools for drug discovery. Additionally, it features an in-depth analysis of AI-based drug discovery companies, based on a number of relevant parameters, such as their year of establishment, company size (in terms of employee count), location of headquarters (North America, Europe, Asia-Pacific and rest of the world) and type of company (service providers, technology providers and in-house players). The chapter also covers details related to the type of AI technology (artificial intelligence (undefined), deep learning, machine learning (undefined), natural language processing, data science, reinforcement learning, supervised learning and unsupervised learning) , drug discovery steps (target discovery / identification / validation, lead identification / optimization / generation and ADME / toxicity testing) , type of drug molecule (small molecules, biologics and both) and target therapeutic area (oncological disorders, neurological disorders, infectious diseases, immunological disorders, cardiovascular disorders, rare diseases, metabolic disorders, respiratory disorders, gastrointestinal disorders, musculoskeletal disorders, dermatological disorders, hematological disorders, ophthalmic disorders and other disorders) .
Chapter 5 consists of detailed profiles of the prominent players (shortlisted based on a proprietary criterion) that are engaged in AI-based drug discovery domain in North America. Each profile provides an overview of the company, its AI-based drug discovery technology portfolio and details on recent developments, as well as an informed future outlook.
Chapter 6 consists of detailed profiles of the prominent players (shortlisted based on a proprietary criterion) that are engaged in AI-based drug discovery domain in Europe. Each profile provides an overview of the company, its AI-based drug discovery technology portfolio and details on recent developments, as well as an informed future outlook.
Chapter 7 consists of detailed profiles of the prominent players (shortlisted based on a proprietary criterion) that are engaged in AI-based drug discovery domain in Asia-Pacific. Each profile provides an overview of the company, its AI-based drug discovery technology portfolio and details on recent developments, as well as an informed future outlook.
Chapter 8 features an insightful analysis of the various partnerships and collaborations that have been inked by stakeholders engaged in this domain, since 2009. It includes a brief description of the partnership models (including research and development agreements, technology access / utilization agreements, acquisitions, technology licensing agreements, joint ventures / mergers, technology integration agreements, service agreements and other related agreements) adopted by stakeholders in the domain of AI-based drug discovery. Further, it comprises of analysis based on several relevant parameters such as year of agreement, type of agreement, target therapeutic area, focus area, type of partner company and most active players (in terms of number of partnerships). Further, the chapter includes a world map representation of all the deals inked in this field in the period 2006-2022, highlighting both intercontinental and intracontinental partnership activities.
Chapter 9 provides details on the various investments and grants that have been awarded to players focused on AI-based drug discovery. It includes a detailed analysis of the funding instances that have taken place during the period 2006 to 2022 (till February) , highlighting the growing interest of venture capital (VC) community and other strategic investors in this domain.
Chapter 10 provides an in-depth analysis of the various patents that have been filed / granted related to AI-based drug discovery technologies. For this analysis, we considered those patents that have been filed / granted related to AI-based drug discovery and development, from 2019 to February 2022, taking into consideration various parameters, such as application year, geographical region, CPC symbols, emerging focus areas, type of applicant and leading industry players (in terms of size of intellectual property portfolio). It also includes a patent benchmarking analysis and a detailed valuation analysis.
Chapter 11 provides insights on a qualitative analysis highlighting five competitive forces in this domain, including threats for new entrants, bargaining power of drug developers, bargaining power of AI-based drug discovery companies, threats of substitute technologies and rivalry among existing competitors.
Chapter 12 provides an elaborate valuation analysis of companies that are involved in the AI-based drug discovery market, based on our proprietary, multi-variable dependent valuation model to estimate the current valuation / net worth of industry players.
Chapter 13 features brief details related to initiatives undertaken by technology giants in AI-based healthcare sector. The chapter includes information about companies, such as Amazon Web Services, Alibaba Cloud, Google, IBM, Intel, Microsoft and Siemens.
Chapter 14 includes an insightful analysis highlighting the likely cost saving potential associated with the use of AI in the drug discovery sector, based on information gathered from close to 15 countries, taking into consideration various parameters, such as pharmaceutical R&D expenditure, drug discovery expenditure / budget and adoption of AI across various drug discovery steps.
Chapter 15 presents an insightful market forecast analysis, highlighting the likely growth of the AI-based drug discovery market, for the period 2022-2035. Additionally, the report features the likely distribution of the current and forecasted opportunity across various relevant parameters such as [A] drug discovery steps (target identification / validation, hit generation / lead identification and lead optimization), [B] target therapeutic area (oncological disorders, CNS disorders, infectious diseases, respiratory disorders, cardiovascular disorders, endocrine disorders, gastrointestinal disorders, musculoskeletal disorders, immunological disorders, dermatological disorders and others) and [C] key geographical regions (North America, Europe, Asia-Pacific, MENA, Latin America and Rest of the World) . To account for future uncertainties in the market and to add robustness to our model, we have provided three forecast scenarios, portraying the conservative, base and optimistic tracks of the market's evolution.
Chapter 16 summarizes the overall report. In this chapter, we have provided a list of key takeaways from the report, and expressed our independent opinion related to the research and analysis described in the previous chapters.
Chapter 17 provides the transcripts of the interviews conducted with representatives from renowned organizations that are engaged in AI-based drug discovery. The chapter contains the details of our conversation with Steve Yemm (Chief Commercial Officer, Aigenpulse) and Satnam Surae (Chief Product Officer, Aigenpulse) , Ed Addison (Co-founder, Chairman and Chief Executive Officer, Cloud Pharmaceuticals) , Bo Ram Beck (Head Researcher, DEARGEN) , Simon Haworth (Chief Executive Officer, Intelligent Omics) , Immanuel Lerner (Chief Executive Officer, Co-Founder, Pepticom) and David Chiang (Chairman, Sage-N Research) .
Chapter 18 is an appendix, that provides tabulated data and numbers for all the figures included in the report.
Chapter 19 is an appendix that provides the list of companies and organizations that have been mentioned in the report.
TABLE OF CONTENTS
1. PREFACE
- 1.1. Scope of the Report
- 1.2. Research Methodology
- 1.3. Key Questions Answered
- 1.4. Chapter Outlines
2. EXECUTIVE SUMMARY
3. INTRODUCTION
- 3.1. Chapter Overview
- 3.2. Artificial Intelligence
- 3.3. Subsets of AI
- 3.3.1. Machine Learning
- 3.3.1.1. Supervised Learning
- 3.3.1.2. Unsupervised Learning
- 3.3.1.3. Reinforced / Reinforcement Learning
- 3.3.1.4. Deep Learning
- 3.3.1.5. Natural Language Processing (NLP)
- 3.3.1. Machine Learning
- 3.4. Data Science
- 3.5. Applications of AI in Healthcare
- 3.5.1. Drug Discovery
- 3.5.2. Disease Prediction, Diagnosis and Treatment
- 3.5.3. Manufacturing and Supply Chain Operations
- 3.5.4. Marketing
- 3.5.5. Clinical Trials
- 3.6. AI in Drug Discovery
- 3.6.1. Identification of Pathway and Target
- 3.6.2. Identification of Hit or Lead
- 3.6.3. Lead Optimization
- 3.6.4. Synthesis of Drug-Like Compounds
- 3.7. Advantages of Using AI in the Drug Discovery Process
- 3.8. Challenges Associated with the Adoption of AI
- 3.9. Concluding Remarks
4. COMPETITIVE LANDSCAPE
- 4.1. Chapter Overview
- 4.2. AI-based Drug Discovery: Overall Market Landscape
- 4.2.1. Analysis by Year of Establishment
- 4.2.2. Analysis by Company Size
- 4.2.3. Analysis by Location of Headquarters
- 4.2.4. Analysis by Type of Company
- 4.2.5. Analysis by Type of AI Technology
- 4.2.6. Analysis by Drug Discovery Steps
- 4.2.7. Analysis by Type of Drug Molecule
- 4.2.8. Analysis by Drug Development Initiatives
- 4.2.9. Analysis by Technology Licensing Option
- 4.2.10. Analysis by Target Therapeutic Area
- 4.2.11. Key Players: Analysis by Number of Platforms / Tools Available
5. COMPANY PROFILES: AI-BASED DRUG DISCOVERY PROVIDERS IN NORTH AMERICA
- 5.1. Chapter Overview
- 5.2. Atomwise
- 5.2.1. Company Overview
- 5.2.2. AI-based Drug Discovery Technology Portfolio
- 5.2.3. Recent Developments and Future Outlook
- 5.3. BioSyntagma
- 5.3.1. Company Overview
- 5.3.2. AI-based Drug Discovery Technology Portfolio
- 5.3.3. Recent Developments and Future Outlook
- 5.4. Collaborations Pharmaceuticals
- 5.4.1. Company Overview
- 5.4.2. AI-based Drug Discovery Technology Portfolio
- 5.4.3. Recent Developments and Future Outlook
- 5.5. Cyclica
- 5.5.1. Company Overview
- 5.5.2. AI-based Drug Discovery Technology Portfolio
- 5.5.3. Recent Developments and Future Outlook
- 5.6. InveniAI
- 5.6.1. Company Overview
- 5.6.2. AI-based Drug Discovery Technology Portfolio
- 5.6.3. Recent Developments and Future Outlook
- 5.7. Recursion Pharmaceuticals
- 5.7.1. Company Overview
- 5.7.2. AI-based Drug Discovery Technology Portfolio
- 5.7.3. Recent Developments and Future Outlook
- 5.8. Valo Health
- 5.8.1. Company Overview
- 5.8.2. AI-based Drug Discovery Technology Portfolio
- 5.8.3. Recent Developments and Future Outlook
6. COMPANY PROFILES: AI-BASED DRUG DISOCVERY SERVICE PROVIDERS IN EUROPE
- 6.1. Chapter Overview
- 6.2. Aiforia Technologies
- 6.2.1. Company Overview
- 6.2.2. AI-based Drug Discovery Technology Portfolio
- 6.2.3. Recent Developments and Future Outlook
- 6.3. Chemalive
- 6.3.1. Company Overview
- 6.3.2. AI-based Drug Discovery Technology Portfolio
- 6.3.3. Recent Developments and Future Outlook
- 6.4. DeepMatter
- 6.4.1. Company Overview
- 6.4.2. AI-based Drug Discovery Technology Portfolio
- 6.4.3. Recent Developments and Future Outlook
- 6.5. Exscientia
- 6.5.1. Company Overview
- 6.5.2. AI-based Drug Discovery Technology Portfolio
- 6.5.3. Recent Developments and Future Outlook
- 6.6. MAbSilico
- 6.6.1. Company Overview
- 6.6.2. AI-based Drug Discovery Technology Portfolio
- 6.6.3. Recent Developments and Future Outlook
- 6.7. Optibrium
- 6.7.1. Company Overview
- 6.7.2. AI-based Drug Discovery Technology Portfolio
- 6.7.3. Recent Developments and Future Outlook
- 6.8. Sensyne Health
- 6.8.1. Company Overview
- 6.8.2. AI-based Drug Discovery Technology Portfolio
- 6.8.3. Recent Developments and Future Outlook
7. COMPANY PROFILES: AI-BASED DRUG DISOCVERY SERVICE PROVIDERS IN ASIA PACIFIC
- 7.1. Chapter Overview
- 7.2. 3BIGS
- 7.2.1. Company Overview
- 7.2.2. AI-based Drug Discovery Technology Portfolio
- 7.2.3. Recent Developments and Future Outlook
- 7.3. Gero
- 7.3.1. Company Overview
- 7.3.2. AI-based Drug Discovery Technology Portfolio
- 7.3.3. Recent Developments and Future Outlook
- 7.4. Insilico Medicine
- 7.4.1. Company Overview
- 7.4.2. AI-based Drug Discovery Technology Portfolio
- 7.4.3. Recent Developments and Future Outlook
- 7.5. KeenEye
- 7.5.1. Company Overview
- 7.5.2. AI-based Drug Discovery Technology Portfolio
- 7.5.3. Recent Developments and Future Outlook
8. PARTNERSHIPS AND COLLABORATIONS
- 8.1. Chapter Overview
- 8.2. Partnership Models
- 8.3. AI-based Drug Discovery: Partnerships and Collaborations
- 8.3.1. Analysis by Year of Partnership
- 8.3.2. Analysis by Type of Partnership
- 8.3.3. Analysis by Year and Type of Partnership
- 8.3.4. Analysis by Target Therapeutic Area
- 8.3.5. Analysis by Focus Area
- 8.3.6. Analysis by Year of Partnership and Focus Area
- 8.3.7. Analysis by Type of Partner Company
- 8.3.8. Analysis by Type of Partnership and Type of Partner Company
- 8.3.9. Most Active Players: Analysis by Number of Partnerships
- 8.3.10. Analysis by Region
- 8.3.11.1. Intercontinental and Intracontinental Deals
- 8.3.11.2. International and Local Deals
9. FUNDING AND INVESTMENT ANALYSIS
- 9.1. Chapter Overview
- 9.2. Types of Funding
- 9.3. AI-based Drug Discovery: Funding and Investments
- 9.3.1. Analysis of Number of Funding Instances by Year
- 9.3.2. Analysis of Amount Invested by Year
- 9.3.3. Analysis by Type of Funding
- 9.3.4. Analysis of Amount Invested and Type of Funding
- 9.3.5. Analysis of Amount Invested by Company Size
- 9.3.6. Analysis by Type of Investor
- 9.3.7. Analysis of Amount Invested by Type of Investor
- 9.3.8. Most Active Players: Analysis by Number of Funding Instances
- 9.3.9. Most Active Players: Analysis by Amount Invested
- 9.3.10. Most Active Investors: Analysis by Number of Funding Instances
- 9.3.11. Analysis of Amount Invested by Geography
- 9.3.11.1. Analysis by Region
- 9.3.11.2. Analysis by Country
10. PATENT ANALYSIS
- 10.1. Chapter Overview
- 10.2. Scope and Methodology
- 10.3. AI-based Drug Discovery: Patent Analysis
- 10.3.1 Analysis by Application Year
- 10.3.2. Analysis by Geography
- 10.3.3. Analysis by CPC Symbols
- 10.3.4. Analysis by Emerging Focus Areas
- 10.3.5. Analysis by Type of Applicant
- 10.3.6. Leading Players: Analysis by Number of Patents
- 10.4. AI-based Drug Discovery: Patent Benchmarking
- 10.4.1. Analysis by Patent Characteristics
- 10.5. AI-based Drug Discovery: Patent Valuation
11. PORTER'S FIVE FORCES ANALYSIS
- 11.1. Chapter Overview
- 11.2. Methodology and Assumptions
- 11.3. Key Parameters
- 11.3.1. Threats of New Entrants
- 11.3.2. Bargaining Power of Drug Developers
- 11.3.3. Bargaining Power of Companies Using AI for Drug Discovery
- 11.3.4. Threats of Substitute Technologies
- 11.3.5. Rivalry Among Existing Competitors
- 11.4. Concluding Remarks
12. COMPANY VALUATION ANALYSIS
- 12.1. Chapter Overview
- 12.2. Company Valuation Analysis: Key Parameters
- 12.3. Methodology
- 12.3.1. Employee Score
- 12.3.2. Experience Score
- 12.3.3. Portfolio Strength / Uniqueness Score
- 12.3.4. Funding Score
- 12.3.5. Partnerships Score
- 12.3.6. Weighted Average Score
- 12.4. Company Valuation Analysis: Roots Analysis Proprietary Scores
13. AI-BASED HEALTHCARE INITIATIVES OF TECHNOLOGY GIANTS
- 13.1 Chapter Overview
- 13.1.1. Amazon Web Services
- 13.1.2. Microsoft
- 13.1.3. Intel
- 13.1.4. Alibaba Cloud
- 13.1.5. Siemens
- 13.1.6. Google
- 13.1.7. IBM
14. COST SAVING ANALYSIS
- 14.1. Chapter Overview
- 14.2. Key Assumptions and Methodology
- 14.3. Overall Cost Saving Potential Associated with Use of AI-based Solutions in Drug
- 14.3.1. Likely Cost Savings: Analysis by Drug Discovery Steps, 2022-2035
- 14.3.1.1. Likely Cost Savings During Target Identification / Validation, 2022-2035
- 14.3.1.2. Likely Cost Savings During Hit Generation / Lead Identification, 2022-2035
- 14.3.1.3. Likely Cost Savings During Lead Optimization, 2022-2035
- 14.3.2. Likely Cost Savings: Analysis by Target Therapeutic Area, 2022-2035
- 14.3.2.1. Likely Cost Savings for Drugs Targeting Oncological Disorders, 2022-2035
- 14.3.2.2. Likely Cost Savings for Drugs Targeting Neurological Disorders, 2022-2035
- 14.3.2.3. Likely Cost Savings for Drugs Targeting Infectious Diseases, 2022-2035
- 14.3.2.4. Likely Cost Savings for Drugs Targeting Respiratory Disorders, 2022-2035
- 14.3.2.5. Likely Cost Savings for Drugs Targeting Cardiovascular Disorders, 2022-2035
- 14.3.2.6. Likely Cost Savings for Drugs Targeting Endocrine Disorders, 2022-2035
- 14.3.2.7. Likely Cost Savings for Drugs Targeting Gastrointestinal Disorders, 2022-2035
- 14.3.2.8. Likely Cost Savings for Drugs Targeting Musculoskeletal Disorders, 2022-2035
- 14.3.2.9. Likely Cost Savings for Drugs Targeting Immunological Disorders, 2022-2035
- 14.3.2.10. Likely Cost Savings for Drugs Targeting Dermatological Disorders, 2022-2035
- 14.3.2.11. Likely Cost Savings for Drugs Targeting Other Disorders, 2022-2035
- 14.3.3. Likely Cost Savings: Analysis by Geography, 2022-2035
- 14.3.3.1. Likely Cost Savings in North America, 2022-2035
- 14.3.3.2. Likely Cost Savings in Europe, 2022-2035
- 14.3.3.3. Likely Cost Savings in Asia Pacific, 2022-2035
- 14.3.3.4. Likely Cost Savings in MENA, 2022-2035
- 14.3.3.5. Likely Cost Savings in Latin America, 2022-2035
- 14.3.3.6. Likely Cost Savings in Rest of the World, 2022-2035
- 14.3.1. Likely Cost Savings: Analysis by Drug Discovery Steps, 2022-2035
15. MARKET FORECAST
- 15.1. Chapter Overview
- 15.2. Key Assumptions and Methodology
- 15.3. Global AI-based Drug Discovery Market, 2022-2035
- 15.3.1. AI-based Drug Discovery Market: Distribution by Drug Discovery Steps, 2022-2035
- 15.3.1.1. AI-based Drug Discovery Market for Target Identification / Validation, 2022-2035
- 15.3.1.2. AI-based Drug Discovery Market for Hit Generation / Lead Identification, 2022-2035
- 15.3.1.3. AI-based Drug Discovery Market for Lead Optimization, 2022-2035
- 15.3.2. AI-based Drug Discovery Market: Distribution by Target Therapeutic Area, 2022-2035
- 15.3.2.1. AI-based Drug Discovery Market for Oncological Disorders, 2022-2035
- 15.3.2.2. AI-based Drug Discovery Market for Neurological Disorders, 2022-2035
- 15.3.2.3. AI-based Drug Discovery Market for Infectious Diseases, 2022-2035
- 15.3.2.4. AI-based Drug Discovery Market for Respiratory Disorders, 2022-2035
- 15.3.2.5. AI-based Drug Discovery Market for Cardiovascular Disorders, 2022-2035
- 15.3.2.6. AI-based Drug Discovery Market for Endocrine Disorders, 2022-2035
- 15.3.2.7. AI-based Drug Discovery Market for Gastrointestinal Disorders, 2022-2035
- 15.3.2.8. AI-based Drug Discovery Market for Musculoskeletal Disorders, 2022-2035
- 15.3.2.9. AI-based Drug Discovery Market for Immunological Disorders, 2022-2035
- 15.3.2.10. AI-based Drug Discovery Market for Dermatological Disorders, 2022-2035
- 15.3.2.11. AI-based Drug Discovery Market for Other Disorders, 2022-2035
- 15.3.3. AI-based Drug Discovery Market: Distribution by Geography, 2022-2035
- 15.3.3.1. AI-based Drug Discovery Market in North America, 2022-2035
- 15.3.3.1.1. AI-based Drug Discovery Market in the US, 2022-2035
- 15.3.3.1.2. AI-based Drug Discovery Market in Canada, 2022-2035
- 15.3.3.2. AI-based Drug Discovery Market in Europe, 2022-2035
- 15.3.3.2.1. AI-based Drug Discovery Market in the UK, 2022-2035
- 15.3.3.2.2. AI-based Drug Discovery Market in France, 2022-2035
- 15.3.3.2.3. AI-based Drug Discovery Market in Germany, 2022-2035
- 15.3.3.2.4. AI-based Drug Discovery Market in Spain, 2022-2035
- 15.3.3.2.5. AI-based Drug Discovery Market in Italy, 2022-2035
- 15.3.3.2.6. AI-based Drug Discovery Market in Rest of Europe, 2022-2035
- 15.3.3.3. AI-based Drug Discovery Market in Asia Pacific, 2020-2035
- 15.3.3.3.1. AI-based Drug Discovery Market in China, 2022-2035
- 15.3.3.3.2. AI-based Drug Discovery Market in India, 2022-2035
- 15.3.3.3.3. AI-based Drug Discovery Market in Japan, 2022-2035
- 15.3.3.3.4. AI-based Drug Discovery Market in Australia, 2022-2035
- 15.3.3.3.5. AI-based Drug Discovery Market in South Korea, 2022-2035
- 15.3.3.4. AI-based Drug Discovery Market in MENA, 2022-2035
- 15.3.3.4.1. AI-based Drug Discovery Market in Saudi Arabia, 2022-2035
- 15.3.3.4.2. AI-based Drug Discovery Market in UAE, 2022-2035
- 15.3.3.4.3. AI-based Drug Discovery Market in Iran, 2022-2035
- 15.3.3.5. AI-based Drug Discovery Market in Latin America, 2022-2035
- 15.3.3.5.1. AI-based Drug Discovery Market in Argentina, 2022-2035
- 15.3.3.6. AI-based Drug Discovery Market in Rest of the World, 2022-2035
- 15.3.3.1. AI-based Drug Discovery Market in North America, 2022-2035
- 15.3.1. AI-based Drug Discovery Market: Distribution by Drug Discovery Steps, 2022-2035
16. CONCLUSION
17. EXECUTIVE INSIGHTS
- 17.1. Chapter Overview
- 17.2. Aigenpulse
- 17.2.1. Company Snapshot
- 17.2.2. Interview Transcript: Steve Yemm (Chief Commercial Officer) and Satnam Surae (Chief Product Officer)
- 17.3. Cloud Pharmaceuticals
- 17.3.1. Company Snapshot
- 17.3.2. Interview Transcript: Ed Addison (Co-founder, Chairman and Chief Executive Officer)
- 17.4. DEARGEN
- 17.4.1. Company Snapshot
- 17.4.2. Interview Transcript: Bo Ram Beck (Head Researcher)
- 17.5. Intelligent Omics
- 17.5.1. Company Snapshot
- 17.5.2. Interview Transcript: Simon Haworth (Chief Executive Officer)
- 17.6. Pepticom
- 17.6.1. Company Snapshot
- 17.6.2. Interview Transcript: Immanuel Lerner (Chief Executive Officer, Co-Founder)
- 17.7. Sage-N Research
- 17.7.1. Company Snapshot
- 17.7.2. Interview Transcript: David Chiang (Chairman)
18. APPENDIX I: TABULATED DATA
19. APPENDIX II: LIST OF COMPANIES AND ORGANIZATIONS
List Of Figures
- Figure 2.1 Executive Summary: Overall Market Landscape
- Figure 2.2 Executive Summary: Partnerships and Collaborations
- Figure 2.3 Executive Summary: Funding and Investment Analysis
- Figure 2.4 Executive Summary: Patent Analysis
- Figure 2.5 Executive Summary: Cost Saving Analysis
- Figure 2.6 Executive Summary: Market Forecast
- Figure 3.1 Evolution of AI
- Figure 3.2. Key Segments of AI
- Figure 3.3. Interconnection between Data Science, Artificial Intelligence and Big Data
- Figure 3.4. Applications of AI
- Figure 4.1. AI-based Drug Discovery: Distribution by Year of Establishment
- Figure 4.2. AI-based Drug Discovery: Distribution by Company Size
- Figure 4.3. AI-based Drug Discovery: Distribution by Location of Headquarters (Region-Wise)
- Figure 4.4. AI-based Drug Discovery: Distribution by Location of Headquarters (Country-Wise)
- Figure 4.5. AI-based Drug Discovery: Distribution by Company Size and Location of Headquarters
- Figure 4.6. AI-based Drug Discovery: Distribution by Type of Company
- Figure 4.7. AI-based Drug Discovery: Distribution by Type of AI Technology
- Figure 4.8. AI-based Drug Discovery: Distribution by Drug Discovery Steps
- Figure 4.9. AI-based Drug Discovery: Distribution by Type of Drug Molecule
- Figure 4.10. AI-based Drug Discovery: Distribution by Drug Development Initiatives
- Figure 4.11. AI-based Drug Discovery: Distribution by Technology Licensing Option
- Figure 4.12. AI-based Drug Discovery: Distribution by Target Therapeutic Area
- Figure 4.13. Key Players: Distribution by Number of Platforms / Tools Available
- Figure 8.1 Partnerships and Collaborations: Cumulative Year-wise Trend
- Figure 8.2 Partnerships and Collaborations: Distribution by Type of Partnership
- Figure 8.3 Partnerships and Collaborations: Distribution by Year and Type of Partnership
- Figure 8.4 Partnerships and Collaborations: Distribution by Target Therapeutic Area
- Figure 8.5 Partnerships and Collaborations: Distribution by Focus Area
- Figure 8.6 Partnerships and Collaborations: Distribution by Year of Partnership and Focus Area
- Figure 8.7 Partnerships and Collaborations: Distribution by Type of Partner Company
- Figure 8.8 Partnerships and Collaborations: Distribution by Type of Partner Company and Type of Partnerships
- Figure 8.9 Most Active Players: Distribution by Number of Partnerships
- Figure 8.10 Partnerships and Collaborations: Distribution of Intercontinental and Intracontinental Deals
- Figure 8.11 Partnerships and Collaborations: Distribution of International and Local Deals
- Figure 9.1 Funding and Investment Analysis: Cumulative Year-wise Distribution of Funding Instances, 2006-2022
- Figure 9.2 Funding and Investment Analysis: Cumulative Year-wise Distribution of Amount Invested (USD Million), 2006-2022
- Figure 9.3 Funding and Investment Analysis: Distribution of Instances by Type of Funding
- Figure 9.4 Funding and Investment Analysis: Distribution of Amount Invested by Type of Funding (USD Million)
- Figure 9.6 Funding and Investment Analysis: Distribution of Amount Invested by Company Size (USD Million)
- Figure 9.7 Funding and Investment Analysis: Distribution of Number of Funding Instances by Type of Investor
- Figure 9.8 Funding and Investment Analysis: Distribution of Amount Invested by Type of Investor (USD Million)
- Figure 9.9 Most Active Players: Distribution by Number of Funding Instances
- Figure 9.10 Most Active Players: Distribution by Amount Invested
- Figure 9.11 Most Active Investors: Distribution by Number of Funding Instances
- Figure 9.12 Funding and Investment: Distribution of Amount Invested by Region (USD Million)
- Figure 9.13 Funding and Investment: Distribution of Amount Invested by Country (USD Million)
- Figure 10.1 Patent Analysis: Distribution by Type of Patent
- Figure 10.2 Patent Analysis: Distribution by Application Year
- Figure 10.3 Patent Analysis: Distribution by Location of Patent Jurisdiction (Region-wise)
- Figure 10.4 Patent Analysis: Distribution by Location of Patent Jurisdiction (Country-wise)
- Figure 10.5 Patent Analysis: Distribution by CPC Symbols
- Figure 10.6 Patent Analysis: Emerging Focus Area
- Figure 10.7 Patent Analysis: Cumulative Year-wise Distribution by Type of Applicant
- Figure 10.8 Leading Industry Players: Distribution by Number of Patents
- Figure 10.9 Leading Non-Industry Players: Distribution by Number of Patents
- Figure 10.10 Leading Patent Assignees: Distribution by Number of Patents
- Figure 10.11 Patent Benchmarking: Distribution of Leading Industry Players by Patent Characteristics (CPC Symbols)
- Figure 10.12 Patent Analysis: Distribution by Age
- Figure 10.13 Patent Analysis: Patent Valuation
- Figure 11.1 Porters Five Forces: Key Parameters
- Figure 11.2 Porters Five Forces: Harvey Ball Analysis
- Figure 12.1 Company Valuation Analysis: Categorization by Employee Score
- Figure 12.2 Company Valuation Analysis: Categorization by Experience Score
- Figure 12.3 Company Valuation Analysis: Categorization by Portfolio Strength / Uniqueness Score
- Figure 12.4 Company Valuation Analysis: Categorization by Funding Score
- Figure 12.5 Company Valuation Analysis: Categorization by Partnership Score
- Figure 12.6 Company Valuation Analysis: Categorization by Weighted Average Score
- Figure 14.1 Overall Cost Saving Potential Associated with Use of AI-based Solutions in Drug Discovery, 2022-2035 (USD Million)
- Figure 14.2 Likely Cost Savings: Distribution by Drug Discovery Steps, 2022-2035 (USD Million)
- Figure 14.3 Likely Cost Savings During Target Identification / Validation, 2022-2035 (USD Million)
- Figure 14.4 Likely Cost Savings During Hit Generation / Lead Identification, 2022-2035 (USD Million)
- Figure 14.5 Likely Cost Savings During Lead Optimization, 2022-2035 (USD Million)
- Figure 14.6 Likely Cost Savings: Distribution by Target Therapeutic Area, 2022-2035 (USD Million)
- Figure 14.7 Likely Cost Savings for Drugs Targeting Oncological Disorders, 2022-2035 (USD Million)
- Figure 14.8 Likely Cost Savings for Drugs Targeting Neurological Disorders, 2022-2035 (USD Million)
- Figure 14.9 Likely Cost Savings for Drugs Targeting Infectious Diseases, 2022-2035 (USD Million)
- Figure 14.10 Likely Cost Savings for Drugs Targeting Respiratory Disorders, 2022-2035 (USD Million)
- Figure 14.11 Likely Cost Savings for Drugs Targeting Cardiovascular Disorders, 2022-2035 (USD Million)
- Figure 14.12 Likely Cost Savings for Drugs Targeting Endocrine Disorders, 2022-2035 (USD Million)
- Figure 14.13 Likely Cost Savings for Drugs Targeting Gastrointestinal Disorders, 2022-2035 (USD Million)
- Figure 14.14 Likely Cost Savings for Drugs Targeting Musculoskeletal Disorders, 2022-2035 (USD Million)
- Figure 14.15 Likely Cost Savings for Drugs Targeting Immunological Disorders, 2022-2035 (USD Million)
- Figure 14.16 Likely Cost Savings for Drugs Targeting Dermatological Disorders, 2022-2035 (USD Million)
- Figure 14.17 Likely Cost Savings for Drugs Targeting Other Disorders, 2022-2035 (USD Million)
- Figure 14.18 Likely Cost Savings: Distribution by Geography, 2022-2035 (USD Million)
- Figure 14.19 Likely Cost Savings in North America, 2022-2035 (USD Million)
- Figure 14.20 Likely Cost Savings in Europe, 2022-2035 (USD Million)
- Figure 14.21 Likely Cost Savings in Asia Pacific, 2022-2035 (USD Million)
- Figure 14.22 Likely Cost Savings in MENA, 2022-2035 (USD Million)
- Figure 14.23 Likely Cost Savings in Latin America, 2022-2035 (USD Million)
- Figure 14.24 Likely Cost Savings in Rest of the World, 2022-2035 (USD Million)
- Figure 15.1 Global AI-based Drug Discovery Market, 2022-2035 (USD Million)
- Figure 15.2 AI-based Drug Discovery Market: Distribution by Drug Discovery Steps, 2022-2035 (USD Million)
- Figure 15.3 AI-based Drug Discovery Market for Target Identification / Validation, 2022-2035 (USD Million)
- Figure 15.4 AI-based Drug Discovery Market for Hit Generation / Lead Identification, 2022-2035 (USD Million)
- Figure 15.5 AI-based Drug Discovery Market for Lead Optimization, 2022-2035 (USD Million)
- Figure 15.6 AI-based Drug Discovery Market: Distribution by Target Therapeutic Area, 2022-2035 (USD Million)
- Figure 15.7 AI-based Drug Discovery Market for Oncological Disorders, 2022-2035 (USD Million)
- Figure 15.8 AI-based Drug Discovery Market for Neurological Disorders 2022-2035 (USD Million)
- Figure 15.9 AI-based Drug Discovery Market for Infectious Diseases, 2022-2035 (USD Million)
- Figure 15.10 AI-based Drug Discovery Market for Respiratory Disorders, 2022-2035 (USD Million)
- Figure 15.11 AI-based Drug Discovery Market for Cardiovascular Disorders, 2022-2035 (USD Million)
- Figure 15.12 AI-based Drug Discovery Market for Endocrine Disorders, 2022-2035 (USD Million)
- Figure 15.13 AI-based Drug Discovery Market for Gastrointestinal Disorders, 2022-2035 (USD Million)
- Figure 15.14 AI-based Drug Discovery Market for Musculoskeletal Disorders, 2022-2035 (USD Million)
- Figure 15.15 AI-based Drug Discovery Market for Immunological Disorders, 2022-2035 (USD Million)
- Figure 15.16 AI-based Drug Discovery Market for Dermatological Disorders, 2022-2035 (USD Million)
- Figure 15.17 AI-based Drug Discovery Market for Other Disorders, 2022-2035 (USD Million)
- Figure 15.18 AI-based Drug Discovery Market: Distribution by Geography, 2022-2035 (USD Million)
- Figure 15.19 AI-based Drug Discovery Market in North America, 2022-2035 (USD Million)
- Figure 15.20 AI-based Drug Discovery Market in the US, 2022-2035 (USD Million)
- Figure 15.21 AI-based Drug Discovery Market in Canada, 2022-2035 (USD Million)
- Figure 15.22 AI-based Drug Discovery Market in Europe, 2022-2035 (USD Million)
- Figure 15.23 AI-based Drug Discovery Market in UK, 2022-2035 (USD Million)
- Figure 15.24 AI-based Drug Discovery Market in France, 2022-2035 (USD Million)
- Figure 15.25 AI-based Drug Discovery Market in Germany, 2022-2035 (USD Million)
- Figure 15.26 AI-based Drug Discovery Market in Spain, 2022-2035 (USD Million)
- Figure 15.27 AI-based Drug Discovery Market in Italy, 2022-2035 (USD Million)
- Figure 15.28 AI-based Drug Discovery Market in Rest of Europe, 2022 - 2035 (USD Million)
- Figure 15.29 AI-based Drug Discovery Market in Asia Pacific, 2022-2035 (USD Million)
- Figure 15.30 AI-based Drug Discovery Market in China, 2022-2035 (USD Million)
- Figure 15.31 AI-based Drug Discovery Market in India, 2022-2035 (USD Million)
- Figure 15.32 AI-based Drug Discovery Market in Japan, 2022-2035 (USD Million)
- Figure 15.33 AI-based Drug Discovery Market in Australia, 2022-2035 (USD Million)
- Figure 15.34 AI-based Drug Discovery Market in South Korea, 2022-2035 (USD Million)
- Figure 15.35 AI-based Drug Discovery Market in MENA, 2022-2035 (USD Million)
- Figure 15.36 AI-based Drug Discovery Market in Saudi Arabia, 2022-2035 (USD Million)
- Figure 15.37 AI-based Drug Discovery Market in UAE, 2022-2035 (USD Million)
- Figure 15.38 AI-based Drug Discovery Market in Iran, 2022-2035 (USD Million)
- Figure 15.39 AI-based Drug Discovery Market in Latin America, 2022-2035 (USD Million)
- Figure 15.40 AI-based Drug Discovery Market in Argentina, 2022-2035 (USD Million)
- Figure 15.41 AI-based Drug Discovery Market in Rest of the World, 2022-2035 (USD Million)
- Figure 16.1 Concluding Remarks: Current Market Landscape
- Figure 16.2 Concluding Remarks: Partnerships and Collaborations
- Figure 16.3 Concluding Remarks: Funding and Investments
- Figure 16.4 Concluding Remarks: Patent Analysis
- Figure 16.5 Concluding Remarks: Company Valuation Analysis
- Figure 16.6 Concluding Remarks: Cost Saving Analysis
- Figure 16.7 Concluding Remarks: Market Forecast
List Of Tables
- Table 4.1 AI-based Drug Discovery Service / Technology Providers: Information on Year of Establishment, Company Size, Location of Headquarters, Number and Name of Platforms / Tools Available
- Table 4.2 AI-based Drug Discovery Service / Technology Providers: Information on Type of AI Technology and Drug Discovery Steps
- Table 4.3 AI-based Drug Discovery Service / Technology Providers: Information on Type of Drug Molecule and Target Therapeutic Area
- Table 5.1 Leading AI-based Drug Discovery Service / Technology Providers in North America
- Table 5.2 Atomwise: Company Snapshot
- Table 5.3 Atomwise: AI-based Drug Discovery Technologies
- Table 5.4 Atomwise: Recent Developments and Future Outlook
- Table 5.5 BioSyntagma: Company Snapshot
- Table 5.6 BioSyntagma: AI-based Drug Discovery Technologies
- Table 5.7 BioSyntagma: Recent Developments and Future Outlook
- Table 5.8 Collaborations Pharmaceuticals: Company Snapshot
- Table 5.9 Collaborations Pharmaceuticals: AI-based Drug Discovery Technologies
- Table 5.10 Collaborations Pharmaceuticals: Recent Developments and Future Outlook
- Table 5.11 Cyclica: Company Snapshot
- Table 5.12 Cyclica: AI-based Drug Discovery Technologies
- Table 5.13 Cyclica: Recent Developments and Future Outlook
- Table 5.14 InveniAI: Company Snapshot
- Table 5.15 InveniAI: AI-based Drug Discovery Technologies
- Table 5.16 InveniAI: Recent Developments and Future Outlook
- Table 5.17 Recursion Pharmaceuticals: Company Snapshot
- Table 5.18 Recursion Pharmaceuticals: AI-based Drug Discovery Technologies
- Table 5.19 Recursion Pharmaceuticals: Recent Developments and Future Outlook
- Table 5.20 Valo Health: Company Snapshot
- Table 5.21 Valo Health: AI-based Drug Discovery Technologies
- Table 5.22 Valo Health: Recent Developments and Future Outlook
- Table 6.1 Leading AI-based Drug Discovery Service / Technology Providers in Europe
- Table 6.2 Aiforia Technologies: Company Snapshot
- Table 6.3 Aiforia Technologies: AI-based Drug Discovery Technologies
- Table 6.4 Aiforia Technologies: Recent Developments and Future Outlook
- Table 6.5 Chemalive: Company Snapshot
- Table 6.6 Chemalive: AI-based Drug Discovery Technologies
- Table 6.7 Chemalive: Recent Developments and Future Outlook
- Table 6.8 DeepMatter: Company Snapshot
- Table 6.9 DeepMatter: AI-based Drug Discovery Technologies
- Table 6.10 DeepMatter: Recent Developments and Future Outlook
- Table 6.11 Exscientia: Company Snapshot
- Table 6.12 Exscientia: AI-based Drug Discovery Technologies
- Table 6.13 Exscientia: Recent Developments and Future Outlook
- Table 6.14 MAbSilico: Company Snapshot
- Table 6.15 MAbSilico: AI-based Drug Discovery Technologies
- Table 6.16 MAbSilico: Recent Developments and Future Outlook
- Table 6.17 Optibrium: Company Snapshot
- Table 6.18 Optibrium: AI-based Drug Discovery Technologies
- Table 6.19 Optibrium: Recent Developments and Future Outlook
- Table 6.20 Sensyne Health: Company Snapshot
- Table 6.21 Sensyne Health: AI-based Drug Discovery Technologies
- Table 6.22 Sensyne Health: Recent Developments and Future Outlook
- Table 7.1 Leading AI-based Drug Discovery Service / Technology Providers in Asia Pacific
- Table 7.2 3BIGS: Company Snapshot
- Table 7.3 3BIGS: AI-based Drug Discovery Technologies
- Table 7.4 3BIGS: Recent Developments and Future Outlook
- Table 7.5 Gero: Company Snapshot
- Table 7.6 Gero: AI-based Drug Discovery Technologies
- Table 7.7 Gero: Recent Developments and Future Outlook
- Table 7.8 Insilico Medicine: Company Snapshot
- Table 7.9 Insilico Medicine: AI-based Drug Discovery Technologies
- Table 7.10 Insilico Medicine: Recent Developments and Future Outlook
- Table 7.11 KeenEye: Company Snapshot
- Table 7.12 KeenEye: AI-based Drug Discovery Technologies
- Table 7.13 KeenEye: Recent Developments and Future Outlook
- Table 8.1 AI-based Drug Discovery Service / Technology Providers: List of Partnerships and Collaborations, 2009-2022
- Table 9.1 AI-based Drug Discovery Service / Technology Providers: List of Funding and Investments, 2006-2022
- Table 10.1 Patent Analysis: Prominent CPC Symbols
- Table 10.2 Patent Analysis: Most Popular CPC Symbols
- Table 10.3 Patent Analysis: List of Top CPC Symbols
- Table 10.4 Patent Analysis: Summary of Benchmarking Analysis
- Table 10.5 Patent Analysis: Categorization based on Weighted Valuation Scores
- Table 10.6 Patent Portfolio: List of Leading Patents (in terms of Highest Relative Valuation)
- Table 10.7 Patent Portfolio: List of Leading Patents (in terms of Number of Citations)
- Table 11.1. Company Valuation Analysis: Weighted Average Score
- Table 11.2. Company Valuation Analysis: Estimated Valuation
- Table 17.1 Aigenpulse: Company Snapshot
- Table 17.2 Cloud Pharmaceuticals: Company Snapshot
- Table 17.3 DEARGEN: Company Snapshot
- Table 17.4 Intelligent Omics: Company Snapshot
- Table 17.5 Pepticom: Company Snapshot
- Table 17.6 Sage-N Research: Company Snapshot
- Table 18.1 AI-based Drug Discovery: Distribution by Year of Establishment
- Table 18.2 AI-based Drug Discovery: Distribution by Company Size
- Table 18.3 AI-based Drug Discovery: Distribution by Location of Headquarters (Region-Wise)
- Table 18.4 AI-based Drug Discovery: Distribution by Location of Headquarters (Country-Wise)
- Table 18.5 AI-based Drug Discovery: Distribution by Company Size and Location of Headquarters
- Table 18.6 AI-based Drug Discovery: Distribution by Type of Company
- Table 18.7 AI-based Drug Discovery: Distribution by Type of AI Technology
- Table 18.8 AI-based Drug Discovery: Distribution by Drug Discovery Steps
- Table 18.9 AI-based Drug Discovery: Distribution by Type of Drug Molecule
- Table 18.10. AI-based Drug Discovery: Distribution by Drug Development Initiatives
- Table 18.11 AI-based Drug Discovery: Distribution by Technology Licensing Option
- Table 18.12 AI-based Drug Discovery: Distribution by Target Therapeutic Area
- Table 18.13 AI-based Drug Discovery: Distribution by Number of Platforms / Tools Available
- Table 18.14 Partnerships and Collaborations: Cumulative Year-wise Trend
- Table 18.15 Partnerships and Collaborations: Distribution by Type of Partnership
- Table 18.16 Partnerships and Collaborations: Distribution by Year and Type of Partnership
- Table 18.17 Partnerships and Collaborations: Distribution by Target Therapeutic Area
- Table 18.18 Partnerships and Collaborations: Distribution by Focus Area
- Table 18.19 Partnerships and Collaborations: Distribution by Year of Partnership and Focus Area
- Table 18.20 Partnerships and Collaborations: Distribution by Type of Partner Company
- Table 18.21 Partnerships and Collaborations: Distribution by Type of Partner Company and Type of Partnerships
- Table 18.22 Most Active Players: Distribution by Number of Partnerships
- Table 18.23 Partnerships and Collaborations: Distribution of Intercontinental and Intracontinental Deals
- Table 18.24 Partnerships and Collaborations: Distribution of International and Local Deals
- Table 18.25 Funding and Investment Analysis: Cumulative Year-wise Distribution of Funding Instances, 2006-2022
- Table 18.26 Funding and Investment Analysis: Cumulative Year-wise Distribution of Amount Invested (USD Million), 2006-2022
- Table 18.27 Funding and Investment Analysis: Distribution of Instances by Type of Funding
- Table 18.28 Funding and Investment Analysis: Distribution of Amount Invested by Type of Funding (USD Million)
- Table 18.29 Funding and Investment Analysis: Distribution of Amount Invested by Year and Type of Funding (USD Million)
- Table 18.30 Funding and Investment Analysis: Distribution of Amount Invested by Company Size (USD Million)
- Table 18.31 Funding and Investment Analysis: Distribution of Funding Instances by Type of Investor
- Table 18.32 Funding and Investment Analysis: Distribution of Amount Invested by Investor (USD Million)
- Table 18.33 Most Active Players: Distribution by Number of Funding Instances
- Table 18.34 Most Active Players: Distribution by Amount Invested
- Table 18.35 Most Active Investors: Distribution by Number of Funding Instances
- Table 18.36 Funding and Investment: Distribution of Amount Invested by Region (USD Million)
- Table 18.37 Funding and Investment: Distribution of Amount Invested by Geography (Country-wise) (USD Million)
- Table 18.38 Patent Analysis: Distribution by Type of Patent
- Table 18.39 Patent Analysis: Distribution by Year of Publication
- Table 18.40 Patent Analysis: Distribution by Location of Patent Jurisdiction (Region-wise)
- Table 18.41 Patent Analysis: Distribution by Location of Patent Jurisdiction (Country-wise)
- Table 18.42 Patent Analysis: Distribution by CPC Symbols
- Table 18.43 Patent Analysis: Emerging Focus Area
- Table 18.44 Patent Analysis: Cumulative Year-wise Distribution by Type of Applicant
- Table 18.45 Leading Industry Players: Distribution by Number of Patents
- Table 18.46 Leading Non-Industry Players: Distribution by Number of Patents
- Table 18.47 Leading Patent Assignees: Distribution by Number of Patents
- Table 18.48 Patent Benchmarking: Distribution of Leading Industry Player by Patent Characteristics (CPC Symbols)
- Table 18.49 Patent Analysis: Distribution by Age
- Table 18.50 Patent Analysis: Patent Valuation
- Table 18.51 Company Valuation Analysis: Categorization by Employee Score
- Table 18.52 Company Valuation Analysis: Categorization by Experience Score
- Table 18.53 Company Valuation Analysis: Categorization by Portfolio Score
- Table 18.54 Company Valuation Analysis: Categorization by Partnerships Score
- Table 18.55 Company Valuation Analysis: Categorization by Funding Score
- Table 18.56 Company Valuation Analysis: Categorization by Weighted Average Score
- Table 18.57 Overall Cost Saving Potential Associated with Use of AI-based Solutions in Drug Discovery, 2022-2035 (USD Million)
- Table 18.58 Likely Cost Savings: Distribution by Drug Discovery Steps, 2022-2035 (USD Million)
- Table 18.59 Likely Cost Savings During Target Identification / Validation, 2022-2035 (USD Million)
- Table 18.60 Likely Cost Savings During Hit Generation / Lead Identification, 2022-2035 (USD Million)
- Table 18.61 Likely Cost Savings During Lead Optimization, 2022-2035 (USD Million)
- Table 18.62 Likely Cost Savings: Distribution by Target Therapeutic Area, 2022-2035 (USD Million)
- Table 18.63 Likely Cost Savings for Drugs Targeting Oncological Disorders, 2022-2035 (USD Million)
- Table 18.64 Likely Cost Savings for Drugs Targeting Neurological Disorders, 2022-2035 (USD Million)
- Table 18.65 Likely Cost Savings for Drugs Targeting Infectious Diseases, 2022-2035 (USD Million)
- Table 18.66 Likely Cost Savings for Drugs Targeting Respiratory Disorders, 2022-2035 (USD Million)
- Table 18.67 Likely Cost Savings for Drugs Targeting Cardiovascular Disorders, 2022-2035 (USD Million)
- Table 18.68 Likely Cost Savings for Drugs Targeting Endocrine Disorders, 2022-2035 (USD Million)
- Table 18.69 Likely Cost Savings for Drugs Targeting Gastrointestinal Disorders, 2022-2035 (USD Million)
- Table 18.70 Likely Cost Savings for Drugs Targeting Musculoskeletal Disorders, 2022-2035 (USD Million)
- Table 18.71 Likely Cost Savings for Drugs Targeting Immunological Disorders, 2022-2035 (USD Million)
- Table 18.72 Likely Cost Savings for Drugs Targeting Dermatological Disorders, 2022-2035 (USD Million)
- Table 18.73 Likely Cost Savings for Drugs Targeting Other Disorders, 2022-2035 (USD Million)
- Table 18.74 Likely Cost Savings: Distribution by Geography, 2022-2035 (USD Million)
- Table 18.75 Likely Cost Savings in North America, 2022-2035 (USD Million)
- Table 18.76 Likely Cost Savings in Europe, 2022-2035 (USD Million)
- Table 18.77 Likely Cost Savings in Asia Pacific, 2022-2035 (USD Million)
- Table 18.78 Likely Cost Savings in MENA, 2022-2035 (USD Million)
- Table 18.80 Likely Cost Savings in Latin America, 2022-2035 (USD Million)
- Table 18.81 Likely Cost Savings in Rest of the World, 2022-2035 (USD Million)
- Table 18.82 Global AI-based Drug Discovery Market, Conservative, Base and Optimistic Scenarios, 2022-2035 (USD Million)
- Table 18.83 AI-based Drug Discovery Market: Distribution by Drug Discovery Steps, 2022-2035 (USD Million)
- Table 18.84 AI-based Drug Discovery Market for Target Identification / Validation, Conservative, Base and Optimistic Scenarios, 2022-2035 (USD Million)
- Table 18.85 AI-based Drug Discovery Market for Hit Generation / Lead Identification, Conservative, Base and Optimistic Scenarios, 2022-2035 (USD Million)
- Table 18.86 AI-based Drug Discovery Market for Lead Optimization, Conservative, Base and Optimistic Scenarios, 2022-2035 (USD Million)
- Table 18.87 AI-based Drug Discovery Market: Distribution by Target Therapeutic Area, 2022-2035 (USD Million)
- Table 18.88 AI-based Drug Discovery Market for Oncological Disorders, Conservative, Base and Optimistic Scenarios, 2022-2035 (USD Million)
- Table 18.89 AI-based Drug Discovery Market for Neurological Disorders Conservative, Base and Optimistic Scenarios, 2022-2035 (USD Million)
- Table 18.90 AI-based Drug Discovery Market for Infectious Diseases, Conservative, Base and Optimistic Scenarios, 2022-2035 (USD Million)
- Table 18.90 AI-based Drug Discovery Market for Respiratory Disorders, Conservative, Base and Optimistic Scenarios, 2022-2035 (USD Million)
- Table 18.91 AI-based Drug Discovery Market for Cardiovascular Disorders, Conservative, Base and Optimistic Scenarios, 2022-2035 (USD Million)
- Table 18.92 AI-based Drug Discovery Market for Endocrine Disorders, Conservative, Base and Optimistic Scenarios, 2022-2035 (USD Million)
- Table 18.93 AI-based Drug Discovery Market for Gastrointestinal Disorders, Conservative, Base and Optimistic Scenarios, 2022-2035 (USD Million)
- Table 18.94 AI-based Drug Discovery Market for Musculoskeletal Disorders, Conservative, Base and Optimistic Scenarios, 2022-2035 (USD Million)
- Table 18.95 AI-based Drug Discovery Market for Immunological Disorders, Conservative, Base and Optimistic Scenarios, 2022-2035 (USD Million)
- Table 18.96 AI-based Drug Discovery Market for Dermatological Disorders, Conservative, Base and Optimistic Scenarios, 2022-2035 (USD Million)
- Table 18.97 AI-based Drug Discovery Market for Other Disorders, Conservative, Base and Optimistic Scenarios, 2022-2035 (USD Million)
- Table 18.98 AI-based Drug Discovery Market: Distribution by Geography, 2022-2035 (USD Million)
- Table 18.99 AI-based Drug Discovery Market in North America, Conservative, Base and Optimistic Scenarios, 2022-2035 (USD Million)
- Table 18.100 AI-based Drug Discovery Market in the US, Conservative, Base and Optimistic Scenarios, 2022-2035 (USD Million)
- Table 18.101 AI-based Drug Discovery Market in Canada, Conservative, Base and Optimistic Scenarios, 2022-2035 (USD Million)
- Table 18.102 AI-based Drug Discovery Market in Europe, Conservative, Base and Optimistic Scenarios, 2022-2035 (USD Million)
- Table 18.103 AI-based Drug Discovery Market in UK, Conservative, Base and Optimistic Scenarios, 2022-2035 (USD Million)
- Table 18.104 AI-based Drug Discovery Market in France, Conservative, Base and Optimistic Scenarios, 2022-2035 (USD Million)
- Table 18.105 AI-based Drug Discovery Market in Germany, Conservative, Base and Optimistic Scenarios, 2022-2035 (USD Million)
- Table 18.106 AI-based Drug Discovery Market in Spain, Conservative, Base and Optimistic Scenarios, 2022-2035 (USD Million)
- Table 18.107 AI-based Drug Discovery Market in Italy, Conservative, Base and Optimistic Scenarios, 2022-2035 (USD Million)
- Table 18.108 AI-based Drug Discovery Market in Rest of Europe, Conservative, Base and Optimistic Scenarios, 2022-2035 (USD Million)
- Table 18.109 AI-based Drug Discovery Market in Asia Pacific, Conservative, Base and Optimistic Scenarios, 2022-2035 (USD Million)
- Table 18.110 AI-based Drug Discovery Market in China, Conservative, Base and Optimistic Scenarios, 2022-2035 (USD Million)
- Table 18.111 AI-based Drug Discovery Market in India, Conservative, Base and Optimistic Scenarios, 2022-2035 (USD Million)
- Table 18.112 AI-based Drug Discovery Market in Japan, Conservative, Base and Optimistic Scenarios, 2022-2035 (USD Million)
- Table 18.113 AI-based Drug Discovery Market in Australia, Conservative, Base and Optimistic Scenarios, 2022-2035 (USD Million)
- Table 18.114 AI-based Drug Discovery Market in South Korea, Conservative, Base and Optimistic Scenarios, 2022-2035 (USD Million)
- Table 18.115 AI-based Drug Discovery Market in MENA, Conservative, Base and Optimistic Scenarios, 2022-2035 (USD Million)
- Table 18.116 AI-based Drug Discovery Market in Saudi Arabia, Conservative, Base and Optimistic Scenarios, 2022-2035 (USD Million)
- Table 18.117 AI-based Drug Discovery Market in UAE, Conservative, Base and Optimistic Scenarios, 2022-2035 (USD Million)
- Table 18.118 AI-based Drug Discovery Market in Iran, Conservative, Base and Optimistic Scenarios, 2022-2035 (USD Million)
- Table 18.119 AI-based Drug Discovery Market in Latin America, Conservative, Base and Optimistic Scenarios, 2022-2035 (USD Million)
- Table 18.120 AI-based Drug Discovery Market in Argentina, Conservative, Base and Optimistic Scenarios, 2022-2035 (USD Million)
- Table 18.121 AI-based Drug Discovery Market in Rest of the World, Conservative, Base and Optimistic Scenarios, 2022-2035 (USD Million)
- Read More
List Of Companies
The following companies / institutes / government bodies and organizations have been mentioned in this report.
- 1. 3BIGS
- 2. 3W Healthcare Fund
- 3. 3W Partners
- 4. 4B Technologies
- 5. 5Y Capital
- 6. 6 Dimensions Capital
- 7. 8VC
- 8. 99andBeyond
- 9. A2A Pharmaceuticals
- 10. A2i Therapeutics
- 11. AARP Foundation
- 12. AbbVie
- 13. AbCellera
- 14. Absci
- 15. Abstract Ventures
- 16. Accelerate Long Island
- 17. Accenture
- 18. Accutar Biotech
- 19. Acellera
- 20. Acequia Capital
- 21. Acerand Therapeutics
- 22. ACF Investors
- 23. AcuraStem
- 24. Adagene
- 25. Adare Pharma Solutions
- 26. ADC Therapeutics
- 27. ADEL
- 28. adMare BioInnovations
- 29. Advantage Capital
- 30. AdventHealth
- 31. Adynxx
- 32. Aganitha
- 33. Agent Capital
- 34. AI Therapeutics
- 35. Ai Vedam Technologies
- 36. AI VIVO
- 37. Ai-biopharma
- 38. Aiforia
- 39. Aigenpulse
- 40. Air Street Capital
- 41. Ajou University
- 42. Akashi Therapeutics
- 43. Aktia Nordic Micro Cap
- 44. Albany Molecular Research
- 45. A-Level Capital
- 46. Alexandria Real Estate Equities
- 47. Alexandria Venture Investments
- 48. Allcyte
- 49. Allergan
- 50. AllianThera Biopharma
- 51. Allosteric Bioscience
- 52. Almirall
- 53. Alphanosos
- 54. ALS Association
- 55. ALS Investment Fund
- 56. Altos Ventures
- 57. Amadeus Capital Partners
- 58. AME Cloud Ventures
- 59. Amgen Ventures
- 60. Amidi
- 61. Ampel Biosolutions
- 62. Amplify Partners
- 63. Amplitude
- 64. Amyloid Solution
- 65. Anagenesis Biotechnologies
- 66. Andreessen Horowitz
- 67. Angios
- 68. Anima Biotech
- 69. Ansa Biotechnologies
- 70. Antengene
- 71. Antiverse
- 72. Apeiron Therapeutics
- 73. ApexQubit
- 74. APRINOIA Therapeutics
- 75. Aqemia
- 76. Arbutus Biopharma
- 77. ARCH Venture Partners
- 78. Arctoris
- 79. Ardigen
- 80. Aria Pharmaceuticals
- 81. Arpeggio
- 82. ArrowMark Partners
- 83. ARTIS Ventures
- 84. Arzeda
- 85. Asset Management Ventures
- 86. Astellas Pharma
- 87. Astia
- 88. AstraZeneca
- 89. Astrogen
- 90. atai Life Sciences
- 91. Ataxia
- 92. Atinum Investment
- 93. Atlantic Labs
- 94. Atlas Venture
- 95. Atomico
- 96. Atomwise
- 97. Atrius Health
- 98. AUM Biosciences
- 99. Auransa
- 100. Aurinvest
- 101. Autism Impact Fund
- 102. AV8 Ventures
- 103. AVIC Trust
- 104. Avidity Partners
- 105. B Capital Group
- 106. BABEL Ventures
- 107. Baidu Ventures
- 108. Balderton Capital
- 109. Bangarang
- 110. BASSETTI
- 111. Baupost
- 112. Bavarian Nordic
- 113. Bayer
- 114. Beiersdorf
- 115. BenevolentAI
- 116. BERG
- 117. Better Ventures
- 118. Bezos Expeditions
- 119. BigHat Biosciences
- 120. Bill & Melinda Gates Foundation
- 121. BioAge Labs
- 122. Bioeconomy Capital
- 123. BioFocus DPI
- 124. Biogen
- 125. BioLizard
- 126. Biolojic Design
- 127. BioMarin Pharmaceutical
- 128. Biomea Fusion
- 129. BioMotiv
- 130. BioPharmics
- 131. Biorelate
- 132. Biortus
- 133. Bios Partners
- 134. BioSymetrics
- 135. bioSyntagma
- 136. biotx.ai
- 137. BioVentures MedTech Funds
- 138. Bioverge
- 139. Biovista
- 140. BioXcel Therapeutics
- 141. BlackRock
- 142. Bloomberg Beta
- 143. Blue Bear Ventures
- 144. Blue Oak Pharmaceuticals
- 145. bluebird bio
- 146. Boehringer Ingelheim
- 147. Bold Capital Partners
- 148. Bpifrance
- 149. Brace Pharma Capital
- 150. Brain Canada
- 151. Breakout Labs
- 152. BridgeBio Pharma
- 153. Brigham and Women's Hospital
- 154. Brightspark Ventures
- 155. Bristol Myers Squibb
- 156. btov
- 157. Buck Institute for Research on Aging
- 158. Builders VC
- 159. Bulba Ventures
- 160. Busolantix Investment
- 161. BVF Partners
- 162. C4X Discovery
- 163. CaaS Capital Management
- 164. Caffeinated Capital
- 165. Califia Pharma
- 166. California Institute for Biomedical Research
- 167. California Institute for Regenerative Medicine
- 168. CALYM Carnot Institute
- 169. Cambia Health Solutions
- 170. Cambridge Angels
- 171. Cambridge Cancer Genomics
- 172. Cambridge Crystallographic Data Center
- 173. Cambridge Enterprise
- 174. Cambridge Research for International Research
- 175. Cambridge University Hospitals NHS Foundation Trust
- 176. Cantos Ventures
- 177. CARB-X
- 178. CaroCure
- 179. Casdin Capital
- 180. Catalio Capital Management
- 181. Catapult Ventures
- 182. Cathay Innovation
- 183. Causaly
- 184. CB Clean Lux
- 185. CDH Investments
- 186. Celgene
- 187. Cellarity
- 188. Celsius Therapeutics
- 189. Center for the Development of Industrial Technology (CDTI)
- 190. CENTOGENE
- 191. Cerebras
- 192. Cerevel Therapeutics
- 193. Charcot-Marie-Tooth
- 194. Charles River Laboratories
- 195. Chartered Group
- 196. ChemAlive
- 197. Chemaxon
- 198. ChemDiv
- 199. ChemPass
- 200. Chiesi Farmaceutici
- 201. Children's Tumor Foundation (CTF)
- 202. China Canada Angels Alliance
- 203. China Life Healthcare Fund
- 204. China Oncology Focus
- 205. Chinese Academy of Medical Sciences
- 206. Cigna Ventures
- 207. City Hill Ventures
- 208. Civilization Ventures
- 209. CJ HEALTHCARE
- 210. Claremont Creek Ventures
- 211. Clarus Ventures
- 212. Cleveland Clinic
- 213. CLI Ventures
- 214. Cloud Pharmaceuticals
- 215. CM-CIC Innovation
- 216. CMT Research Foundation (CMTRF)
- 217. Coatue
- 218. Code Ocean
- 219. Collaborations Pharmaceuticals
- 220. Collaborative Drug Discovery
- 221. Collective Scientific
- 222. Colorcon Ventures
- 223. Colt Ventures
- 224. Computational biology
- 225. Congressionally Directed Medical Research Programs (CDMRP)
- 226. Conifer Point Pharmaceuticals
- 227. Cormorant Asset Management
- 228. Cortex Discovery
- 229. Cosine
- 230. Cota Capital
- 231. Courier Therapeutics
- 232. COVID-19 Vaccine Corporation (CVC)
- 233. CPE
- 234. CPP Investments
- 235. CQDM
- 236. Creative Destruction Lab
- 237. Cresset
- 238. CRV
- 239. CrystalGenomics
- 240. CTI Life Sciences Fund
- 241. Cultivian Sandbox Ventures
- 242. Cyclica
- 243. CytoReason
- 244. Daewoong Pharmaceuticals
- 245. Daily Partners
- 246. Danhua Venture Capital (DHVC)
- 247. Dante Labs
- 248. Data2Discovery
- 249. Data4cure
- 250. Datavant
- 251. DCVC
- 252. Deargen
- 253. Debiopharm
- 254. Deep Genomics
- 255. Deep Knowledge Ventures
- 256. Deep Track Capital
- 257. DeepCure
- 258. DeepMatter
- 259. DeepTrait
- 260. Deerfield Management
- 261. DEFTA Partners
- 262. Delin Ventures
- 263. Denali Therapeutics
- 264. Denovicon Therapeutics
- 265. Denovium
- 266. Department of Health and Social Care (DHSC)
- 267. Development Bank of Wales
- 268. DEXSTR
- 269. Diamond Light Source
- 270. Dolby Family Ventures
- 271. Dow AgroSciences
- 272. Driehaus Capital Management
- 273. Drive Capital
- 274. Droia Ventures
- 275. Drugs for Neglected Diseases initiative (DNDi)
- 276. dRx Capital
- 277. DSC Investment
- 278. Dualogics
- 279. Dynamk Capital
- 280. Dyno Therapeutics
- 281. Echo Health Ventures
- 282. EcoR1 Capital
- 283. EDBI
- 284. Edge Capital
- 285. eFlasks
- 286. EIC Accelerator
- 287. Eight Roads Ventures
- 288. EIT Climate-KIC
- 289. Elevian
- 290. Eli Lilly
- 291. Elsevier
- 292. Elucidata
- 293. Empire State Development (ESD)
- 294. Empirico
- 295. Enamine
- 296. Endogena Therapeutics
- 297. Endure Capital
- 298. Engine Biosciences
- 299. Enterprise Ireland
- 300. Envisagenics
- 301. Epic Capital Management
- 302. EPIC Ventures
- 303. Epicombi Therapeutics
- 304. Epredia
- 305. EQRx
- 306. Erasca
- 307. e-therapeutics
- 308. Euretos
- 309. European Bank for Reconstruction and Development (EBRD)
- 310. European Investment Bank
- 311. European Union
- 312. Eurostars
- 313. Evaxion Biotech
- 314. Everest Medicines
- 315. Evotec
- 316. Ewha Womans University
- 317. Excelra
- 318. Executive Agency for Small and Medium-sized Enterprises (EASME)
- 319. Exelixis
- 320. Exscientia
- 321. Facio Therapies
- 322. Farallon Capital
- 323. Federal Economic Development Agency for Southern Ontario
- 324. Felicis Ventures
- 325. Ferring Pharmaceuticals
- 326. Fidelity Asia Fund
- 327. Fidelity Biosciences
- 328. Fidelity Management & Research Company
- 329. Financière Boscary
- 330. FinLab EOS VC
- 331. First Round Capital
- 332. First Star Ventures
- 333. Flagship Pioneering
- 334. Foresite Capital
- 335. Forma Therapeutics
- 336. Formic Ventures
- 337. Foundation for Angelman Syndrome Therapeutics (FAST)
- 338. Founders Factory
- 339. Founders Fund
- 340. Fountain Therapeutics
- 341. Fox Chase Cancer Center
- 342. F-Prime Capital (Formerly known as Fidelity Biosciences)
- 343. Frazier Life Sciences
- 344. Frees Fund
- 345. Friedreich's Ataxia Research Alliance (FARA)
- 346. Frontier Medicines
- 347. FundersClub
- 348. Future Ventures
- 349. FutuRx
- 350. G3 Therapeutics
- 351. Galapagos
- 352. Gaorong Capital
- 353. Garage Capital
- 354. Gatehouse Bio
- 355. GC Pharma
- 356. Genentech
- 357. General Atlantic
- 358. General Catalyst
- 359. Genesen
- 360. Genesis Therapeutics
- 361. GenFleet Therapeutics
- 362. Genialis
- 363. GenoKey ApS
- 364. Genomatica
- 365. Genome Biologics
- 366. Genomics England
- 367. Genuity Science
- 368. Gero
- 369. Gi Global Health Fund LP
- 370. Gilead Sciences
- 371. GlaxoSmithKline
- 372. Global Brain
- 373. Global Founders Capital
- 374. Global Genomics Series
- 375. GM&C Life Sciences Fund
- 376. GNS Healthcare
- 377. Golden Ventures
- 378. Goodman Capital
- 379. Google
- 380. Gopher Asset Management
- 381. Gordian
- 382. Government of Canada
- 383. Government of Switzerland
- 384. GP Healthcare Capital
- 385. GPG Ventures
- 386. Grand Challenges Canada
- 387. GrayMatter
- 388. Great Ormond Street Hospital
- 389. Greater Paris University Hospitals - AP-HP
- 390. Green Park & Golf Ventures
- 391. GreenSky Capital
- 392. Gritstone Oncology
- 393. Grove Ventures
- 394. GT Healthcare Capital Partners
- 395. Guangdong Institute of Microbiology
- 396. Gustave Roussy
- 397. GV (formerly known as Google Ventures)
- 398. Hafnium Labs
- 399. Hampshire Hospitals NHS Foundation Trust
- 400. Hana Ventures
- 401. Hanmi Pharmaceutical
- 402. Hansoh Pharma
- 403. Harbour Antibodies
- 404. Harbour BioMed
- 405. Harris & Harris
- 406. Harvard Innovation Labs
- 407. Haystack Science
- 408. HBM Healthcare Investments
- 409. HCS Pharma
- 410. Health Wildcatters
- 411. HealthInc
- 412. Healx
- 413. Helmholtz Institute for Pharmaceutical Research Saarland (HIPS)
- 414. Heritage Provider Network
- 415. HEWLETT PACKARD
- 416. Hibiskus BioPharma
- 417. Hike Ventures
- 418. Hinge Therapeutics
- 419. Hiventures
- 420. HLTH
- 421. HOF Capital
- 422. HotSpot Therapeutics
- 423. Hoxton Ventures
- 424. Huadong Medicine
- 425. Human Capital
- 426. Humonic
- 427. Huons
- 428. Hyperplane Venture Capital
- 429. IA Ventures
- 430. IBM Research
- 431. IBM TechU
- 432. ICHOR
- 433. IDG Capital
- 434. Iktos
- 435. IMM Investment
- 436. ImmuMap Services
- 437. ImmuneMed
- 438. Immunocure
- 439. Impact Therapeutics
- 440. Index Ventures
- 441. IndieBio
- 442. Indivumed
- 443. Infinity Medical
- 444. InfoChem (acquired by DeepMatter)
- 445. InnoPharmaScreen
- 446. Innophore
- 447. Innoplexus
- 448. Innospark Ventures
- 449. Innova31
- 450. Innovate NY Fund
- 451. Innovate UK
- 452. Innovation Endeavors
- 453. Innovation Fund Denmark
- 454. Innovative Medicines Initiative (IMI)
- 455. Inovia Capital
- 456. inSili.com
- 457. Insiliance
- 458. Insilico Medicine
- 459. insitro
- 460. Institut Pasteur
- 461. Intel Capital
- 462. Intellegens
- 463. IntelliCyt
- 464. Intelligent OMICS
- 465. Intermountain Ventures
- 466. Interprotein
- 467. Intuition Systems
- 468. InveniAI
- 469. Invetx
- 470. Invus
- 471. Ionis Pharmaceuticals
- 472. IP Group
- 473. IPF Partners
- 474. IQVIA
- 475. Ireland Strategic Investment Fund (ISIF)
- 476. IRICoR
- 477. Iris Pharma
- 478. Irving Investors
- 479. I-STEM
- 480. IT-translation
- 481. IvyCap Ventures
- 482. IWAKI SEIYAKU
- 483. JADBio
- 484. Janssen
- 485. Jefferson Health
- 486. Jiangsu Chia Tai Fenghai Pharmaceutical (CTFH)
- 487. Jiangsu Hengrui Pharmaceuticals
- 488. JLABS
- 489. Johnson & Johnson
- 490. Johnson & Johnson Innovation
- 491. Jove Equity Partners
- 492. Juvena Therapeutics
- 493. Juvenescence
- 494. JW Pharmaceutical
- 495. K Cube Ventures
- 496. Kadmon
- 497. Kaiser Permanente
- 498. KB Securities
- 499. KDB Capital
- 500. Kebotix
- 501. Keen Eye
- 502. Keio University
- 503. KemPharm
- 504. Kennedy Krieger Institute
- 505. Kester Capital
- 506. Khosla Ventures
- 507. Kindred
- 508. Kinetic Discovery
- 509. King Star Capital
- 510. King's College London
- 511. Kinogen
- 512. Koch Disruptive Technologies
- 513. Kodiak Sciences
- 514. Korea Atomic Energy Research Institute
- 515. Korea Development Bank
- 516. Korea Fixed-Income Investment Advisory
- 517. Korea Investment Partners
- 518. Korea Research Institute of Chemical Technology
- 519. ksilink
- 520. KTB Network
- 521. Kuano
- 522. Kyowa Kirin
- 523. La Financiere Gaspard
- 524. Labcyte
- 525. LabGenius
- 526. LabKey
- 527. Lake Bleu Capital
- 528. Lansdowne Partners
- 529. Lantern Pharma
- 530. LanzaTech
- 531. Laurent and Benon
- 532. Laurion Capital Management
- 533. Lawrence Livermore National Laboratory
- 534. Laxai Life Sciences
- 535. LB Investment
- 536. Leaps by Bayer
- 537. Legend Capital
- 538. Leland Stanford Junior University
- 539. LEO Pharma
- 540. Lequio Pharma
- 541. Lhasa
- 542. Life Sciences Institute
- 543. LifeArc
- 544. Lifeforce Capital
- 545. LifeSci NYC
- 546. LifeSci Venture Partners
- 547. Lightspeed Venture Partners
- 548. Lilly Asia Ventures
- 549. Linguamatics
- 550. Lodo Therapeutics
- 551. Long Island Emerging Technologies Fund (LIETF)
- 552. Longevity Fund
- 553. Loup Ventures
- 554. LSP
- 555. Luminous Ventures
- 556. Lundbeck
- 557. Lux Capital
- 558. Luxembourg Centre for Systems Biomedicine (LCSB)
- 559. M12 - Microsoft's Venture Fund
- 560. MAbSilico
- 561. Macroceutics
- 562. Madrona Venture
- 563. Magnetic Ventures
- 564. Maison Capital
- 565. Manchester Tech Trust Angels
- 566. Mannin Research
- 567. Maple Capital Management
- 568. Marathon Venture Capital
- 569. MaRS Catalyst Fund
- 570. Marshall Wace
- 571. Maruho
- 572. Massachusetts Institute of Technology
- 573. Massachusetts Life Sciences Center
- 574. MassBiologics
- 575. MassChallenge
- 576. Maxygen
- 577. MBC BioLabs
- 578. Medchemica
- 579. Medirita
- 580. Memorial Sloan Kettering Cancer Center
- 581. Menlo Ventures
- 582. Menten AI
- 583. Merck
- 584. Merck Accelerator
- 585. Merck KGaA
- 586. Mercury Fund
- 587. Meridian Street Capital
- 588. Micar Innovation
- 589. Michigan State University
- 590. Microsoft
- 591. Mila
- 592. Mind the Byte
- 593. Mirae Assest Venture Investment
- 594. Mirae Asset Capital Markets
- 595. Mission: Cure
- 596. MIT delta v
- 597. Mitsui
- 598. Model Medicines
- 599. Moderna
- 600. Molecular Health
- 601. Molecule
- 602. Molecule.one
- 603. Moleculomics
- 604. Molomics
- 605. Monashee Investment Management
- 606. Monsanto Growth Ventures
- 607. Morningside
- 608. Morpheus Ventures
- 609. MPM Capital
- 610. MRL Ventures Fund
- 611. Mubadala
- 612. Multiple Myeloma Research Foundation (MMRF)
- 613. Muscular Dystrophy Association
- 614. Mutuelle d'Assurances du Corps de Sante Francais (MACSF)
- 615. myTomorrows
- 616. Nan Fung Life Sciences
- 617. Nanna Therapeutics
- 618. Nantes University Hospital
- 619. National Cancer Institute (NCI)
- 620. National Center for Advancing Translational Sciences ( NCATS )
- 621. National Centre for Research and Development
- 622. National Fertilizers
- 623. National Institute of Environmental Health Sciences (NIEHS)
- 624. National Institute of General Medical Sciences (NIGMS)
- 625. National Institute of Health (NIH)
- 626. National Institute of Neurological Disorders and Stroke (NINDS)
- 627. National Institute of Standards and Technology (NIST)
- 628. National Institute on Aging (NIA)
- 629. National Institutes of Health
- 630. National Research Council Canada
- 631. National Science Foundation (NSF)
- 632. National Science Foundation Small Business Innovation Research (NSF SBIR)Program
- 633. Nektar Therapeutics
- 634. Nest.Bio Ventures
- 635. Nestlé
- 636. Netabolics
- 637. Neuropore Therapies
- 638. NeuroTheryX
- 639. Neuroventi
- 640. New Protein Capital
- 641. New Wave Ventures
- 642. New World TMT
- 643. New York Medical College
- 644. New York Ventures
- 645. NewDo Venture
- 646. Nex Cubed
- 647. NineteenGale Therapeutics
- 648. NJF Capital
- 649. Nonacus
- 650. Northern Powerhouse Investment Fund
- 651. Notable Labs
- 652. Novartis
- 653. Novo Holdings
- 654. Novo Nordisk
- 655. Nucleai
- 656. Numedii
- 657. Numerate
- 658. Nuritas
- 659. NVIDIA
- 660. O2H Ventures
- 661. Oak Ridge National Laboratory
- 662. Obvious Ventures
- 663. OCA Ventures
- 664. OccamzRazor
- 665. Octopus Ventures
- 666. Olaris
- 667. OMNY Health
- 668. OncoArendi Therapeutics
- 669. Oncologie
- 670. Oncology Venture (Acquired by Allarity Therapeutics)
- 671. OneThree Biotech
- 672. Ono Pharmaceutical
- 673. Optibrium
- 674. Optum Ventures
- 675. OrbiMed
- 676. OS Fund
- 677. OSE Immunotherapeutics
- 678. OSEO
- 679. OurCrowd
- 680. Overkill Ventures
- 681. OVP Venture Partners
- 682. Owkin
- 683. Oxford Drug Design
- 684. Oxford University
- 685. Pacific Western Bank
- 686. Panache Ventures
- 687. PAQ Therapeutics
- 688. Parinvest
- 689. Parker Institute for Cancer Immunotherapy
- 690. Parkinson's UK
- 691. ParticleX
- 692. Partner Fund Management
- 693. Pavilion Capital
- 694. PEACCEL
- 695. Pear VC
- 696. Pending.AI
- 697. Pentech Ventures
- 698. Pepticom
- 699. Peptilogics
- 700. Peptone
- 701. Peptris Technologies
- 702. PercayAI
- 703. Perceptive Advisors
- 704. Pfizer
- 705. Pfizer Venture Investments
- 706. Pharmacelera
- 707. Pharmavite
- 708. PharmCADD
- 709. PharmEnable
- 710. Pharnext
- 711. Pharos iBio
- 712. Phenomic AI
- 713. Phi-X Capital
- 714. Phoenix Venture Partners
- 715. PhoreMost
- 716. Pi Campus
- 717. PICC Capital
- 718. Pictet
- 719. Pikas
- 720. Pivotal bioVenture Partners
- 721. Plex
- 722. Plug and Play Tech Center
- 723. Polaris Partners
- 724. Polaris Quantum Biotech
- 725. Polyclone
- 726. Polycystic Kidney Disease Charity
- 727. Porton
- 728. PostEra
- 729. PrecisionLife
- 730. Predictive Oncology
- 731. Prefix Capital
- 732. President International Development
- 733. Presight Capital
- 734. Primary Venture Partners
- 735. Primavera Capital
- 736. Prime Movers Lab
- 737. Primordial Genetics
- 738. PROSILICO
- 739. ProteinQure
- 740. ProteiQ Biosciences
- 741. Public Sector Pension Investment Board (PSP Investments)
- 742. QIAGEN
- 743. Qiming Venture Partners
- 744. Quantitative Medicine
- 745. Quiet Capital
- 746. QuLab
- 747. RA Capital Management
- 748. Radical ventures
- 749. Ramen Ventures
- 750. RaQualia Pharma
- 751. Real Ventures
- 752. RealHealthData
- 753. Receptor.AI
- 754. Recursion Pharmaceuticals
- 755. Red Cell Partners
- 756. Redalpine
- 757. Redbiotec
- 758. Redmile Group
- 759. Redpoint Ventures
- 760. Refactor Capital
- 761. Regional Cancer Centre (RCC)
- 762. Regional Council of Auvergne-Rhône-Alpes
- 763. Rejuveron Life Sciences
- 764. Relation Therapeutics
- 765. Relay Therapeutics
- 766. RELIEF THERAPEUTICS
- 767. Remedium AI
- 768. Reneo Capital
- 769. Renren
- 770. Repare Therapeutics
- 771. REPROCELL
- 772. Repurpose.AI
- 773. Research Triangle Park
- 774. Resonant Therapeutics
- 775. Revelation Partners
- 776. Reverie Labs
- 777. ReviveMed
- 778. Ridgeback Capital Investments
- 779. Rigetti Computing
- 780. Rising Tide Fund
- 781. Rivas Capital
- 782. Roche
- 783. Rock Springs Capital
- 784. Romulus Capital
- 785. Rough Draft Ventures
- 786. RRJ Capital
- 787. RT Partners
- 788. RwHealth
- 789. Ryerson University
- 790. Saehan Venture Capital
- 791. Sage Partners
- 792. Sage-N Research
- 793. Saint Louis University
- 794. Samsara BioCapital
- 795. Samyang
- 796. Sanabil Investments
- 797. Sanford Burnham Prebys
- 798. Sanofi
- 799. Santen Pharmaceutical
- 800. Sapir Venture Partners
- 801. Sarepta Therapeutics
- 802. SARomics Biostructures
- 803. Saverna Therapeutics
- 804. SciFi Technology Systems
- 805. Scottish Mortgage Investment Trust
- 806. Scripps Research
- 807. SD Biosensor
- 808. Sea Lane Ventures
- 809. Searchbolt
- 810. Sedec Therapeutics
- 811. Selvita
- 812. Sema4
- 813. SEngine Precision Medicine
- 814. Sensyne Health
- 815. Sentauri
- 816. Sequoia Capital
- 817. Seraph Group
- 818. Serra Ventures
- 819. Servier
- 820. Seventure Partners
- 821. Sheba
- 822. Sheffield Institute
- 823. Shionogi
- 824. Shivom
- 825. Shuimu BioSciences
- 826. Sidney Kimmel Comprehensive Cancer Center
- 827. SIG
- 828. SignalChem Lifesciences
- 829. Signet Therapeutics
- 830. Silexon
- 831. Sinequa
- 832. Singleron Biotechnologies
- 833. Sino Biopharmaceutical
- 834. Sinopia Biosciences
- 835. Sinovation Ventures
- 836. Sirenas
- 837. SK Biopharmaceuticals
- 838. SK Chemicals
- 839. Small Business Innovation Research (SBIR)
- 840. Smilegate Investment
- 841. Socium
- 842. Sofinnova Partners
- 843. SoftBank Ventures
- 844. SoftBank Vision Fund
- 845. Solasta Ventures
- 846. Solve ME/CFS Initiative
- 847. SOM Biotech
- 848. Sookmyung Women's University
- 849. Sosei Heptares
- 850. SOSV
- 851. SparkBeyond
- 852. Sparta
- 853. Spektron Systems
- 854. Sphera Funds Management
- 855. Spring Discovery
- 856. SR One
- 857. SR One Capital Management
- 858. Sravathi AI
- 859. SRI International
- 860. Stage Venture Partners
- 861. Standigm
- 862. Stanford University School of Medicine
- 863. StarFinder Capital Fund
- 864. Startupbootcamp
- 865. StartX
- 866. STEM&More
- 867. StemoniX
- 868. Stonehaven
- 869. Structura Biotechnology
- 870. Sunfish Partners
- 871. Sunwest Bank
- 872. Susa Ventures
- 873. Sustainable Conversion Ventures
- 874. SV Angel
- 875. SyndicateRoom
- 876. SYNSIGHT
- 877. Syntekabio
- 878. Synthelis
- 879. SYSTEMS ONCOLOGY
- 880. T. Rowe Price
- 881. Tachyon
- 882. Taisho Pharmaceutical
- 883. Takeda
- 884. Tanabe Research Laboratories
- 885. Tanarra Credit Partners
- 886. TARA Biosystems
- 887. Tasly Biopharmaceuticals
- 888. Tavistock Group
- 889. TB Alliance
- 890. Team Builder Ventures
- 891. Tech Incubation Program for Startup (TIPS)
- 892. Techammer
- 893. Tekla Capital Management
- 894. Temasek
- 895. Tencent
- 896. TenOneTen ventures
- 897. Tensor Ventures
- 898. Terra Magnum Capital Partners
- 899. Terray Therapeutics
- 900. TeselaGen
- 901. Teva Pharmaceutical
- 902. TF Bioinformatics
- 903. The BioCollective
- 904. The Column Group
- 905. The Cure Parkinson's Trust (CPT)
- 906. The Edge Software Consultancy
- 907. The Heritage Group
- 908. The Institute of Cancer Research
- 909. The Johns Hopkins University School of Medicine
- 910. The Michael J. Fox Foundation for Parkinson's Research (MJFF)
- 911. The Pritzker Organization
- 912. The Royal Wolverhampton NHS Trust
- 913. The Syndicate
- 914. Third Kind Venture Capital (3KVC)
- 915. Third Rock Ventures
- 916. Three Lakes Partners
- 917. Tillotts Pharma
- 918. Timewise Investment
- 919. TLV Partners
- 920. Top Technology Ventures
- 921. Topspin Fund
- 922. Toyohashi University of Technology
- 923. Transcriptic
- 924. Transilico
- 925. Trinitas Capital Management
- 926. True Ventures
- 927. Truffle Capital
- 928. TS Investment
- 929. TSVC
- 930. Turbine
- 931. Twin Ventures
- 932. Two Sigma Ventures
- 933. U.S. Securities and Exchange Commission
- 934. UCB Pharma
- 935. Uncork Capital
- 936. United States Department of Health and Human Services
- 937. Universal Materials Incubator
- 938. University College London
- 939. University Hospital Institute Méditerranée Infection
- 940. University of Barcelona
- 941. University of California San Diego
- 942. University of Cambridge
- 943. University of Chicago
- 944. University of Connecticut
- 945. University of Dundee
- 946. University of Florida
- 947. University of Groningen
- 948. University of Kentucky
- 949. University of Leeds
- 950. University of Manitoba
- 951. University of Miami
- 952. University of Michigan College of Pharmacy
- 953. University of Milan
- 954. University of Minnesota
- 955. University of Nottingham
- 956. University of Oxford
- 957. University of Pittsburgh
- 958. University of Toronto
- 959. University of Wisconsin-Milwaukee Research Foundation
- 960. University of North Carolina
- 961. Unnatural Products
- 962. UPPthera
- 963. Upsher Smith
- 964. Usynova Pharmaceuticals
- 965. Valence Discovery
- 966. Valo
- 967. VantAI
- 968. Vector Institute
- 969. Vectr Ventures
- 970. Verge Genomics
- 971. VeriSIM
- 972. Versant Ventures
- 973. Vertex Ventures
- 974. VIB
- 975. Viking Global Investors
- 976. Village Global
- 977. Vingyani
- 978. VisVires New Protein
- 979. Vium
- 980. Viva BioInnovator
- 981. Vyant Bio (Formerly known as Cancer Genetics)
- 982. Warburg Pincus
- 983. Watson Foundation
- 984. Wave
- 985. West Lake Pharmaceutical Services
- 986. Wheatsheaf
- 987. WI Harper
- 988. Wild Basin Investments
- 989. Wisecube
- 990. Woodford Investment Management
- 991. Woodline Partners
- 992. WorldQuant Ventures
- 993. Wren Capital
- 994. WRF Capital
- 995. WuXi AppTec
- 996. WuXi Biologics
- 997. WuXi Healthcare Ventures
- 998. Wuyuan Capital
- 999. X-37
- 1000. Xbiome
- 1001. X-Chem
- 1002. XenoTherapeutics
- 1003. XtalPi
- 1004. Y Combinator
- 1005. Yael Capital
- 1006. Yahui Investment
- 1007. Yale School of Medicine
- 1008. Yayi Capital
- 1009. YiMei Capital
- 1010. YITU Technology
- 1011. Yonsei University College of Medicine
- 1012. YOZMA GROUP KOREA
- 1013. Yuhan Corporation
- 1014. Yunfeng Capital
- 1015. Zastra
- 1016. ZebiAI
- 1017. ZhenFund
- 1018. Zymergen
 醫療保健產生人工智慧的成長機會
 藥物研發中人工智慧 (AI) 的全球市場:按產品、按治療領域、按流程、按使用案例、按技術、按最終用戶、按地區 - 預測到 2028 年
 藥物研發中人工智慧的全球市場 - 市場規模、佔有率、成長分析:按類型、最終用戶分類 - 產業預測 (2023-2030)
 藥物發現市場中的人工智慧 - 2018-2028 年全球產業規模、佔有率、趨勢、機會和預測,按組件類型、藥物類型、按應用類型、治療領域、地區和競爭細分
 全球人工智慧 (AI) 藥物發現市場報告
 到 2030 年藥物研發市場中的人工智慧 (AI) 預測:按成分、治療領域、技術、應用、最終用戶和地區進行的全球分析
 全球藥物發現人工智能市場預測(~2030 年)
 藥物研發中的人工智慧:全球市場
 藥物發現中的人工智慧市場:按治療領域、按應用、按地區 - 規模、份額、展望、機會分析,2023-2030 年
 藥物發現市場中的人工智慧(AI)-按組件(軟體、服務)、技術(機器學習{深度學習})、應用類型(目標識別)、治療領域(腫瘤學)、最終用途(CRO)、全球預測, 2023-2032