


 |
市場調查報告書
商品編碼
1213404
經由衛星的無線回程傳輸:第17版Wireless Backhaul via Satellite, 17th Edition |
||||||
本報告提供經由衛星的無線回程傳輸市場相關調查,衛星回程傳輸中繼相關分析結果,各市場區隔、生產能力、地區的市場機會的預測,各主要範疇的趨勢、促進因素、課題,主要企業等資訊。
報告的明細
本報告刊載的企業
ABS, Africa Mobile Networks, Altice, Amazon, Andesat, Antrix/ISRO, APT Satellite, ArabSat, AsiaSat, AT&T, Avanti Communications, Axess, Broadpeak, China Satcom, Claro, Comtech, EE, Digicel, Entel, Ericsson, Eutelsat, Facebook, Gazprom Space Systems, Gilat, Globe Telecom, Hispasat, Huawei, Hughes, ST Engineering iDirect, Intelsat, IP.ACCESS, Kacific, KDDI, MEASAT, MTN, NBN, Neotion, Nokia, Novelsat, NuRAN, O3b, OneWeb, Optus, Orange, Parallel Wireless, Quadrille, Reliance Jio, SES, SKY Perfect JSAT, Softbank, Spacecom.等。Spacebridge, Starlink, Speedcast, Sprint, Star One, Talia, Telefonica, Telenor, Telesat, Thaicom, TIM, T-Mobile, UHP, Verizon, ViaSat, Vodacom, Vodafone, Xiplink, YahSat, ZTE
目錄
簡介和定義
摘要整理
第1章 全球概要
第2章 無線回程傳輸
- 範圍和定義
- 摘要整理
- 主要的市場趨勢與全球資料
- 積極的據點
- 生產能力的需求與收益
- 設備和資料機的市場佔有率
- 結論
- 財務模式
- GEO ROI案例研究(大型基地台)
- GEO ROI案例研究(小型基地台)
- 適應性
- 地區的預測
- 北美
- 南美
- 西歐
- 中央、東歐
- 中東、北非
- 撒哈拉以南的非洲
- 亞洲
- 舊版的比較
第3章 中繼
- 範圍和定義
- 摘要整理
- 主要的市場趨勢與全球資料
- 積極的據點
- 生產能力的需求
- 設備預測
- 結論
- 地區的明細
- 北美
- 南美
- 西歐
- 中央、東歐
- 中東、北非
- 撒哈拉以南的非洲
- 亞洲
- 舊版的比較
ANNEX的調查手法與前提條件
Report Summary:
NSR's “Wireless Backhaul via Satellite, 17th Edition (WBS17) ”, the industry's longest-standing analysis of the Satellite Backhaul and Trunking backbone, provides comprehensive forecasting of Market Opportunity by Segment, Capacity & Region.
“WBS17” provides strategic insight of the rapidly evolving Mobile Backhaul and Trunking segments. The report assesses installed sites, capacity requirements and equipment shipments as well as capacity, service and CPE revenues across seven regions. “NSR's Wireless Backhaul via Satellite, 17th Edition” builds a complete picture of trends, drivers, and challenges behind each major category of backhaul connectivity-services using a fixed satellite antenna across base station technologies (2G, 3G, 4G and 5G) and cell sizes.
Key questions are answered in this report:
- 1. What is the addressable market opportunity for Satellite in cellular backhaul and trunking segments?
- 2. How does satellite solution compare to microwave and fiber for CAPEX and OPEX?
- 3. What is the revenue opportunity and capacity demand?
- 4. What is cost of satellite capacity and equipment?
- 5. What market trends exist in the seven regions and the global outlook?
- 6. What is the future of GEO vs Non-GEO solutions in the market segments?
Who Should Purchase this Report?
- 1. Satellite Operators
- 2. Equipment Vendors
- 3. Service Providers
- 4. Mobile Infrastructure Operators
- 5. Innovation and Industry Agencies
- 6. Investment Community
NSR Difference
As the market grows and transforms, NSR's data and forecasts provide a clear vision of the Backhaul markets and the Satellite role in the 5G ecosystem. NSR's “Wireless Backhaul via Satellite, 17th Edition (WBS17) ” continues to provide an honest assessment of the market in this promising but risky business landscape, serving as an opportunity roadmap for future strategic decisions.
Key Features:
Covered in this Report:
- New in this Edition- Addressable Market reassessment
- New in this Edition- Assessment of impact from weak macroeconomic environment
- Assessment of trends driving growth in each market segment and region
- Analysis of 5G potentials for Satellite Backhaul and Trunking
- Forecasting of revenue opportunity for established and new business models such as managed services and network as a service
- Financial model assessment of Satellite Backhaul CAPEX and OPEX comparison to microwave and fiber.
- Projections of site deployment by BTS technology and cell size
- 10-year forecasting of Capacity Requirements across Segment
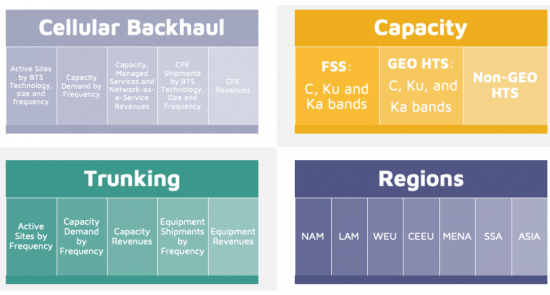
Report Segmentation:
Companies included in this Report:
ABS, Africa Mobile Networks, Altice, Amazon, Andesat, Antrix/ISRO, APT Satellite, ArabSat, AsiaSat, AT&T, Avanti Communications, Axess, Broadpeak, China Satcom, Claro, Comtech, EE, Digicel, Entel, Ericsson, Eutelsat, Facebook, Gazprom Space Systems, Gilat, Globe Telecom, Hispasat, Huawei, Hughes, ST Engineering iDirect, Intelsat, IP.ACCESS, Kacific, KDDI, MEASAT, MTN, NBN, Neotion, Nokia, Novelsat, NuRAN, O3b, OneWeb, Optus, Orange, Parallel Wireless, Quadrille, Reliance Jio, SES, SKY Perfect JSAT, Softbank, Spacecom, Spacebridge, Starlink, Speedcast, Sprint, Star One, Talia, Telefonica, Telenor, Telesat, Thaicom, TIM, T-Mobile, UHP, Verizon, ViaSat, Vodacom, Vodafone, Xiplink, YahSat, and ZTE.
Table of Contents
Introduction and Definitions
Executive Summary
1. Global Overview
- 1.1. Global Analysis
- 1.2. Addressable Market
- 1.3. Bottom Line
2. Wireless Backhaul
- 2.1. Scope and Definitions
- 2.2. Executive Summary
- 2.3. Major Market Trends and Global Figures
- 2.3.1. Active Sites
- 2.3.2. Capacity Demand and Revenues
- 2.3.3. Equipment and Modem Market Share
- 2.3.4. Bottom Line
- 2.4. Financial Models
- 2.4.1. GEO ROI Case Study (Macrocell)
- 2.4.2. GEO ROI Case Study (Smallcell)
- 2.4.3. Elasticity
- 2.5. Regional Forecast
- 2.5.1. North America
- 2.5.2. Latin America
- 2.5.3. Western Europe
- 2.5.4. Central and Eastern Europe
- 2.5.5. Middle East and North Africa
- 2.5.6. Sub-Saharan Africa
- 2.5.7. Asia
- 2.6. Comparison with Previous Edition
3. Trunking
- 3.1. Scope and Definitions
- 3.2. Executive Summary
- 3.3. Major Market Trends and Global Figures
- 3.3.1. Active Sites
- 3.3.2. Capacity Demand
- 3.3.3. Equipment Forecast
- 3.3.4. Bottom Line
- 3.4. Regional Breakdown
- 3.4.1. North America
- 3.4.2. Latin America
- 3.4.3. Western Europe
- 3.4.4. Central and Eastern Europe
- 3.4.5. Middle East and North Africa
- 3.4.6. Sub-Saharan Africa
- 3.4.7. Asia
- 3.5. Comparison with Previous Edition
ANNEX Methodology and Assumptions
List of Exhibits
Executive Summary
- Active Backhaul Sites by BTS Technology
- Total Backhaul Capacity Demand
- Global Backhaul Capacity Revenues
- Global Backhaul CPE Revenues
- Global Trunking In-Service Units
- Total Trunking Capacity Demand
- Global Trunking Capacity Revenues
- Global Trunking CPE Revenues
1. Global Overview
- 1.1. Total Global Sites by Region
- 1.2. Market Share by Application
- 1.3. Total Global Capacity Demand
- 1.4. Total Global Capacity Demand in Gbps
- 1.5. Global Capacity Revenues
- 1.6. CPE Shipments
- 1.7. CPE Revenues
- 1.8. Addressable Market - Population Agglomerations and Throughput
- 1.9. Addressable Market - Global Bandwidth Needs Heat Map
2. Wireless Backhaul
- 2.1. Active Sites by BTS Technology
- 2.2. Total Backhaul Capacity Demand
- 2.3. Global Backhaul Capacity Revenues
- 2.4. Global Backhaul CPE Revenues
- 2.5. Global In-Service Units
- 2.6. Global Capacity and Service Revenues
- 2.7. Capacity Revenues Evolution
- 2.8. Global Shipments by BTS Technology
- 2.9. CPE Revenues by Region
- 2.10. Cost vs. Traffic for a Generic Base Station and Different Backhaul Technologies
- 2.11. TCO for Different Backhaul Technologies (3G BTS - 2.5 Mbps allocation)
- 2.12. Cost per GB as Data Traffic Increases (20 Km from Backbone Node)
- 2.13. Satellite Becoming More Cost Effective
- 2.14. Long-tail of Cells Traffic
- 2.15. North America Active Sites by Base Station Technology
- 2.16. North America Active Sites by Cell Size
- 2.17. North America Capacity Demand
- 2.18. North America Capacity Revenues Evolution
- 2.19. North America CPE Revenues by Base Station Technology
- 2.20. Latin America Active Sites by Base Station Technology
- 2.21. Latin America Wholesale Capacity Revenues
- 2.22. Latin America Modem Shipments by Base Station Technologies
- 2.23. Latin America CPE Revenues
- 2.24. Western Europe Active Sites by Base Station Technology
- 2.25. Western Europe Wholesale Capacity Revenues by Frequency
- 2.26. Western Europe Modem Shipments by Base Station Technologies
- 2.27. Central and Eastern Europe Active Sites by Base Station Technology
- 2.28. Central and Eastern Europe Wholesale Capacity Revenues by Frequency
- 2.29. Central and Eastern Europe Modem Shipments by Base Station Technologies
- 2.30. Middle East and North Africa Active Sites by Base Station Technology
- 2.31. Middle East and North Africa Wholesale Capacity Revenues by Frequency
- 2.32. Middle East and North Africa Modem Shipments by Base Station Technologies
- 2.33. Sub-Saharan Africa Active Sites by Base Station Technology
- 2.34. Sub-Saharan Africa Wholesale Capacity Revenues by Frequency
- 2.35. Sub-Saharan Africa Modem Shipments by Base Station Technologies
- 2.36. Asia Active Sites by Base Station Technology
- 2.37. Asia Wholesale Capacity Revenues by Frequency
- 2.38. Asia Modem Shipments by Base Technologies
- 2.39. In-Service Units Comparison with previous edition
- 2.40. Capacity Revenues Comparison with previous edition
- 2.41. CPE Revenues Comparison with previous edition
3. Trunking
- 3.1. Global Trunking In-Service Units
- 3.2. Total Trunking Capacity Demand
- 3.3. Global Trunking Capacity Revenues
- 3.4. Global Trunking CPE Revenues
- 3.5. Global In-Service Units
- 3.6. Global Capacity Demand
- 3.7. Total Trunking Capacity Demand
- 3.8. Global Capacity Revenues by frequency
- 3.9. Global CPE Shipments
- 3.10. Global CPE Revenues
- 3.11. NAM In-Service Units
- 3.12. NAM Capacity Revenues
- 3.13. NAM CPE Shipments
- 3.14. LAM In-Service Units
- 3.15. LAM Capacity Demand
- 3.16. LAM CPE Shipments
- 3.17. WEU In-Service Units
- 3.18. WEU Capacity Revenues
- 3.19. WEU CPE Shipments
- 3.20. CEEU In-Service Units
- 3.21. CEEU Capacity Revenues
- 3.22. CEEU CPE Shipments
- 3.23. MENA In-Service Units
- 3.24. MENA Capacity Revenues
- 3.25. MENA CPE Shipments
- 3.26. SSA In-Service Units
- 3.27. SSA Capacity Revenues
- 3.28. SSA CPE Shipments
- 3.29. ASIA In-Service Units
- 3.30. ASIA Capacity Revenues
- 3.31. ASIA CPE Shipments
- 3.32. In-Service Units Comparison with previous edition
- 3.33. Capacity Revenues Comparison with previous edition
- 3.34. CPE Revenues Comparison with previous edition
 2024 年行動與無線回程全球市場報告
 P2MP 微波回程市場報告:到 2030 年的趨勢、預測和競爭分析
 行動與無線回程市場:2023-2028 年全球產業趨勢、佔有率、規模、成長、機會與預測
 行動與無線回程市場報告:2030 年趨勢、預測與競爭分析
 全球無線回程市場
 行動·無線·回程傳輸的全球市場
 行動和無線回程市場:按組件(設備、服務)、網路技術(3G 和 2G、4G、5G)分類 - 2023-2030 年全球預測
 行動及無線回程傳輸的全球市場:成長,未來預測,競爭分析(2022年~2030年)
 小型基地台衛星回程傳輸的全球市場 - 成長,未來展望,競爭分析(2022年~2030年)