


 |
市場調查報告書
商品編碼
1406232
多點觸控歸因:市場佔有率分析、產業趨勢/統計、成長預測,2024-2029Multi-Touch Attribution - Market Share Analysis, Industry Trends & Statistics, Growth Forecasts 2024 - 2029 |
||||||
※ 本網頁內容可能與最新版本有所差異。詳細情況請與我們聯繫。
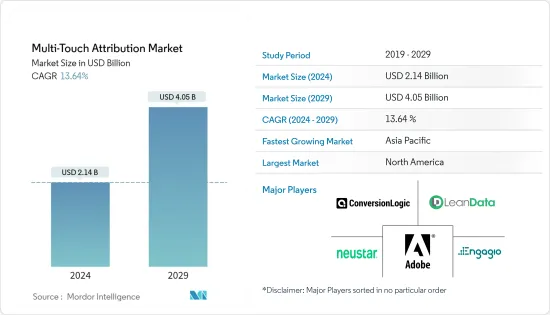
多點觸控歸因市場規模預計到 2024 年為 21.4 億美元,預計到 2029 年將達到 40.5 億美元,在預測期內(2024-2029 年)複合年成長率為 13.64%。
隨著企業快速升級並接受全球技術顛覆,行銷經理擴大在行銷活動上進行策略性支出並採用最新的數位行銷趨勢。因此,預期多點觸摸歸因模型的採用將超過單點觸摸歸因模型。
主要亮點
- 隨著社群媒體和其他數位平台的日益普及,行銷經理正在大力投資以支持和促進銷售。根據《廣告時代》發表的報導,一家金融服務公司的行銷支出在 2021 年增加 78% 的基礎上,在 2022 年前 9 個月增加了 55%。
- 2022 年 5 月,語音研究與分析平台 Veritonic 宣布推出其語音歸因解決方案。此解決方案可協助企業追蹤和衡量任何應用程式、託管平台或收聽裝置上的音訊廣告的效果。負責人可以更了解音訊創新的有效性,並獲得可操作的見解,從而提高廣告支出的投資報酬率。
- 電子商務網站的大規模成長已成為行銷人員採用多點觸控或多通路歸因策略的主要推動力。如今電子商務網站面臨的主要問題是用戶放棄購物車中的商品。據 Contact Pigeon 稱,大約 70% 的電子商務消費者放棄了購物車。行銷自動化可以幫助您自動向用戶發送電子郵件並通知他們已停產的產品。
- 人工智慧(AI)和機器學習(ML)的出現預計將進一步推動預測個人化的成長,並成為預測期內利用行銷歸因的最大收益。人工智慧使管理者能夠透過管道分析和預測更好地了解客戶。這是客戶轉換和客戶維繫的關鍵驅動力。
- 由於 COVID-19 大流行,全球零售商和領先奢侈品牌面臨短期課題,包括永續收益、健康和安全、供應鏈管理、勞動力短缺和定價。隨著世界各國政府實施隔離措施以防止 COVID-19 傳播,人們被迫留在家裡,促使網路購物和大量購買的增加。因此,供應鏈承受著巨大壓力。多點觸控歸因解決方案也幫助零售商在此次疫情期間取得了正面成果。
多點觸控歸因市場趨勢
零售和電子商務行業預計將呈現最大成長
- 數位商務市場的成長和緊張的營運預算使電子商務參與者能夠對其投資的技術和解決方案做出明智的選擇。這可以實現投資回報率最大化。零售公司必須了解他們的客戶以及他們對便利、一致的購物體驗的需求,並採用策略解決方案來最大限度地提高客戶轉換率。
- 此外,大多數零售公司損失了三分之一以上的貿易促進投資。造成這種情況的主要原因是決策者無法衡量投資回報率、貿易促銷無效以及無法利用資料來最佳化支出以收益盈利。因此,市場上許多零售商現在採用多點觸控歸因模型,而不是單點觸控歸因模型。這可以幫助您分析哪些接觸點和行銷管道直接推動客戶轉換。
- 2023年3月,Lily AI宣布推出產品屬性平台自助服務模式。這種自助服務解決方案使零售商和品牌彈性直接在其產品目錄中應用增加的產品屬性,以便用於晶粒和行銷業務。
預計北美將主導市場
- 北美市場預計將繼續主導多點觸控歸因市場,因為大多數全球主要供應商都位於該地區。行銷服務投資的增加和社交媒體的廣泛存在使該地區成為市場研究的有利基礎。
- 根據美國商務部和人口普查局的數據,2022年第四季美國零售電商總銷售額預計為17,858億美元。預計 2022 年第四季電子商務銷售額較 2021 年第四季成長 6.5%,同期零售總額成長 5.7%。
- 2022 年 11 月,Nielsen IQ 宣布將向平台用戶提供全銷售資料。這種新的報告功能為新興企業和成長型企業(中小型企業)提供克服全通路習慣和採購課題所需的資訊。
多點觸控歸因產業概述
由於全球多個市場參與者的存在,多點觸控歸因市場的競爭形勢可能會變得更具凝聚力。市場參與者正在策略性地建立夥伴關係和協作,以推動市場擴張。這些公司也專注於創新和產品開發,以加強其市場影響力和全球影響力。
2022年6月,全通路廣告平台Mediaocean宣布收購Drishyam AI。該公司是一家軟體公司,能夠自動執行識別廣告內容、解釋其含義並大規模最佳化廣告的過程。
2022 年 8 月,資料驅動驅動公司 Claritas 宣布推出具有演算法多點觸控歸因功能的歸因解決方案 3.0 版。監控客戶互動並在評估多通路行銷工作時提供無與倫比的準確性。
其他福利
- Excel 格式的市場預測 (ME) 表
- 3 個月的分析師支持
目錄
第1章簡介
- 研究假設和市場定義
- 調查範圍
第2章調查方法
第3章執行摘要
第4章市場動態
- 市場概況
- 市場促進因素
- 負責人對最大化投資報酬率越來越感興趣
- 行銷管道的增加和行銷支出最佳化的需要
- 人工智慧、巨量資料、雲端運算等技術和解決方案在行銷中的應用
- 市場抑制因素
- 對現有行銷實務、培訓和變革管理轉型的懷疑
- 產業吸引力-波特五力分析
- 供應商的議價能力
- 買家/消費者的議價能力
- 新進入者的威脅
- 替代品的威脅
- 競爭公司之間敵對關係的強度
- COVID-19 市場影響評估
第5章市場區隔
- 最終用戶產業
- 零售/電子商務
- BFSI
- 資訊科技/通訊
- 消費性電子產品
- 旅遊/旅遊
- 其他(醫療保健/生命科學、媒體/娛樂)
- 地區
- 北美洲
- 歐洲
- 亞太地區
- 拉丁美洲
- 中東/非洲
第6章 競爭形勢
- 公司簡介
- Adobe, Inc.
- Neustar, Inc.
- Engagio Inc.
- Conversion Logic, Inc.
- LeanData Inc.
- Merkle Inc.
- The Nielsen Company
- AppsFlyer
- Equifax, Inc.
- Manthan
- Ipsos Group SA
- LeadsRx, Inc.
第7章 投資分析
第8章 市場機會及未來趨勢
The Multi-Touch Attribution Market size is estimated at USD 2.14 billion in 2024, and is expected to reach USD 4.05 billion by 2029, growing at a CAGR of 13.64% during the forecast period (2024-2029).
Businesses are rapidly upgrading themselves and embracing technological disruptions globally, increasing the marketing managers to strategically spend on marketing activities and adopt the latest digital marketing trends. Hence, adopting the multi-touch attribution model over the single-touch attribution model is expected to increase.
Key Highlights
- Due to the increased adoption of social media and other digital platforms, marketing managers are investing significantly to support and boost their sales. According to a published article by Advertising Age, a financial services firm boosted marketing spending by 55% in the first nine months of 2022, on top of a 78% increase in 2021.
- In May 2022, Veritonic, an audio research and analytics platform, announced the debut of its audio attribution solution. It will assist businesses in tracking and measuring audio ad performance across any app, hosting platform, or listening device. It would allow marketers to better understand the effect of their audio creative and gain actionable insights that would increase the ROI on their advertising spend.
- The massive growth of the e-commerce website is a major factor driving marketers' adoption of multi-touch or multi-channel attribution strategy. Nowadays, the primary issue the e-commerce website faces is when a user abandons the product in the shopping cart. According to Contact Pigeon, about 70% of e-commerce shoppers abandon their carts. Marketing automation helps in sending out automated mail to the user, notifying them about the discontinued product.
- The advent of artificial intelligence (AI) and machine learning (ML) further propelled the growth of predictive personalization, expected to be the most prolific advantage of utilizing marketing attribution over the forecast period. AI allows managers to understand their customers more profoundly, which involves analyzing and predicting the channels. It acts as a major driver for customer conversion and retention.
- Due to the COVID-19 pandemic, retailers and leading luxury brands globally were facing short-term challenges across sustained revenues, health and safety, supply chain management, labor shortages, and pricing, to name a few. With governments worldwide enforcing quarantines to curb transmission of COVID-19, people staying back at home led to increased online shopping and bulk buying of goods. It resulted in massive supply chain stress. Amidst this outbreak, multi-touch attribution solutions also assisted retailers in attaining positive outcomes.
Multi-Touch Attribution Market Trends
Retail & E-commerce Industry Expected to Show Maximum Growth
- The growing digital commerce market and tighter operational budgets are enabling e-commerce players to make smart choices regarding the technologies and solutions to invest in. It would help them maximize their ROI. Retailers must adopt strategic solutions to maximize customer conversion to understand the customers and their needs for convenient and consistent shopping experiences.
- Additionally, a significant portion of the retailers lose over one-third of their investment in trade promotions, primarily due to decision-makers' inability to measure ROI, trade promotion ineffectiveness, and profitably optimize spend by leveraging data. It led to many retailers in the market currently adopting a multi-touch attribution model over a single-touch attribution model. It helps them analyze which touchpoint or marketing channel directly drives customer conversion.
- In March 2023, Lily AI announced the debut of a self-service model of its product attributes platform. This self-service solution gives retailers and brands the flexibility to directly apply increased product attribution throughout their product catalog for use by both merchandising and marketing operations.
North America Expected to Dominate the Market
- North American market is expected to continue to dominate the multi-touch attribution market, as most of the major global vendors are based in the region. The increasing marketing services investment and an enormous social media presence make the region a lucrative hub for the market studied.
- According to the Census Bureau of the Department of Commerce, US retail e-commerce total sales for the fourth quarter of 2022 were estimated at USD 1,785.8 billion. The fourth quarter of 2022 e-commerce estimate increased 6.5% from the fourth quarter of 2021, while total retail sales increased 5.7% in the same period.
- In November 2022, NielsenIQ announced the availability of Omnisales data to its platform users. The new reporting functionality gives emerging and growing (small and mid-sized) companies the information they need to overcome the difficulties of omnichannel habits and purchases.
Multi-Touch Attribution Industry Overview
The competitive landscape of the multi-touch attribution market could be more cohesive, owing to several market players worldwide. The market players are strategically forming partnerships and collaborations to drive market expansion. Also, the companies are focusing on innovations and product development to enhance their market presence and global foothold.
In June 2022, Mediaocean, a platform for omnichannel advertising, announced that the company acquired Drishyam AI. It is a software company that automates the process of identifying the content of ads, interpreting their meaning, and optimizing them at scale.
In August 2022, Claritas, a data-driven company, unveiled Version 3.0 of its attribution solution, which supports algorithmic multi-touch attribution. It monitors customer interaction and provides unmatched accuracy for evaluating multichannel marketing initiatives.
Additional Benefits:
- The market estimate (ME) sheet in Excel format
- 3 months of analyst support
TABLE OF CONTENTS
1 INTRODUCTION
- 1.1 Study Assumptions & Market Definition
- 1.2 Scope of the Study
2 RESEARCH METHODOLOGY
3 EXECUTIVE SUMMARY
4 MARKET DYNAMICS
- 4.1 Market Overview
- 4.2 Market Drivers
- 4.2.1 Increasing Focus of Marketers on Maximizing the ROI
- 4.2.2 Growing Number of Marketing Channels and Need for Optimization of Marketing Expenditure
- 4.2.3 Adoption of Technology and Solutions such as AI, Big Data, and Cloud Computing in Marketing
- 4.3 Market Restraints
- 4.3.1 Skepticism About Shifting from Existing Marketing Practices, Training and Change Management
- 4.4 Industry Attractiveness - Porter's Five Forces Analysis
- 4.4.1 Bargaining Power of Suppliers
- 4.4.2 Bargaining Power of Buyers/Consumers
- 4.4.3 Threat of New Entrants
- 4.4.4 Threat of Substitute Products
- 4.4.5 Intensity of Competitive Rivalry
- 4.5 Assessment of Impact of Covid-19 on the Market
5 MARKET SEGMENTATION
- 5.1 End-user Industry
- 5.1.1 Retail & E-commerce
- 5.1.2 BFSI
- 5.1.3 IT & Telecom
- 5.1.4 Consumer Electronics
- 5.1.5 Travel & Tourism
- 5.1.6 Other End-user Industries (Healthcare & Life Sciences, Media & Entertainment)
- 5.2 Geography
- 5.2.1 North America
- 5.2.2 Europe
- 5.2.3 Asia Pacific
- 5.2.4 Latin America
- 5.2.5 Middle East and Africa
6 COMPETITIVE LANDSCAPE
- 6.1 Company Profiles*
- 6.1.1 Adobe, Inc.
- 6.1.2 Neustar, Inc.
- 6.1.3 Engagio Inc.
- 6.1.4 Conversion Logic, Inc.
- 6.1.5 LeanData Inc.
- 6.1.6 Merkle Inc.
- 6.1.7 The Nielsen Company
- 6.1.8 AppsFlyer
- 6.1.9 Equifax, Inc.
- 6.1.10 Manthan
- 6.1.11 Ipsos Group SA
- 6.1.12 LeadsRx, Inc.
7 INVESTMENT ANALYSIS
8 MARKET OPPORTUNITIES AND FUTURE TRENDS
 行銷歸因軟體市場:按組件、類型、部署型態、組織規模、產業分類 - 2024-2030 年全球預測
 行銷歸因軟體市場,份額,規模,趨勢,行業分析報告:按組件,歸因類型,部署類型,行業,地區,細分市場,預測2023-2032 年
 全球行銷歸因軟體市場
 營銷歸因軟件全球市場規模、份額、行業趨勢分析報告:按組件、按類型、按部署模式、按組織規模、按行業、按地區、展望和預測,2022-2028 年
 營銷歸因軟件全球市場規模研究和預測:按組件、按歸因類型、按組織規模、按部署類型、按地區,2022-2029 年
 營銷歸因軟件市場:按組件,部署模式,類型,組織規模,行業劃分:2021-2031 年全球機會分析和行業預測
 多點觸控行銷歸因軟體的全球市場:對新的行銷流通管道和行銷的最佳化趨勢的高設備投資喚起需求