


 |
市場調查報告書
商品編碼
1435208
Solar Tracker:市場佔有率分析、產業趨勢與統計、成長預測(2024-2029)Solar Tracker - Market Share Analysis, Industry Trends & Statistics, Growth Forecasts (2024 - 2029) |
||||||
※ 本網頁內容可能與最新版本有所差異。詳細情況請與我們聯繫。
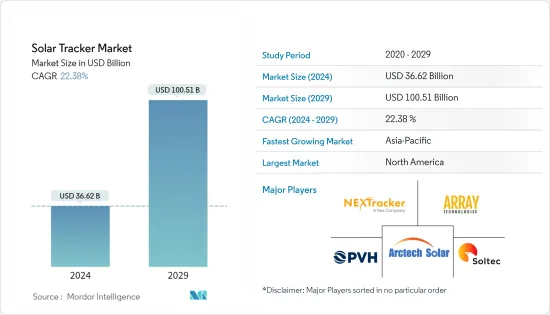
太陽能追蹤器市場規模預計到 2024 年為 366.2 億美元,預計到 2029 年將達到 1005.1 億美元,預測期內(2024-2029 年)複合年成長率為 22.38%。
2020 年,市場受到 COVID-19 的負面影響。目前市場處於大流行前的水平。
主要亮點
- 從長遠來看,預計太陽能發電裝置的增加將在預測期內創造對太陽能追蹤器的需求。
- 另一方面,安裝追蹤系統所需的高額初始投資、設計複雜性、維護成本以及太陽能追蹤系統的容量限制預計將抑制太陽能追蹤系統的使用。
- 儘管如此,預計政府的支持政策以及利用再生能源來源來滿足不斷成長的電力需求等因素可能會在未來幾年為太陽能電池板和太陽能追蹤器創造一個利潤豐厚的市場。
- 太陽能追蹤器市場以北美為主,其中美國成為重要客戶,到年終,超過70%的計劃安裝了太陽能追蹤器。
太陽能追蹤器市場趨勢
單軸太陽能追蹤器佔據市場主導地位
- 太陽能追蹤器透過將太陽能電池板與陽光的方向對齊來提高太陽能電池板系統的生產能力。太陽能追蹤器重新定位光伏(PV)面板,使陽光垂直照射面板以獲得最大功率輸出。然而,當您向北移動時,這種效果會變得不那麼有效,因為在遠離赤道的地方,夏季和冬季之間太陽的角度變化更大。
- 單軸太陽能追蹤器的成本比固定光伏板設定高 50%,但容量可額外增加 25-35%。其簡單的設計提供了每平方米最高的光伏電池板放置密度,從而縮短了投資回收時間。
- 目前,水平單軸追蹤器 (HSAT) 是追蹤器中的主要選擇,因為它們可以多提供 20-30% 的能量,而無需增加雙軸追蹤系統的成本和複雜性。此外,由於單軸追蹤系統成本的下降,SAT 越來越受歡迎,這阻礙了雙軸追蹤設備市場的成長。
- 單軸追蹤器的成本比固定太陽能發電面板設定高 50%,但能源產量可額外增加 25-35%。單軸太陽能追蹤器的簡單設計提供了每平方面積最高的太陽能發電面板密度和最短的投資回收時間。同時,雙軸追蹤器可提供額外 10% 的產能擴展,但固定光伏板設定的額外成本為 100%。
- 在有利的政府政策和多個國家設定的雄心勃勃的可再生能源目標的支持下,可再生能源產業投資的增加,使得過去10年太陽能光電(PV)計劃的裝置容量不斷增加,並且逐年大幅成長。根據國際可再生能源機構的數據,全球累積設置容量增加了22.4%,從2021年的855.16GW增加到2022年的1,046.61GW。
- 此外,政府和能源公司在增加當前和未來計劃的電力容量方面面臨挑戰。單軸太陽能追蹤器的容量增加了 20-30%,這是非常有益的。預計這將為預測期內參與製造單軸太陽能追蹤系統的公司創造重大機會。
- 因此,由於上述幾點,單軸太陽能追蹤器預計將在預測期內佔據市場主導地位。
北美市場佔據主導地位
- 近年來,北美太陽能裝置容量顯著增加,主要得益於投資增加和政府優惠政策的支持,導致該地區對太陽能追蹤器的需求增加。
- 在北美地區,美國是太陽能追蹤器需求的主要股東,其次是加拿大和墨西哥。
- 由於美國政府對可再生能源的興趣日益濃厚以及政府的支持政策,預計在預測期內美國將保持其在太陽能追蹤器市場的主導地位。
- 美國是全球太陽能追蹤器的主要市場之一,大部分需求來自加州、亞利桑那州、德克薩斯州、德州、佛羅裡達州和北卡羅來納州等州。
- 隨著對太陽能效率和發電的日益重視,太陽能追蹤系統在美國被積極使用。當太陽光線垂直於太陽能發電系統面板時,太陽能發電系統面板可以更有效地收集太陽輻射,因此安裝太陽能追蹤器可以提高發電量。
- 過去十年,單軸追蹤在美國太陽能市場的使用穩步成長。截至去年年底,美國超過 60% 的公用事業規模太陽能光電系統都在使用單軸追蹤。另一方面,雙軸太陽能追蹤僅在48個計劃中使用,總合容量約為1.16吉瓦。
- 美國佔全球安裝的所有雙軸太陽能追蹤器的大部分,因為與固定傾斜追蹤器相比,這些系統的效率提高了 30-40%。近年來,對這些系統的需求增加。因此,由於效率的提高和投資回報率的提高,雙軸追蹤系統市場預計將擴大。然而,與雙軸太陽能追蹤系統相關的營運和維護成本預計將成為市場的限制因素。
- 因此,即將推出的太陽能追蹤系統計劃、政府支持政策以及減少對石化燃料電力依賴的努力等因素預計將推動該地區的太陽能追蹤市場。
太陽能追蹤器產業概況
太陽能追蹤器市場適度整合。市場上的主要企業包括(排名不分先後)NexTracker Inc.、Array Technologies Inc.、PV Hardware Solutions SLU、Arctech Solar Holding 和 Soltec Power Holdings SA。
其他福利
- Excel 格式的市場預測 (ME) 表
- 3 個月分析師支持
目錄
第1章簡介
- 調查範圍
- 市場定義
- 研究場所
第 2 章執行摘要
第3章調查方法
第4章市場概況
- 介紹
- 2028年之前的市場規模和需求預測(金額)
- 最新趨勢和發展
- 政府法規政策
- 市場動態
- 促進因素
- 抑制因素
- 供應鏈分析
- 波特五力分析
- 供應商的議價能力
- 消費者議價能力
- 新進入者的威脅
- 替代品的威脅
- 競爭公司之間敵對關係的強度
第5章市場區隔
- 軸型
- 單軸
- 兩軸
- 地區
- 北美洲
- 美國
- 加拿大
- 北美其他地區
- 歐洲
- 德國
- 法國
- 英國
- 義大利
- 其他歐洲國家
- 亞太地區
- 中國
- 印度
- 日本
- 澳洲
- 其他亞太地區
- 中東/非洲
- 沙烏地阿拉伯
- 阿拉伯聯合大公國
- 南非
- 卡達
- 其他中東和非洲
- 南美洲
- 巴西
- 阿根廷
- 智利
- 南美洲其他地區
- 北美洲
第6章 競爭形勢
- 併購、合資、聯盟、協議
- 主要企業策略
- 公司簡介
- Soltec Power Holdings SA
- Arctech Solar Holdings Co Ltd.
- Meca Solar
- Ideematec Deutschland GmbH
- Nextracker Inc.
- DCE Solar
- Valmont Industries Inc.
- PV Hardware Solutions SLU
- Solar Flexrack
- Array Technologies Inc.
第7章 市場機會及未來趨勢
The Solar Tracker Market size is estimated at USD 36.62 billion in 2024, and is expected to reach USD 100.51 billion by 2029, growing at a CAGR of 22.38% during the forecast period (2024-2029).
The market was negatively impacted by COVID-19 in 2020. Presently the market has reached pre-pandemic levels.
Key Highlights
- Over the long term, increasing solar PV installations are expected to create demand from solar trackers in the forecast period.
- On the other hand, the high initial investment required to install a tracking system, design complexity, maintenance cost, and limited capacity of solar tracking systems are expected to restrain the usage of solar trackers.
- Nevertheless, factors such as supportive government policies and efforts to meet the increasing power demand using renewable energy sources are expected to create a favorable market for solar panels as well as for solar trackers in the coming years.
- North America has dominated the market of solar trackers, where the United States emerged as a significant customer with solar trackers installed in more than 70% of projects by the end of 2021.
Solar Tracker Market Trends
Single Axis Solar Trackers to Dominate the Market
- A solar tracker enhances the production capacity of the solar panel system by aligning the solar panel with the direction of sunlight. The solar tracker alters the alignment of the photovoltaic (PV) panel so that the sunlight falls perpendicularly on the panel and gives maximum power output. However, they are less effective when they move farther toward the northern regions because the variance of the solar angle is higher between the summer and winter seasons in locations far from the equator.
- The single-axis solar tracker is 50% more costly than a fixed PV panel setup but provides an extra 25-35% surge in capacity. Its simple design offers the highest density of PV panel placement per square and includes a shorter payback time.
- Currently, horizontal single-axis trackers (HSAT) are the leading choice among trackers since they can deliver 20-30% more energy without the added cost and complexities of dual-axis tracking systems. In addition, the decline in single-axis tracking system cost is increasing the popularity of SATs, which in turn, hinders the growth of the dual-axis trackers market.
- The single-axis tracker is 50% more costly than a fixed photovoltaic panel setup but provides an extra 25-35% surge in energy yield. Single-axis solar trackers' simple design offers the highest density of photovoltaic panel placement per square area and contains a shorter payback time. At the same time, dual-axis trackers provide an extra 10% capacity enhancement but cost an extra 100% of fixed PV panel setup.
- The installed capacity of solar photovoltaic (PV) projects is growing significantly over the last decade due to increasing investments in the renewable energy industry supported by favorable government policies and ambitious renewable energy targets set by several countries. According to International Renewable Energy Agency, the cumulative global installed solar PV capacity grew by 22.4%, i.e., from 855.16 GW in 2021 to 1,046.61 GW in 2022.
- Furthermore, governments and energy companies face a challenge to increase the power capacity for current and future projects. With single-axis solar trackers, a capacity surge of 20-30% can be very beneficial. It, in turn, is expected to create significant opportunities for the companies involved in single-axis solar tracking system manufacturing during the forecast period.
- Thus, owing to the above points, the single-axis solar tracker is expected to dominate the market in the forecast period.
North America to Dominate the Market
- North America witnessed significant growth in installed solar energy capacity in recent years, mainly supported by increasing investments and favorable government policies, leading to a rise in demand for solar trackers in the region.
- In the North American region, the United States is a major shareholder in the demand for solar trackers, followed by Canada and Mexico.
- The United States is expected to maintain its dominance in the solar tracker market during the forecast period, owing to the increasing focus of the country's government on renewable energy and supportive government policies.
- The United States is one of the major markets for solar trackers around the globe, with a majority of the demand coming from states like California, Arizona, Nevada, Texas, Florida, North Carolina, etc.
- With the increasing emphasis on solar efficiency and power generation, solar tracking systems are actively used in the United States. Since the panels of a solar PV system collect solar radiation more efficiently when the sun's rays are perpendicular to the panel, deploying a solar tracker enhances electricity generation.
- The use of single-axis tracking in the US utility PV market has grown steadily over the past decade. At the end of last year, more than 60% of all United States utility-scale PV systems used single-axis tracking. On the other hand, dual-axis solar tracking was used by only 48 projects with a combined capacity of around 1.16 GW.
- The United States contains a large share of the total dual-axis solar tracker deployed globally, as these systems increased efficiency by 30-40% compared to fixed-tilt trackers. It led to an increase in the demand for these systems in recent years. Hence, the dual-axis tracker system market is expected to increase about the increased efficiency and greater ROI. However, the O&M cost associated with the dual-axis solar tracker system is expected to act as a restraining factor to the market.
- Therefore, factors such as upcoming solar PV tracking systems projects, supportive government policies, and efforts to reduce reliance on fossil fuel-based power are expected to drive the solar tracker market in the region.
Solar Tracker Industry Overview
The solar tracker market is moderately consolidated. Some of the major players in the market (in no particular order) include NexTracker Inc., Array Technologies Inc., PV Hardware Solutions S.L.U., Arctech Solar Holding Co. Ltd, and Soltec Power Holdings SA.
Additional Benefits:
- The market estimate (ME) sheet in Excel format
- 3 months of analyst support
TABLE OF CONTENTS
1 INTRODUCTION
- 1.1 Scope of the Study
- 1.2 Market Definiton
- 1.3 Study Assumptions
2 EXECUTIVE SUMMARY
3 RESEARCH METHODOLOGY
4 MARKET OVERVIEW
- 4.1 Introduction
- 4.2 Market Size and Demand Forecast in USD billion, till 2028
- 4.3 Recent Trends and Developments
- 4.4 Government Policies and Regulations
- 4.5 Market Dynamics
- 4.5.1 Drivers
- 4.5.2 Restraints
- 4.6 Supply Chain Analysis
- 4.7 Porter's Five Forces Analysis
- 4.7.1 Bargaining Power of Suppliers
- 4.7.2 Bargaining Power of Consumers
- 4.7.3 Threat of New Entrants
- 4.7.4 Threat of Substitute Products and Services
- 4.7.5 Intensity of Competitive Rivalry
5 Market Segmentation
- 5.1 Axis Type
- 5.1.1 Single Axis
- 5.1.2 Dual Axis
- 5.2 Geography
- 5.2.1 North America
- 5.2.1.1 United States
- 5.2.1.2 Canada
- 5.2.1.3 Rest of North America
- 5.2.2 Europe
- 5.2.2.1 Germany
- 5.2.2.2 France
- 5.2.2.3 United Kingdom
- 5.2.2.4 Italy
- 5.2.2.5 Rest of Europe
- 5.2.3 Asia-Pacific
- 5.2.3.1 China
- 5.2.3.2 India
- 5.2.3.3 Japan
- 5.2.3.4 Australia
- 5.2.3.5 Rest of Asia-Pacific
- 5.2.4 Middle-East and Africa
- 5.2.4.1 Saudi Arabia
- 5.2.4.2 United Arab Emirates
- 5.2.4.3 South Africa
- 5.2.4.4 Qatar
- 5.2.4.5 Rest of Middle-East and Africa
- 5.2.5 South America
- 5.2.5.1 Brazil
- 5.2.5.2 Argentina
- 5.2.5.3 Chile
- 5.2.5.4 Rest of South America
- 5.2.1 North America
6 Competitive Landscape
- 6.1 Mergers and Acquisitions, Joint Ventures, Collaborations, and Agreements
- 6.2 Strategies Adopted by Leading Players
- 6.3 Company Profiles
- 6.3.1 Soltec Power Holdings SA
- 6.3.2 Arctech Solar Holdings Co Ltd.
- 6.3.3 Meca Solar
- 6.3.4 Ideematec Deutschland GmbH
- 6.3.5 Nextracker Inc.
- 6.3.6 DCE Solar
- 6.3.7 Valmont Industries Inc.
- 6.3.8 PV Hardware Solutions S.L.U.
- 6.3.9 Solar Flexrack
- 6.3.10 Array Technologies Inc.
7 Market Opportunities and Future Trends
 太陽能追蹤器市場:按技術、類型、系統類型、應用程式分類 - 2024-2030 年全球預測
 2024-2032 年按類型、追蹤類型、技術(太陽能光伏、聚光太陽能、聚光光伏)、應用和地區分類的太陽能追蹤器市場報告
 到 2030 年單軸太陽能追蹤器市場預測:按產品類型、軸旋轉、應用和區域進行的全球分析
 公用事業太陽能追蹤器市場規模 - 按產品(單軸、雙軸)、區域展望、競爭市場佔有率和全球預測,2024 年 - 2032 年
 全球太陽能光伏發電追蹤的形勢:2023年
 全球太陽能追蹤器市場規模研究與預測,按類型(光伏(PV)、聚光太陽能(CSP))按運動(單軸、雙軸)、按應用(公用事業、非公用事業)和區域分析,2023 -2030 年
 2024-2028年單軸太陽能追蹤器的全球市場
 太陽能追蹤器市場 - 2018-2028 年全球產業規模、佔有率、趨勢、機會和預測,按類型、技術、按應用、地區和競爭細分
 雙軸太陽能追蹤器市場 - 2018-2028 年全球產業規模、佔有率、趨勢、機會和預測(按類型、應用、地區、競爭預測和機會細分)
 太陽能追蹤器的全球市場:2023-2033年