


 |
市場調查報告書
商品編碼
1436007
海運:市場佔有率分析、產業趨勢與統計、成長預測(2024-2029)Maritime Freight Transport - Market Share Analysis, Industry Trends & Statistics, Growth Forecasts (2024 - 2029) |
||||||
※ 本網頁內容可能與最新版本有所差異。詳細情況請與我們聯繫。
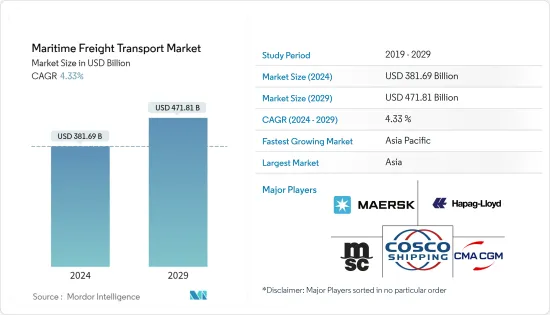
預計2024年海運市場規模為3,816.9億美元,預計2029年將達4,718.1億美元,預測期內(2024-2029年)年複合成長率為4.33%。
海運業運輸了大約 90%的世界貿易。海上貿易不斷擴大,透過具有競爭力的貨運成本使世界各地的消費者受益。由於航運作為一種運輸方式的效率不斷提高以及經濟自由化程度不斷提高,該行業進一步成長的前景仍然強勁。
所有貿易鏈,包括主要進出口貿易,都面臨崩潰。由於當前的困難時期和情況的緊迫性,各國禁止從其他港口,特別是來自中國的貨櫃和船舶入境。
超過5萬艘商船進行國際貿易,運送各類貨物。全球船隊在 150 多個國家註冊,船員超過 100 萬,幾乎來自各國。
具體而言,2022年初,糧食價格和乾散貨運費的上漲預計導致消費性食品價格上漲 1.2%。2021年,貨櫃船在港口停留時間比2020年增加了13.7%,加劇了延誤和短缺。去年,全球船舶溫室氣體排放總量增加了4.7%。
貿發會議題為《海運回顧》的報告顯示,多年來成長最快的部門是貨櫃貿易,預計2023年成長率將達到 1.9%。
海運市場趨勢
貨櫃化成為一種趨勢
據聯合國貿易和發展會議(UNCTAD)表示,國際海運貿易主要受到貨櫃、乾散貨和天然氣貨物成長的推動。 然而,地緣政治緊張局勢和 COVID-19 等全球流行病等不確定因素仍然是當前海運環境的首要主題,風險傾向於下行。
長期來看,雜貨貨櫃化呈上升趨勢。全球化貨櫃貿易的大部分繼續穿越東西方貨櫃貿易的主要動脈:亞洲-歐洲、環太平洋地區和大西洋。預計在預測期內,貨櫃貿易和驅動要素貿易的年複合成長率分別為4.5%和3.9%。
目前全球有超過 1700 萬個貨櫃在使用,且貨櫃不斷發展。隨著全球貿易迅速擴張,對高效貨運的需求只會不斷增加。
自從貨櫃首次標準化以來,供給和需求推動了成長和變化,但它們並不是影響貨櫃船上貨櫃數量的唯一因素。多年來貨櫃的大小也影響了這個數字。
亞太地區是成長最快的市場
亞太地區由一些世界上成長最快的經濟體組成,包括中國和印度。貿易交流支持了這些國家航運業的成長,大部分的國際貿易都是透過海上進行。
全球貨櫃港口裝卸活動的趨勢也凸顯了亞洲在全球貿易和航運中的核心角色。亞洲國家的區域內貿易顯著增加,但這主要基於製造業貿易,這通常包括碎片化的生產流程,其中零件在亞洲多個地點製造並在其他地方組裝。預計將透過海上運輸擴大貿易。需求成長主要發生在亞洲,受到持續的能源政策轉變以及澳洲和美國出口能力增加的支持。
亞太地區的特徵是主要國家的存在為海運市場提供了巨大的航運價值。中國、日本、新加坡、韓國則名列全球前10大船舶擁有國。
例如,截至2021年1月,中國船隊資產總額達1,960億美元,日本船隊資產總額達1,880億美元,新加坡船隊資產總額達790億美元,韓國船隊資產總額達596億美元。
除了這些市場之外,還有幾個新興市場也準備採用海洋分析,包括印度、印尼、越南、馬來西亞、菲律賓和泰國。根據國際貨幣基金組織(IMF)的資料,截至2022年12月,前10名的海上貿易國家包括中國、韓國、馬來西亞和台灣。
海運業概況
航運市場高度集中,少數參與者佔據相當大的市場佔有率。市場上的知名公司包括 MSC、COSCO 和 AP Moller。
由於航運固有的國際性質及其多利益相關方的層面,海上運輸是一個複雜的活動領域。 該行業的公司目前正致力於遵守國際海事組織從2020年 1月起降低全球船用燃料硫含量上限的要求,該行業努力實施減少碳足跡和污染貢獻的計劃。
其他福利
- Excel 格式的市場預測(ME)表
- 3 個月分析師支持
目錄
第1章 簡介
- 調查先決條件
- 調查範圍
第2章 調查方法
- 分析調查方法
- 調查階段
第3章 執行摘要
第4章 市場動態與洞察
- 目前的市場狀況
- 市場動態
- 促進因素
- 世界貿易的成長
- 對具有成本效益的運輸的需求
- 抑制因素
- 日益嚴格的法規影響市場成長
- 燃料成本上漲影響市場
- 機會
- 利用新技術提振市場
- 全球海上貿易需求不斷成長
- 促進因素
- 產業吸引力-波特五力分析
- 新進入者的威脅
- 買方議價能力
- 供應商的議價能力
- 替代產品的威脅
- 競爭公司之間的敵意強度
- 價值鏈/供應鏈分析
- 技術進步
- 政府法規和重大舉措
- 轉運貿易洞察
- 深入了解貨櫃化和非貨櫃化貨物
- 運費和海運費用
- 深入了解多式聯運/貨櫃使用情況
- 供需分析
- COVID-19 對市場的影響
第5章 市場區隔
- 依類型
- 貨櫃化
- 一般
- 冷藏箱
- 非貨櫃化
- 貨櫃化
- 依地區
- 北美洲
- 美國
- 加拿大
- 北美其他地區
- 歐洲
- 德國
- 俄羅斯
- 法國
- 英國
- 其他歐洲國家
- 亞太地區
- 中國
- 日本
- 澳洲
- 印度
- 其他亞太地區
- 中東和非洲
- 沙烏地阿拉伯
- 南非
- 其他中東和非洲
- 南美洲
- 巴西
- 哥倫比亞
- 阿根廷
- 南美洲其他地區
- 北美洲
第6章 競爭形勢
- 市場集中度概況
- 公司簡介
- AP Moller(Maersk)
- Mediterranean Shipping Company SA(MSC)
- CMA-CGM
- China Ocean Shipping(Group)Company(COSCO)
- Hapag-Lloyd
- ONE-Ocean Network Express
- Evergreen Line
- HMM Co. Ltd
- Yang Ming Marine Transport
- Zim
- Wan Hai Lines
- PIL Pacific International Line*
第7章 市場的未來
第8章 附錄
The Maritime Freight Transport Market size is estimated at USD 381.69 billion in 2024, and is expected to reach USD 471.81 billion by 2029, growing at a CAGR of 4.33% during the forecast period (2024-2029).
The maritime freight transport industry is responsible for the carriage of around 90% of world trade. Seaborne trade continues to expand, bringing benefits for consumers across the world through competitive freight costs. Thanks to the growing efficiency of shipping as a mode of transport and increased economic liberalization, the prospects for the industry's further growth continue to be strong.
All the trade chains, including the major import and export trade, face a downfall. During this adverse time and the urgency of the situation, a ban had been imposed by various countries on the entry of containers and vessels that are being operated from other ports, especially those that are transported from China.
Over 50,000 merchant ships are trading internationally, transporting every kind of cargo. The world fleet is registered in over 150 nations and manned by over a million seafarers of virtually every nationality.
Concretely, it was estimated that higher grain prices and dry bulk freight rates in early 2022 contributed to a 1.2% increase in consumer food prices. Container ships spent 13.7% longer in port in 2021 compared to 2020, exacerbating delays and shortages. During the last year, total greenhouse gas emissions from the world fleet increased by 4.7%.
For many years, the fastest-growing segment was containerized trade, for which growth in 2023 is expected to reach 1.9%, according to a report titled Review of Maritime Transport by UNCTAD.
Maritime Freight Transport Market Trends
Containerization is Evolving as a Trend
According to UNCTAD (United Nations Conference on Trade and Development), international maritime trade is driven in particular by growth in containerized, dry bulk, and gas cargo. However, uncertainties like geopolitical tensions and global pandemics like COVID-19 remain an overriding theme in the current maritime transport environment, with risks tilted to the downside.
The long-term trend toward the containerization of general cargo is upward rising. A large share of globalized containerized trade continued to be carried across the major East-West containerized trade arteries, namely Asia-Europe, the Trans-Pacific, and the Transatlantic. Containerized and dry bulk trades are expected to register a compound annual growth rate of 4.5% and 3.9%, respectively, over the forecast period.
Today, over 17 million shipping containers are used worldwide, which is evolving constantly. With global trade expanding rapidly, the demand for efficient cargo transport will only grow as well.
Supply and demand have facilitated growth and change since the first standardized containers, but they're not the only factors that have impacted how many containers are on a container ship. The size of containers over the years has affected the number as well.
Asia-Pacific is the Fastest Growing Market
The Asian-Pacific region consists of some of the fastest-growing economies in the world, like China and India. The trade exchanges support this growth in the maritime transportation sector by these countries, of which the majority of international trade takes place via sea routes.
Trends in global container port-handling activities also highlight the central role of Asia in global trade and shipping. Asian countries are experiencing a large increase in intra-regional trade, mostly based on manufacturing trades and reflecting fragmented production processes, where parts are generally manufactured in multiple locations across Asia and assembled in another location. This is also expected to increase trade, supported by marine transportation. Demand growth originated mostly in Asia, bolstered by ongoing energy policy shifts and rising export capacity in Australia and the United States.
The Asia Pacific region is characterized by the presence of some major countries that contribute substantial fleet value to the maritime freight transport market. China, Japan, Singapore, and South Korea are among the top ten ship-owning countries worldwide.
For instance, as of January 2021, China's total fleet asset value reached USD 196 billion, whereas Japan's total fleet asset value reached USD 188 billion, Singapore's total fleet asset value was USD 79 billion, and South Korea's total fleet asset value reached USD 59.6 billion.
In addition to these markets, there are several other potential developing markets for the adoption of maritime analytics, such as India, Indonesia, Vietnam, Malaysia, the Philippines, and Thailand. As per the Internal Monetary Fund (IMF), in December 2022, the top 10 sea trading countries included China, South Korea, Malaysia, and Taiwan.
Maritime Freight Transport Industry Overview
The maritime transport market is fairly concentrated, with a few players accounting for significant amounts of shares in the market. Some of the prominent companies in the market are MSC, COSCO, and AP Moller.
Maritime transport is a complex activity area, owing to the inherently international nature of shipping and its multi-stakeholder dimension. The companies in the sector currently are focusing on complying with the International Maritime Organization's lower global sulfur cap on marine fuels from January 2020 as the segment moves towards implementing the plans to reduce its carbon footprint and contribution to pollution.
Additional Benefits:
- The market estimate (ME) sheet in Excel format
- 3 months of analyst support
TABLE OF CONTENTS
1 INTRODUCTION
- 1.1 Study Assumptions
- 1.2 Scope of the Study
2 RESEARCH METHODOLOGY
- 2.1 Analysis Methodology
- 2.2 Research Phases
3 EXECUTIVE SUMMARY
4 MARKET DYNAMICS AND INSIGHTS
- 4.1 Current Market Scenario
- 4.2 Market Dynamics
- 4.2.1 Drivers
- 4.2.1.1 Increasing global trade
- 4.2.1.2 Demand for cost-effective transportation
- 4.2.2 Restraints
- 4.2.2.1 Increasing regulations affecting the growth of the market
- 4.2.2.2 Surge in fuel costs affecting the market
- 4.2.3 Opportunities
- 4.2.3.1 Usage of new technologies boosting the market
- 4.2.3.2 Increasing demand for maritime trade across the globe
- 4.2.1 Drivers
- 4.3 Industry Attractiveness - Porter's Five Forces Analysis
- 4.3.1 Threat of New Entrants
- 4.3.2 Bargaining Power of Buyers/Consumers
- 4.3.3 Bargaining Power of Suppliers
- 4.3.4 Threat of Substitute Products
- 4.3.5 Intensity of Competitive Rivalry
- 4.4 Value Chain/Supply Chain Analysis
- 4.5 Technological Advancements
- 4.6 Government Regulations and Key Initiatives
- 4.7 Insights into Transshipment Trade
- 4.8 Insights into Containerized and Non-containerized Shipments
- 4.9 Freight Rates and Maritime Transport Costs
- 4.10 Insights into Intermodal/Container Utilization
- 4.11 Demand-Supply Analysis
- 4.12 Impact of COVID-19 on the Market
5 MARKET SEGMENTATION
- 5.1 By Type
- 5.1.1 Containerized
- 5.1.1.1 General
- 5.1.1.2 Reefer
- 5.1.2 Non-containerized
- 5.1.1 Containerized
- 5.2 By Geography
- 5.2.1 North America
- 5.2.1.1 United States
- 5.2.1.2 Canada
- 5.2.1.3 Rest of North America
- 5.2.2 Europe
- 5.2.2.1 Germany
- 5.2.2.2 Russia
- 5.2.2.3 France
- 5.2.2.4 United Kingdom
- 5.2.2.5 Rest of Europe
- 5.2.3 Asia-Pacific
- 5.2.3.1 China
- 5.2.3.2 Japan
- 5.2.3.3 Australia
- 5.2.3.4 India
- 5.2.3.5 Rest of Asia-Pacific
- 5.2.4 Middle East and Africa
- 5.2.4.1 Saudi Arabia
- 5.2.4.2 South Africa
- 5.2.4.3 Rest of Middle East and Africa
- 5.2.5 South America
- 5.2.5.1 Brazil
- 5.2.5.2 Colombia
- 5.2.5.3 Argentina
- 5.2.5.4 Rest of South America
- 5.2.1 North America
6 COMPETITIVE LANDSCAPE
- 6.1 Market Concentration Overview
- 6.2 Company Profiles
- 6.2.1 AP Moller (Maersk)
- 6.2.2 Mediterranean Shipping Company SA (MSC)
- 6.2.3 CMA-CGM
- 6.2.4 China Ocean Shipping (Group) Company (COSCO)
- 6.2.5 Hapag-Lloyd
- 6.2.6 ONE - Ocean Network Express
- 6.2.7 Evergreen Line
- 6.2.8 HMM Co. Ltd
- 6.2.9 Yang Ming Marine Transport
- 6.2.10 Zim
- 6.2.11 Wan Hai Lines
- 6.2.12 PIL Pacific International Line*


