


 |
市場調查報告書
商品編碼
1250857
世界200強家具製造商Top 200 Furniture Manufacturers Worldwide |
||||||
200 強家具製造商的總銷售額從 2017 年到 2022 年增長了 30% 以上。 2020年,與全球家俱生產相比,前200強企業的銷售額下降有所緩和,這是由於主要參與者迅速調整其業務戰略並開闢新的銷售渠道(例如在線)。這是由於更大的財力允許他們引入並重新定位他們的供應鏈。 初步數據顯示,2022年全球200強企業產量將與2021年持平,而全球家具產量將下降3%。
這份報告對全球200強家具製造商進行了調查,並提供了系統的信息,包括全球家具行業概況、細分市場和區域分析,以及200家領先家具製造商的詳細概況。我來了。
亮點
內容
第一章引言:報告的目的和內容
第 2 章研究方法:註釋
第 1 部分:全球前 200 家家具製造商分析
第三章背景:全球家具行業與國際貿易概況
- 世界家具產量(2013-2022 年)
- 世界家具貿易(2013-2024 年)
第 4 章 200 強家具製造商:異構企業集團
- 精選世界領先的家具製造商
- 全球家具行業 200 強家具製造商的代表
- 區域範圍
- 前 200 家家具製造商的製造工廠:基地數量和位置
- 200 強公司:按家具細分市場特徵
- 財務業績:銷售和就業(細分:按總部所在地和家具細分市場特徵)
- 前 200 家家具製造商的表現
- 200 強家具銷售和全球家俱生產
- 200 強公司的家具銷售額:按總部位置和產品特性分類
- 200 強家具製造商:併購
第 2 部分:200 強家具製造商概況
第五章全球家具製造商200強
- 概覽:按字母順序排列,歐洲、美洲、亞太地區
- 公司簡介:所有上市家具製造商
- 公司名稱、成立年份、總部、網站、電子郵件地址
- 業務活動、產品組合/產品特性、管理的公司/子公司
- 財務指標、總銷售額和員工人數趨勢、按地區劃分的銷售額明細
- 按生產設施和產品細分的銷售額
The report "Top 200 furniture manufacturers worldwide" is the result of CSIL's extensive research to identify, compare and profile the leading furniture manufacturers in the world.
The output of the research is organized into two sections:
I. OVERVIEW OF THE WORLD FURNITURE SECTOR: background information, evolution of the world furniture production by geographical region for the time frame 2013-2022, and international trade of furniture.
The chapter Top 200 furniture manufacturers: a heterogeneous group of companies presents aggregated statistics and comparative analysis according to:
- Geographical coverage: Headquarters and manufacturing plants number and location
- Financial performance: turnover and number of employees
- Strategies: manufacturing footprint, mergers and acquisitions
- Furniture segment specialization
II. DETAILED PROFILES OF THE TOP 200 FURNITURE MANUFACTURERS:
- Company name, year of establishment, headquarters, website, e-mail address
- Business activity, product portfolio and product specialization, controlled companies and subsidiaries
- Financial indicators, trends in total revenues and number of employees, sales breakdown by geographical area
- Production facilities and sales breakdown by product
Summary tables, with basic company data in alphabetical order and broken down by country and geographical area (Europe, Americas, Asia and Pacific) are also provided.
The segments identified are: Office furniture; Kitchen furniture, Upholstered furniture; Soft furniture, Outdoor furniture and Multiproduct furniture (including the mentioned segments plus other furniture, e.g. dining/living room furniture, bedrooms, bathroom, etc.). A group of companies is identified as Multiproduct when they are not specialized in furniture production.
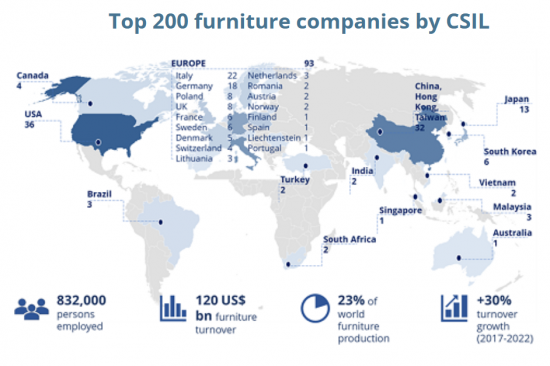
Countries covered: The selected companies have headquarters in the following countries: Australia, Austria, Brazil, Canada, China, Denmark, Finland, France, Germany, Hong Kong, China, India, Italy, Japan, Liechtenstein, Lithuania, Malaysia, Netherlands, Norway, Poland, Portugal, Romania, Singapore, South Africa, South Korea, Spain, Sweden, Switzerland, Taiwan, Turkey, United Kingdom, United States, Vietnam.
Highlights:
The total turnover of the top 200 furniture manufacturers increased by over 30% from 2017 to 2022. The trend indicates that the growth of the Top 200 companies was higher than that of the sector in terms of sales. In 2020, the decrease in sales of the Top 200 manufacturers had been contained comparing the world furniture production, driven by larger financial capabilities that allowed leading companies to quickly re-align business strategies, implement new sales channels (e.g. online), and reposition their supply chain. Preliminary results show that even in 2022, the Top 200 maintained the same level as in 2021, whereas world furniture production decreased by 3%.
The Top 200 are spread all over the world. They have headquarters in 30 countries.
Regarding furniture turnover, top companies from Asia and the Pacific account for nearly 40% of the total furniture turnover generated by the top 200 companies. European and Americas companies account for 30% each.
TABLE OF CONTENTS
1. INTRODUCTION: Aim of the report and contents
2. METHODOLOGICAL NOTES
SECTION ONE: ANALYSIS OF THE TOP 200 FURNITURE MANUFACTURERS ON A GLOBAL LEVEL
3. THE BACKGROUND: Overview of the world furniture industry and international trade
- World furniture production, 2013-2022
- World furniture trade, 2013-2024
4. TOP 200 FURNITURE MANUFACTURERS: A HETEROGENEOUS GROUP OF COMPANIES
- 4.1. Selection of the world leading furniture manufacturers
- 4.2. Top 200 furniture manufacturers' representativeness in the world furniture industry
- 4.3. Geographical coverage
- 4.4. Manufacturing plants of the Top 200 furniture manufacturers: number and location
- 4.5. Top 200 by furniture segment specialization
- 4.6. Financial performace: Turnover and employment. Breakdown by by geographical location of headquarters and by company specialization in the furniture segment
- 4.7. Business performance of the Top 200 furniture manufacturers
- Top 200 furniture turnover and world furniture production
- Top 200 furniture turnover by geographical area of headquarters and by product specialization
- 4.8. Top 200 furniture manufacturers: M&A
SECTION TWO: TOP 200 FURNITURE MANUFACTURERS PROFILES
5. TOP 200 FURNITURE MANUFACTURERS WORLDWIDE
- 5.1. Summary tables: Alphabetical order, Europe, Americas and Asia Pacific
- 5.2. Company profiles. For each considered furniture manufacturer
- Company name, year of establishment, headquarters, website, e-mail address
- Business activity, product portfolio and product specialization, controlled companies and subsidiaries
- Financial indicators, trends in total revenues and number of employees, sales breakdown by geographical area
- Production facilities and sales breakdown by product
 2024-2032 年按材料(金屬、木材、塑膠、玻璃等)、配銷通路(超市和大賣場、專賣店、線上商店等)、最終用途(住宅、商業)和地區分類的家具市場報告
 全球兒童家具市場研究報告 - 2024年至2032年產業分析、規模、佔有率、成長、趨勢與預測
 家具零售市場:按類型、分銷管道、應用分類 - 2024-2030 年全球預測
 鋁製家具市場:按應用、按產品、最終用戶分類 - 全球預測 2024-2030
 客廳與餐廳市場:按類型、通路分類 - 2024-2030 年全球預測
 輔助家具市場:按類型、按應用分類 - 2024-2030 年全球預測
 全球塑膠家具市場研究報告 - 2024 年至 2032 年產業分析、規模、佔有率、成長、趨勢和預測
 全球高度可調辦公桌市場研究報告 - 2024 年至 2032 年行業分析、規模、佔有率、成長、趨勢和預測
 展示架市場:依產品類型、依材料類型、依最終用途、依配銷通路、按地區
 塑膠家具市場:2023-2028 年全球產業趨勢、佔有率、規模、成長、機會與預測