


 |
市場調查報告書
商品編碼
1298253
實驗室生長鑽石市場:按生產方法、按尺寸、按屬性、按應用:全球機遇2021-2031 年分析和行業預測Lab Grown Diamonds Market By Manufacturing Method (HPHT, CVD), By Size (Below 2 carat, 2-4 carat, Above 4 carat), By Nature (Colorless, Colored), By Application (Fashion, Industrial): Global Opportunity Analysis and Industry Forecast, 2021-2031 |
||||||
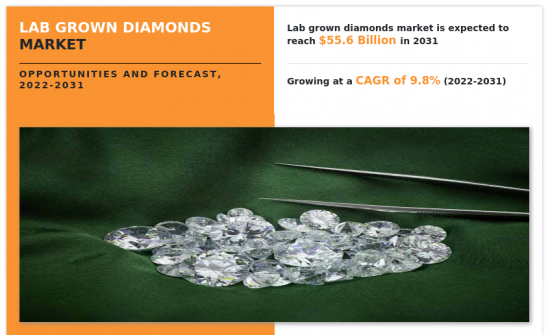
2021 年全球實驗室培育鑽石市場規模為 222 億美元,預計到 2031 年將達到 555 億美元,2022 年至 2031 年復合年增長率為 9.8%。
金剛石廣泛應用於工業領域和機械工程工作中的鋸、鑽、拋光機和刀具等工具中。金剛石鑽頭和金剛石塗層鋸片使切割和鑽孔任務變得快速、輕鬆。各種磨粒的金剛石粉也用作工業磨料。摻硼的實驗室生長鑽石具有類似半導體的特性,超越了傳統使用的有機矽,並且正在代替有機矽用作電子設備的關鍵組件。一些拋光鑽石用於各種光學應用,例如粒子加速器、激光系統和其他類似的高功率儀器。在醫療領域,正在進行調查以確定鑽石在精密手術器械的假肢和組件中的潛在用途。現在,皮膚科醫生在某些化療治療中使用它來去除皮膚角質,以幫助患者吸收藥物。鑽石的這種工業用途和進一步的研究預計將導致市場擴張。
在實驗室或工廠培育鑽石的技術最早於 20 世紀 50 年代以高溫高壓 (HPHT) 形式發明。該技術用於生產小型且主要用於工業應用的鑽石。CVD 鑽石製造技術於 20 世紀 80 年代發明,鑽石製造技術的進一步創新催生了製造 10 克拉或以上大鑽石的技術。可再生能源在鑽石生產中的使用越來越多,使用激光技術切割鑽石也獲得了更多的市場認可。進一步的研究和創新將使實驗室製造鑽石的生產變得更容易、更高效,預計這將在未來幾年對市場產生非常積極的影響。
實驗室培育鑽石市場在疫情初期受到嚴重影響,但市場在 2020 年底開始復蘇。中國和印度的供應鏈中斷對市場產生了負面影響。也就是說,預計市場在未來幾年將獲得強勁動力。
目錄
第 1 章 簡介
第二章執行摘要
第三章市場概況
- 市場定義和範圍
- 主要發現
- 影響因素
- 主要投資機會
- 波特五力分析
- 供應商的議價能力
- 買方議價能力
- 替代品的威脅
- 新進入者的威脅
- 競爭強度
- 市場動態
- 促進者
- 有關實驗室製造鑽石的錯誤信息
- 抑製劑
- 越來越多地在時尚珠寶中使用實驗室製造的鑽石
- 增加鑽石的工業用途
- 實驗室製造鑽石作為一種經濟高效的替代品的可用性
- 實驗室培育鑽石的可持續生產方法對客戶更具吸引力
- 機會
- 增加寶石和珠寶的定制
- 改進金剛石生產技術
- 促進者
- COVID-19 的市場影響分析
4 實驗室培育鑽石市場(按生產方法)
- 概述
- 市場規模及預測
- 高溫高壓
- 主要市場趨勢、增長動力和機遇
- 市場規模/預測:按地區
- 市場份額分析:按國家分類
- CVD
- 主要市場趨勢、增長動力和機遇
- 市場規模/預測:按地區
- 市場份額分析:按國家分類
5 實驗室培育鑽石市場:按尺寸分類
- 概述
- 市場規模和預測
- 2克拉或以下
- 主要市場趨勢、增長動力和機遇
- 市場規模/預測:按地區
- 市場份額分析:按國家分類
- 2至4克拉
- 主要市場趨勢、增長動力和機遇
- 市場規模/預測:按地區
- 市場份額分析:按國家分類
- 4克拉或以上
- 主要市場趨勢、增長動力和機遇
- 市場規模/預測:按地區
- 市場份額分析:按國家分類
6 實驗室培育鑽石市場:按屬性分類
- 概述
- 市場規模和預測
- 無色
- 主要市場趨勢、增長動力和機遇
- 市場規模/預測:按地區
- 市場份額分析:按國家分類
- 顏色
- 主要市場趨勢、增長動力和機遇
- 市場規模/預測:按地區
- 市場份額分析:按國家分類
7. 實驗室培育鑽石市場(按應用)
- 概述
- 市場規模/預測
- 時尚
- 主要市場趨勢、增長動力和機遇
- 市場規模/預測:按地區
- 市場份額分析:按國家分類
- 行業
- 主要市場趨勢、增長動力和機遇
- 市場規模/預測:按地區
- 市場份額分析:按國家分類
8. 實驗室培育鑽石市場(按地區)
- 概述
- 市場規模/預測:按地區
- 北美
- 主要趨勢和機遇
- 市場規模/預測:按製造方法分類
- 市場規模/預測:按規模
- 市場規模/預測:按屬性分類
- 市場規模/預測:按應用
- 市場規模/預測:按國家
- 美國
- 主要市場趨勢、增長動力和機遇
- 市場規模/預測:按製造方法分類
- 市場規模/預測:按規模
- 市場規模/預測:按屬性分類
- 市場規模/預測:按應用
- 墨西哥
- 主要市場趨勢、增長動力和機遇
- 市場規模/預測:按製造方法分類
- 市場規模/預測:按規模
- 市場規模/預測:按屬性分類
- 市場規模/預測:按應用
- 加拿大
- 主要市場趨勢、增長動力和機遇
- 市場規模/預測:按製造方法分類
- 市場規模/預測:按規模
- 市場規模/預測:按屬性分類
- 市場規模/預測:按應用
- 歐洲
- 主要趨勢和機遇
- 市場規模/預測:按製造方法分類
- 市場規模/預測:按規模
- 市場規模/預測:按屬性分類
- 市場規模/預測:按應用
- 市場規模/預測:按國家
- 英國
- 主要市場趨勢、增長動力和機遇
- 市場規模/預測:按製造方法分類
- 市場規模/預測:按規模
- 市場規模/預測:按屬性分類
- 市場規模/預測:按應用
- 德國
- 主要市場趨勢、增長動力和機遇
- 市場規模/預測:按製造方法分類
- 市場規模/預測:按規模
- 市場規模/預測:按屬性分類
- 市場規模/預測:按應用
- 法國
- 主要市場趨勢、增長動力和機遇
- 市場規模/預測:按製造方法分類
- 市場規模/預測:按規模
- 市場規模/預測:按屬性分類
- 市場規模/預測:按應用
- 意大利
- 主要市場趨勢、增長動力和機遇
- 市場規模/預測:按製造方法分類
- 市場規模/預測:按規模
- 市場規模/預測:按屬性分類
- 市場規模/預測:按應用
- 西班牙
- 主要市場趨勢、增長動力和機遇
- 市場規模/預測:按製造方法分類
- 市場規模/預測:按規模
- 市場規模/預測:按屬性分類
- 市場規模/預測:按應用
- 歐洲其他地區
- 主要市場趨勢、增長動力和機遇
- 市場規模/預測:按製造方法分類
- 市場規模/預測:按規模
- 市場規模/預測:按屬性分類
- 市場規模/預測:按應用
- 亞太地區
- 主要趨勢和機遇
- 市場規模/預測:按製造方法分類
- 市場規模/預測:按規模
- 市場規模/預測:按屬性分類
- 市場規模/預測:按應用
- 市場規模/預測:按國家
- 中國
- 主要市場趨勢、增長動力和機遇
- 市場規模/預測:按製造方法分類
- 市場規模/預測:按規模
- 市場規模/預測:按屬性分類
- 市場規模/預測:按應用
- 日本
- 主要市場趨勢、增長動力和機遇
- 市場規模/預測:按製造方法分類
- 市場規模/預測:按規模
- 市場規模/預測:按屬性分類
- 市場規模/預測:按應用
- 印度
- 主要市場趨勢、增長動力和機遇
- 市場規模/預測:按製造方法分類
- 市場規模/預測:按規模
- 市場規模/預測:按屬性分類
- 市場規模/預測:按應用
- 澳大利亞
- 主要市場趨勢、增長動力和機遇
- 市場規模/預測:按製造方法分類
- 市場規模/預測:按規模
- 市場規模/預測:按屬性分類
- 市場規模/預測:按應用
- 韓國
- 主要市場趨勢、增長動力和機遇
- 市場規模/預測:按製造方法分類
- 市場規模/預測:按規模
- 市場規模/預測:按屬性分類
- 市場規模/預測:按應用
- 亞太其他地區
- 主要市場趨勢、增長動力和機遇
- 市場規模/預測:按製造方法分類
- 市場規模/預測:按規模
- 市場規模/預測:按屬性分類
- 市場規模/預測:按應用
- 拉丁美洲/中東/非洲
- 主要趨勢和機遇
- 市場規模/預測:按製造方法分類
- 市場規模/預測:按規模
- 市場規模/預測:按屬性分類
- 市場規模/預測:按應用
- 市場規模/預測:按國家
- 巴西
- 主要市場趨勢、增長動力和機遇
- 市場規模/預測:按製造方法分類
- 市場規模/預測:按規模
- 市場規模/預測:按屬性分類
- 市場規模/預測:按應用
- 阿根廷
- 主要市場趨勢、增長動力和機遇
- 市場規模/預測:按製造方法分類
- 市場規模/預測:按規模
- 市場規模/預測:按屬性分類
- 市場規模/預測:按應用
- 沙特阿拉伯
- 主要市場趨勢、增長動力和機遇
- 市場規模/預測:按製造方法分類
- 市場規模/預測:按規模
- 市場規模/預測:按屬性分類
- 市場規模/預測:按應用
- 阿拉伯聯合酋長國
- 主要市場趨勢、增長動力和機遇
- 市場規模/預測:按製造方法分類
- 市場規模/預測:按規模
- 市場規模/預測:按屬性分類
- 市場規模/預測:按應用
- 南非
- 主要市場趨勢、增長動力和機遇
- 市場規模/預測:按製造方法分類
- 市場規模/預測:按規模
- 市場規模/預測:按屬性分類
- 市場規模/預測:按應用
- 其他地區
- 主要市場趨勢、增長動力和機遇
- 市場規模/預測:按製造方法分類
- 市場規模/預測:按規模
- 市場規模/預測:按屬性分類
- 市場規模/預測:按應用
第9章 競爭格局
- 介紹
- 關鍵成功策略
- 10大公司產品圖
- 比賽儀表板
- 比賽熱圖
- 2021 年頂級公司定位
第十章公司簡介
- ABD Diamonds Pvt. Ltd.
- Clean Origin LLC.
- De Beers Group
- Diam Concept
- Diamond Foundry Inc.
- Henan Huanghe Whirlwind CO., Ltd.
- Mittal Diamonds
- New Diamond Technology LLC
- Swarovski AG
- WD Lab Grown Diamonds
The global lab grown diamonds market size was valued at $22.2 billion in 2021, and is projected reach $55.5 billion by 2031, registering a CAGR of 9.8% from 2022 to 2031.
Diamonds are heavily used in the industrial sector and mechanical engineering operations in tools such as saws, drills, polishers, and cutters. Diamond-tipped drill bits and diamond-coated saw blades makes cutting and drilling operations faster and easier. Different grits of powdered diamonds are also used as industrial abrasives. Lab grown diamonds with added boron have semiconductor-like properties that can exceed traditionally used silicone and replace silicone as a major component in electronic operations. Some polished diamonds are used for different optic applications such as particle accelerators, laser systems, and other similar high-powered equipment. Research is being conducted to check the usability of diamonds in the medical field in the form of components in prosthetics and high-precision surgical equipment. It is now been used by dermatologists for skin exfoliation in some types of chemotherapy to aid with the absorption of medicines into patient's body. These industrial applications of lab grown diamonds and further research into the same is expected to foster market expansion.
Techniques for growing diamonds in labs and factories were first invented in the 1950s, in the form of HPHT. It was used for the creation of diamonds that were small and mostly useful for industrial applications. CVD technology of creating diamonds was invented in the 1980s, and further innovation in diamond manufacturing technology led to the creation of techniques for making diamonds that were bigger and could reach sizes of 10 carats and more. Use of renewable energy in the making of diamonds is increasing and use of laser technology for cutting diamonds is also gaining more traction in the market. Further research and innovations can make lab grown diamonds production easier and more efficient, which is expected to have a very positive impact on the market in the upcoming years.
The lab grown diamonds market was significantly impacted during the initial phase of the pandemic, however, the market has started rebounding toward the end of 2020. Disruption in the supply chain across China and later from India negatively impacted the market, as these countries are the top exporters of lab grown diamonds across the world. Nevertheless, the market is expected to gain high momentum in the upcoming years.
The global lab grown diamonds market is segmented on the basis of the manufacturing method, size, nature, application, and region. By manufacturing method, the global market is bifurcated into HPHT and CVD. By size it is segmented into below 2 carat, 2-4 carat, and above 4 carat. By nature, it is bifurcated into colorless and colored. On the basis of application, it is studied across fashion and industry. The global lab grown diamonds market is also studied across North America, Europe, Asia-Pacific, and LAMEA.
Some of the major players profiled in the lab grown diamonds market analysis include: ABD Diamonds, Clean Origin, De Beers Group, Diam Concept, Diamond Foundry Inc., Henan Huanghe Whirlwind Co., Ltd, Mittal Diamonds, New Diamond Technology LLC, Swarovski AG, and WD Lab Grown Diamonds. Other prominent players analyzed in the report are Applied Diamond Inc., D.NEA Diamonds, Zhengzhou Sino-Crystal Diamond Co., Sahajanand Laser Technology Limited (SLTL Group), Finegrowndiamonds, Zhongnan Diamond Co. Ltd, and Sumitomo Electric Industries Ltd.
Key Benefits For Stakeholders
- This report provides a quantitative analysis of the market segments, current trends, estimations, and dynamics of the lab grown diamonds market analysis from 2021 to 2031 to identify the prevailing lab grown diamonds market opportunities.
- The market research is offered along with information related to key drivers, restraints, and opportunities.
- Porter's five forces analysis highlights the potency of buyers and suppliers to enable stakeholders make profit-oriented business decisions and strengthen their supplier-buyer network.
- In-depth analysis of the lab grown diamonds market segmentation assists to determine the prevailing market opportunities.
- Major countries in each region are mapped according to their revenue contribution to the global market.
- Market player positioning facilitates benchmarking and provides a clear understanding of the present position of the market players.
- The report includes the analysis of the regional as well as global lab grown diamonds market trends, key players, market segments, application areas, and market growth strategies.
Key Market Segments
By Manufacturing Method
- HPHT
- CVD
By Nature
- Colorless
- Colored
By Size
- 2-4 carat
- Above 4 carat
- Below 2 carat
By Application
- Fashion
- Industrial
By Region
- North America
- U.S.
- Mexico
- Canada
- Europe
- UK
- Germany
- France
- Italy
- Spain
- Rest of Europe
- Asia-Pacific
- China
- Japan
- India
- Australia
- South Korea
- Rest of Asia-Pacific
- LAMEA
- Brazil
- Argentina
- Saudi Arabia
- United Arab Emirates
- South Africa
- Rest of LAMEA
Key Market Players:
- WD Lab Grown Diamonds
- Mittal Diamonds
- Clean Origin LLC.
- ABD Diamonds Pvt. Ltd.
- Diamond Foundry Inc.
- Diam Concept
- New Diamond Technology LLC
- Swarovski AG
- De Beers Group
- Henan Huanghe Whirlwind CO., Ltd.
TABLE OF CONTENTS
CHAPTER 1: INTRODUCTION
- 1.1. Report description
- 1.2. Key market segments
- 1.3. Key benefits to the stakeholders
- 1.4. Research Methodology
- 1.4.1. Primary research
- 1.4.2. Secondary research
- 1.4.3. Analyst tools and models
CHAPTER 2: EXECUTIVE SUMMARY
- 2.1. CXO Perspective
CHAPTER 3: MARKET OVERVIEW
- 3.1. Market definition and scope
- 3.2. Key findings
- 3.2.1. Top impacting factors
- 3.2.2. Top investment pockets
- 3.3. Porter's five forces analysis
- 3.3.1. Bargaining power of suppliers
- 3.3.2. Bargaining power of buyers
- 3.3.3. Threat of substitutes
- 3.3.4. Threat of new entrants
- 3.3.5. Intensity of rivalry
- 3.4. Market dynamics
- 3.4.1. Drivers
- 3.4.1.1. Misinformation regarding lab grown diamonds
- 3.4.1. Drivers
- 3.4.2. Restraints
- 3.4.2.1. Increase in use of lab grown diamonds in fashion jewelry
- 3.4.2.2. Growth in number of industrial applications of diamonds
- 3.4.2.3. Availability of lab grown diamonds as a cost-effective alternatives
- 3.4.2.4. Sustainable methods for lab grown diamonds production make them more attractive for customers
- 3.4.3. Opportunities
- 3.4.3.1. Increase in customization of stones and jewelry
- 3.4.3.2. Improvements in diamond production technologies
- 3.5. COVID-19 Impact Analysis on the market
CHAPTER 4: LAB GROWN DIAMONDS MARKET, BY MANUFACTURING METHOD
- 4.1. Overview
- 4.1.1. Market size and forecast
- 4.2. HPHT
- 4.2.1. Key market trends, growth factors and opportunities
- 4.2.2. Market size and forecast, by region
- 4.2.3. Market share analysis by country
- 4.3. CVD
- 4.3.1. Key market trends, growth factors and opportunities
- 4.3.2. Market size and forecast, by region
- 4.3.3. Market share analysis by country
CHAPTER 5: LAB GROWN DIAMONDS MARKET, BY SIZE
- 5.1. Overview
- 5.1.1. Market size and forecast
- 5.2. Below 2 carat
- 5.2.1. Key market trends, growth factors and opportunities
- 5.2.2. Market size and forecast, by region
- 5.2.3. Market share analysis by country
- 5.3. 2-4 carat
- 5.3.1. Key market trends, growth factors and opportunities
- 5.3.2. Market size and forecast, by region
- 5.3.3. Market share analysis by country
- 5.4. Above 4 carat
- 5.4.1. Key market trends, growth factors and opportunities
- 5.4.2. Market size and forecast, by region
- 5.4.3. Market share analysis by country
CHAPTER 6: LAB GROWN DIAMONDS MARKET, BY NATURE
- 6.1. Overview
- 6.1.1. Market size and forecast
- 6.2. Colorless
- 6.2.1. Key market trends, growth factors and opportunities
- 6.2.2. Market size and forecast, by region
- 6.2.3. Market share analysis by country
- 6.3. Colored
- 6.3.1. Key market trends, growth factors and opportunities
- 6.3.2. Market size and forecast, by region
- 6.3.3. Market share analysis by country
CHAPTER 7: LAB GROWN DIAMONDS MARKET, BY APPLICATION
- 7.1. Overview
- 7.1.1. Market size and forecast
- 7.2. Fashion
- 7.2.1. Key market trends, growth factors and opportunities
- 7.2.2. Market size and forecast, by region
- 7.2.3. Market share analysis by country
- 7.3. Industrial
- 7.3.1. Key market trends, growth factors and opportunities
- 7.3.2. Market size and forecast, by region
- 7.3.3. Market share analysis by country
CHAPTER 8: LAB GROWN DIAMONDS MARKET, BY REGION
- 8.1. Overview
- 8.1.1. Market size and forecast By Region
- 8.2. North America
- 8.2.1. Key trends and opportunities
- 8.2.2. Market size and forecast, by Manufacturing Method
- 8.2.3. Market size and forecast, by Size
- 8.2.4. Market size and forecast, by Nature
- 8.2.5. Market size and forecast, by Application
- 8.2.6. Market size and forecast, by country
- 8.2.6.1. U.S.
- 8.2.6.1.1. Key market trends, growth factors and opportunities
- 8.2.6.1.2. Market size and forecast, by Manufacturing Method
- 8.2.6.1.3. Market size and forecast, by Size
- 8.2.6.1.4. Market size and forecast, by Nature
- 8.2.6.1.5. Market size and forecast, by Application
- 8.2.6.2. Mexico
- 8.2.6.2.1. Key market trends, growth factors and opportunities
- 8.2.6.2.2. Market size and forecast, by Manufacturing Method
- 8.2.6.2.3. Market size and forecast, by Size
- 8.2.6.2.4. Market size and forecast, by Nature
- 8.2.6.2.5. Market size and forecast, by Application
- 8.2.6.3. Canada
- 8.2.6.3.1. Key market trends, growth factors and opportunities
- 8.2.6.3.2. Market size and forecast, by Manufacturing Method
- 8.2.6.3.3. Market size and forecast, by Size
- 8.2.6.3.4. Market size and forecast, by Nature
- 8.2.6.3.5. Market size and forecast, by Application
- 8.3. Europe
- 8.3.1. Key trends and opportunities
- 8.3.2. Market size and forecast, by Manufacturing Method
- 8.3.3. Market size and forecast, by Size
- 8.3.4. Market size and forecast, by Nature
- 8.3.5. Market size and forecast, by Application
- 8.3.6. Market size and forecast, by country
- 8.3.6.1. UK
- 8.3.6.1.1. Key market trends, growth factors and opportunities
- 8.3.6.1.2. Market size and forecast, by Manufacturing Method
- 8.3.6.1.3. Market size and forecast, by Size
- 8.3.6.1.4. Market size and forecast, by Nature
- 8.3.6.1.5. Market size and forecast, by Application
- 8.3.6.2. Germany
- 8.3.6.2.1. Key market trends, growth factors and opportunities
- 8.3.6.2.2. Market size and forecast, by Manufacturing Method
- 8.3.6.2.3. Market size and forecast, by Size
- 8.3.6.2.4. Market size and forecast, by Nature
- 8.3.6.2.5. Market size and forecast, by Application
- 8.3.6.3. France
- 8.3.6.3.1. Key market trends, growth factors and opportunities
- 8.3.6.3.2. Market size and forecast, by Manufacturing Method
- 8.3.6.3.3. Market size and forecast, by Size
- 8.3.6.3.4. Market size and forecast, by Nature
- 8.3.6.3.5. Market size and forecast, by Application
- 8.3.6.4. Italy
- 8.3.6.4.1. Key market trends, growth factors and opportunities
- 8.3.6.4.2. Market size and forecast, by Manufacturing Method
- 8.3.6.4.3. Market size and forecast, by Size
- 8.3.6.4.4. Market size and forecast, by Nature
- 8.3.6.4.5. Market size and forecast, by Application
- 8.3.6.5. Spain
- 8.3.6.5.1. Key market trends, growth factors and opportunities
- 8.3.6.5.2. Market size and forecast, by Manufacturing Method
- 8.3.6.5.3. Market size and forecast, by Size
- 8.3.6.5.4. Market size and forecast, by Nature
- 8.3.6.5.5. Market size and forecast, by Application
- 8.3.6.6. Rest of Europe
- 8.3.6.6.1. Key market trends, growth factors and opportunities
- 8.3.6.6.2. Market size and forecast, by Manufacturing Method
- 8.3.6.6.3. Market size and forecast, by Size
- 8.3.6.6.4. Market size and forecast, by Nature
- 8.3.6.6.5. Market size and forecast, by Application
- 8.4. Asia-Pacific
- 8.4.1. Key trends and opportunities
- 8.4.2. Market size and forecast, by Manufacturing Method
- 8.4.3. Market size and forecast, by Size
- 8.4.4. Market size and forecast, by Nature
- 8.4.5. Market size and forecast, by Application
- 8.4.6. Market size and forecast, by country
- 8.4.6.1. China
- 8.4.6.1.1. Key market trends, growth factors and opportunities
- 8.4.6.1.2. Market size and forecast, by Manufacturing Method
- 8.4.6.1.3. Market size and forecast, by Size
- 8.4.6.1.4. Market size and forecast, by Nature
- 8.4.6.1.5. Market size and forecast, by Application
- 8.4.6.2. Japan
- 8.4.6.2.1. Key market trends, growth factors and opportunities
- 8.4.6.2.2. Market size and forecast, by Manufacturing Method
- 8.4.6.2.3. Market size and forecast, by Size
- 8.4.6.2.4. Market size and forecast, by Nature
- 8.4.6.2.5. Market size and forecast, by Application
- 8.4.6.3. India
- 8.4.6.3.1. Key market trends, growth factors and opportunities
- 8.4.6.3.2. Market size and forecast, by Manufacturing Method
- 8.4.6.3.3. Market size and forecast, by Size
- 8.4.6.3.4. Market size and forecast, by Nature
- 8.4.6.3.5. Market size and forecast, by Application
- 8.4.6.4. Australia
- 8.4.6.4.1. Key market trends, growth factors and opportunities
- 8.4.6.4.2. Market size and forecast, by Manufacturing Method
- 8.4.6.4.3. Market size and forecast, by Size
- 8.4.6.4.4. Market size and forecast, by Nature
- 8.4.6.4.5. Market size and forecast, by Application
- 8.4.6.5. South Korea
- 8.4.6.5.1. Key market trends, growth factors and opportunities
- 8.4.6.5.2. Market size and forecast, by Manufacturing Method
- 8.4.6.5.3. Market size and forecast, by Size
- 8.4.6.5.4. Market size and forecast, by Nature
- 8.4.6.5.5. Market size and forecast, by Application
- 8.4.6.6. Rest of Asia-Pacific
- 8.4.6.6.1. Key market trends, growth factors and opportunities
- 8.4.6.6.2. Market size and forecast, by Manufacturing Method
- 8.4.6.6.3. Market size and forecast, by Size
- 8.4.6.6.4. Market size and forecast, by Nature
- 8.4.6.6.5. Market size and forecast, by Application
- 8.5. LAMEA
- 8.5.1. Key trends and opportunities
- 8.5.2. Market size and forecast, by Manufacturing Method
- 8.5.3. Market size and forecast, by Size
- 8.5.4. Market size and forecast, by Nature
- 8.5.5. Market size and forecast, by Application
- 8.5.6. Market size and forecast, by country
- 8.5.6.1. Brazil
- 8.5.6.1.1. Key market trends, growth factors and opportunities
- 8.5.6.1.2. Market size and forecast, by Manufacturing Method
- 8.5.6.1.3. Market size and forecast, by Size
- 8.5.6.1.4. Market size and forecast, by Nature
- 8.5.6.1.5. Market size and forecast, by Application
- 8.5.6.2. Argentina
- 8.5.6.2.1. Key market trends, growth factors and opportunities
- 8.5.6.2.2. Market size and forecast, by Manufacturing Method
- 8.5.6.2.3. Market size and forecast, by Size
- 8.5.6.2.4. Market size and forecast, by Nature
- 8.5.6.2.5. Market size and forecast, by Application
- 8.5.6.3. Saudi Arabia
- 8.5.6.3.1. Key market trends, growth factors and opportunities
- 8.5.6.3.2. Market size and forecast, by Manufacturing Method
- 8.5.6.3.3. Market size and forecast, by Size
- 8.5.6.3.4. Market size and forecast, by Nature
- 8.5.6.3.5. Market size and forecast, by Application
- 8.5.6.4. United Arab Emirates
- 8.5.6.4.1. Key market trends, growth factors and opportunities
- 8.5.6.4.2. Market size and forecast, by Manufacturing Method
- 8.5.6.4.3. Market size and forecast, by Size
- 8.5.6.4.4. Market size and forecast, by Nature
- 8.5.6.4.5. Market size and forecast, by Application
- 8.5.6.5. South Africa
- 8.5.6.5.1. Key market trends, growth factors and opportunities
- 8.5.6.5.2. Market size and forecast, by Manufacturing Method
- 8.5.6.5.3. Market size and forecast, by Size
- 8.5.6.5.4. Market size and forecast, by Nature
- 8.5.6.5.5. Market size and forecast, by Application
- 8.5.6.6. Rest of LAMEA
- 8.5.6.6.1. Key market trends, growth factors and opportunities
- 8.5.6.6.2. Market size and forecast, by Manufacturing Method
- 8.5.6.6.3. Market size and forecast, by Size
- 8.5.6.6.4. Market size and forecast, by Nature
- 8.5.6.6.5. Market size and forecast, by Application
CHAPTER 9: COMPETITIVE LANDSCAPE
- 9.1. Introduction
- 9.2. Top winning strategies
- 9.3. Product Mapping of Top 10 Player
- 9.4. Competitive Dashboard
- 9.5. Competitive Heatmap
- 9.6. Top player positioning, 2021
CHAPTER 10: COMPANY PROFILES
- 10.1. ABD Diamonds Pvt. Ltd.
- 10.1.1. Company overview
- 10.1.2. Key Executives
- 10.1.3. Company snapshot
- 10.1.4. Operating business segments
- 10.1.5. Product portfolio
- 10.2. Clean Origin LLC.
- 10.2.1. Company overview
- 10.2.2. Key Executives
- 10.2.3. Company snapshot
- 10.2.4. Operating business segments
- 10.2.5. Product portfolio
- 10.2.6. Key strategic moves and developments
- 10.3. De Beers Group
- 10.3.1. Company overview
- 10.3.2. Key Executives
- 10.3.3. Company snapshot
- 10.3.4. Operating business segments
- 10.3.5. Product portfolio
- 10.3.6. Business performance
- 10.3.7. Key strategic moves and developments
- 10.4. Diam Concept
- 10.4.1. Company overview
- 10.4.2. Key Executives
- 10.4.3. Company snapshot
- 10.4.4. Operating business segments
- 10.4.5. Product portfolio
- 10.5. Diamond Foundry Inc.
- 10.5.1. Company overview
- 10.5.2. Key Executives
- 10.5.3. Company snapshot
- 10.5.4. Operating business segments
- 10.5.5. Product portfolio
- 10.5.6. Key strategic moves and developments
- 10.6. Henan Huanghe Whirlwind CO., Ltd.
- 10.6.1. Company overview
- 10.6.2. Key Executives
- 10.6.3. Company snapshot
- 10.6.4. Operating business segments
- 10.6.5. Product portfolio
- 10.7. Mittal Diamonds
- 10.7.1. Company overview
- 10.7.2. Key Executives
- 10.7.3. Company snapshot
- 10.7.4. Operating business segments
- 10.7.5. Product portfolio
- 10.8. New Diamond Technology LLC
- 10.8.1. Company overview
- 10.8.2. Key Executives
- 10.8.3. Company snapshot
- 10.8.4. Operating business segments
- 10.8.5. Product portfolio
- 10.9. Swarovski AG
- 10.9.1. Company overview
- 10.9.2. Key Executives
- 10.9.3. Company snapshot
- 10.9.4. Operating business segments
- 10.9.5. Product portfolio
- 10.9.6. Key strategic moves and developments
- 10.10. WD Lab Grown Diamonds
- 10.10.1. Company overview
- 10.10.2. Key Executives
- 10.10.3. Company snapshot
- 10.10.4. Operating business segments
- 10.10.5. Product portfolio
- 10.10.6. Key strategic moves and developments
LIST OF TABLES
- TABLE 01. GLOBAL LAB GROWN DIAMONDS MARKET, BY MANUFACTURING METHOD, 2021-2031 ($MILLION)
- TABLE 02. LAB GROWN DIAMONDS MARKET FOR HPHT, BY REGION, 2021-2031 ($MILLION)
- TABLE 03. LAB GROWN DIAMONDS MARKET FOR CVD, BY REGION, 2021-2031 ($MILLION)
- TABLE 04. GLOBAL LAB GROWN DIAMONDS MARKET, BY SIZE, 2021-2031 ($MILLION)
- TABLE 05. LAB GROWN DIAMONDS MARKET FOR BELOW 2 CARAT, BY REGION, 2021-2031 ($MILLION)
- TABLE 06. LAB GROWN DIAMONDS MARKET FOR 2-4 CARAT, BY REGION, 2021-2031 ($MILLION)
- TABLE 07. LAB GROWN DIAMONDS MARKET FOR ABOVE 4 CARAT, BY REGION, 2021-2031 ($MILLION)
- TABLE 08. GLOBAL LAB GROWN DIAMONDS MARKET, BY NATURE, 2021-2031 ($MILLION)
- TABLE 09. LAB GROWN DIAMONDS MARKET FOR COLORLESS, BY REGION, 2021-2031 ($MILLION)
- TABLE 10. LAB GROWN DIAMONDS MARKET FOR COLORED, BY REGION, 2021-2031 ($MILLION)
- TABLE 11. GLOBAL LAB GROWN DIAMONDS MARKET, BY APPLICATION, 2021-2031 ($MILLION)
- TABLE 12. LAB GROWN DIAMONDS MARKET FOR FASHION, BY REGION, 2021-2031 ($MILLION)
- TABLE 13. LAB GROWN DIAMONDS MARKET FOR INDUSTRIAL, BY REGION, 2021-2031 ($MILLION)
- TABLE 14. LAB GROWN DIAMONDS MARKET, BY REGION, 2021-2031 ($MILLION)
- TABLE 15. NORTH AMERICA LAB GROWN DIAMONDS MARKET, BY MANUFACTURING METHOD, 2021-2031 ($MILLION)
- TABLE 16. NORTH AMERICA LAB GROWN DIAMONDS MARKET, BY SIZE, 2021-2031 ($MILLION)
- TABLE 17. NORTH AMERICA LAB GROWN DIAMONDS MARKET, BY NATURE, 2021-2031 ($MILLION)
- TABLE 18. NORTH AMERICA LAB GROWN DIAMONDS MARKET, BY APPLICATION, 2021-2031 ($MILLION)
- TABLE 19. NORTH AMERICA LAB GROWN DIAMONDS MARKET, BY COUNTRY, 2021-2031 ($MILLION)
- TABLE 20. U.S. LAB GROWN DIAMONDS MARKET, BY MANUFACTURING METHOD, 2021-2031 ($MILLION)
- TABLE 21. U.S. LAB GROWN DIAMONDS MARKET, BY SIZE, 2021-2031 ($MILLION)
- TABLE 22. U.S. LAB GROWN DIAMONDS MARKET, BY NATURE, 2021-2031 ($MILLION)
- TABLE 23. U.S. LAB GROWN DIAMONDS MARKET, BY APPLICATION, 2021-2031 ($MILLION)
- TABLE 24. MEXICO LAB GROWN DIAMONDS MARKET, BY MANUFACTURING METHOD, 2021-2031 ($MILLION)
- TABLE 25. MEXICO LAB GROWN DIAMONDS MARKET, BY SIZE, 2021-2031 ($MILLION)
- TABLE 26. MEXICO LAB GROWN DIAMONDS MARKET, BY NATURE, 2021-2031 ($MILLION)
- TABLE 27. MEXICO LAB GROWN DIAMONDS MARKET, BY APPLICATION, 2021-2031 ($MILLION)
- TABLE 28. CANADA LAB GROWN DIAMONDS MARKET, BY MANUFACTURING METHOD, 2021-2031 ($MILLION)
- TABLE 29. CANADA LAB GROWN DIAMONDS MARKET, BY SIZE, 2021-2031 ($MILLION)
- TABLE 30. CANADA LAB GROWN DIAMONDS MARKET, BY NATURE, 2021-2031 ($MILLION)
- TABLE 31. CANADA LAB GROWN DIAMONDS MARKET, BY APPLICATION, 2021-2031 ($MILLION)
- TABLE 32. EUROPE LAB GROWN DIAMONDS MARKET, BY MANUFACTURING METHOD, 2021-2031 ($MILLION)
- TABLE 33. EUROPE LAB GROWN DIAMONDS MARKET, BY SIZE, 2021-2031 ($MILLION)
- TABLE 34. EUROPE LAB GROWN DIAMONDS MARKET, BY NATURE, 2021-2031 ($MILLION)
- TABLE 35. EUROPE LAB GROWN DIAMONDS MARKET, BY APPLICATION, 2021-2031 ($MILLION)
- TABLE 36. EUROPE LAB GROWN DIAMONDS MARKET, BY COUNTRY, 2021-2031 ($MILLION)
- TABLE 37. UK LAB GROWN DIAMONDS MARKET, BY MANUFACTURING METHOD, 2021-2031 ($MILLION)
- TABLE 38. UK LAB GROWN DIAMONDS MARKET, BY SIZE, 2021-2031 ($MILLION)
- TABLE 39. UK LAB GROWN DIAMONDS MARKET, BY NATURE, 2021-2031 ($MILLION)
- TABLE 40. UK LAB GROWN DIAMONDS MARKET, BY APPLICATION, 2021-2031 ($MILLION)
- TABLE 41. GERMANY LAB GROWN DIAMONDS MARKET, BY MANUFACTURING METHOD, 2021-2031 ($MILLION)
- TABLE 42. GERMANY LAB GROWN DIAMONDS MARKET, BY SIZE, 2021-2031 ($MILLION)
- TABLE 43. GERMANY LAB GROWN DIAMONDS MARKET, BY NATURE, 2021-2031 ($MILLION)
- TABLE 44. GERMANY LAB GROWN DIAMONDS MARKET, BY APPLICATION, 2021-2031 ($MILLION)
- TABLE 45. FRANCE LAB GROWN DIAMONDS MARKET, BY MANUFACTURING METHOD, 2021-2031 ($MILLION)
- TABLE 46. FRANCE LAB GROWN DIAMONDS MARKET, BY SIZE, 2021-2031 ($MILLION)
- TABLE 47. FRANCE LAB GROWN DIAMONDS MARKET, BY NATURE, 2021-2031 ($MILLION)
- TABLE 48. FRANCE LAB GROWN DIAMONDS MARKET, BY APPLICATION, 2021-2031 ($MILLION)
- TABLE 49. ITALY LAB GROWN DIAMONDS MARKET, BY MANUFACTURING METHOD, 2021-2031 ($MILLION)
- TABLE 50. ITALY LAB GROWN DIAMONDS MARKET, BY SIZE, 2021-2031 ($MILLION)
- TABLE 51. ITALY LAB GROWN DIAMONDS MARKET, BY NATURE, 2021-2031 ($MILLION)
- TABLE 52. ITALY LAB GROWN DIAMONDS MARKET, BY APPLICATION, 2021-2031 ($MILLION)
- TABLE 53. SPAIN LAB GROWN DIAMONDS MARKET, BY MANUFACTURING METHOD, 2021-2031 ($MILLION)
- TABLE 54. SPAIN LAB GROWN DIAMONDS MARKET, BY SIZE, 2021-2031 ($MILLION)
- TABLE 55. SPAIN LAB GROWN DIAMONDS MARKET, BY NATURE, 2021-2031 ($MILLION)
- TABLE 56. SPAIN LAB GROWN DIAMONDS MARKET, BY APPLICATION, 2021-2031 ($MILLION)
- TABLE 57. REST OF EUROPE LAB GROWN DIAMONDS MARKET, BY MANUFACTURING METHOD, 2021-2031 ($MILLION)
- TABLE 58. REST OF EUROPE LAB GROWN DIAMONDS MARKET, BY SIZE, 2021-2031 ($MILLION)
- TABLE 59. REST OF EUROPE LAB GROWN DIAMONDS MARKET, BY NATURE, 2021-2031 ($MILLION)
- TABLE 60. REST OF EUROPE LAB GROWN DIAMONDS MARKET, BY APPLICATION, 2021-2031 ($MILLION)
- TABLE 61. ASIA-PACIFIC LAB GROWN DIAMONDS MARKET, BY MANUFACTURING METHOD, 2021-2031 ($MILLION)
- TABLE 62. ASIA-PACIFIC LAB GROWN DIAMONDS MARKET, BY SIZE, 2021-2031 ($MILLION)
- TABLE 63. ASIA-PACIFIC LAB GROWN DIAMONDS MARKET, BY NATURE, 2021-2031 ($MILLION)
- TABLE 64. ASIA-PACIFIC LAB GROWN DIAMONDS MARKET, BY APPLICATION, 2021-2031 ($MILLION)
- TABLE 65. ASIA-PACIFIC LAB GROWN DIAMONDS MARKET, BY COUNTRY, 2021-2031 ($MILLION)
- TABLE 66. CHINA LAB GROWN DIAMONDS MARKET, BY MANUFACTURING METHOD, 2021-2031 ($MILLION)
- TABLE 67. CHINA LAB GROWN DIAMONDS MARKET, BY SIZE, 2021-2031 ($MILLION)
- TABLE 68. CHINA LAB GROWN DIAMONDS MARKET, BY NATURE, 2021-2031 ($MILLION)
- TABLE 69. CHINA LAB GROWN DIAMONDS MARKET, BY APPLICATION, 2021-2031 ($MILLION)
- TABLE 70. JAPAN LAB GROWN DIAMONDS MARKET, BY MANUFACTURING METHOD, 2021-2031 ($MILLION)
- TABLE 71. JAPAN LAB GROWN DIAMONDS MARKET, BY SIZE, 2021-2031 ($MILLION)
- TABLE 72. JAPAN LAB GROWN DIAMONDS MARKET, BY NATURE, 2021-2031 ($MILLION)
- TABLE 73. JAPAN LAB GROWN DIAMONDS MARKET, BY APPLICATION, 2021-2031 ($MILLION)
- TABLE 74. INDIA LAB GROWN DIAMONDS MARKET, BY MANUFACTURING METHOD, 2021-2031 ($MILLION)
- TABLE 75. INDIA LAB GROWN DIAMONDS MARKET, BY SIZE, 2021-2031 ($MILLION)
- TABLE 76. INDIA LAB GROWN DIAMONDS MARKET, BY NATURE, 2021-2031 ($MILLION)
- TABLE 77. INDIA LAB GROWN DIAMONDS MARKET, BY APPLICATION, 2021-2031 ($MILLION)
- TABLE 78. AUSTRALIA LAB GROWN DIAMONDS MARKET, BY MANUFACTURING METHOD, 2021-2031 ($MILLION)
- TABLE 79. AUSTRALIA LAB GROWN DIAMONDS MARKET, BY SIZE, 2021-2031 ($MILLION)
- TABLE 80. AUSTRALIA LAB GROWN DIAMONDS MARKET, BY NATURE, 2021-2031 ($MILLION)
- TABLE 81. AUSTRALIA LAB GROWN DIAMONDS MARKET, BY APPLICATION, 2021-2031 ($MILLION)
- TABLE 82. SOUTH KOREA LAB GROWN DIAMONDS MARKET, BY MANUFACTURING METHOD, 2021-2031 ($MILLION)
- TABLE 83. SOUTH KOREA LAB GROWN DIAMONDS MARKET, BY SIZE, 2021-2031 ($MILLION)
- TABLE 84. SOUTH KOREA LAB GROWN DIAMONDS MARKET, BY NATURE, 2021-2031 ($MILLION)
- TABLE 85. SOUTH KOREA LAB GROWN DIAMONDS MARKET, BY APPLICATION, 2021-2031 ($MILLION)
- TABLE 86. REST OF ASIA-PACIFIC LAB GROWN DIAMONDS MARKET, BY MANUFACTURING METHOD, 2021-2031 ($MILLION)
- TABLE 87. REST OF ASIA-PACIFIC LAB GROWN DIAMONDS MARKET, BY SIZE, 2021-2031 ($MILLION)
- TABLE 88. REST OF ASIA-PACIFIC LAB GROWN DIAMONDS MARKET, BY NATURE, 2021-2031 ($MILLION)
- TABLE 89. REST OF ASIA-PACIFIC LAB GROWN DIAMONDS MARKET, BY APPLICATION, 2021-2031 ($MILLION)
- TABLE 90. LAMEA LAB GROWN DIAMONDS MARKET, BY MANUFACTURING METHOD, 2021-2031 ($MILLION)
- TABLE 91. LAMEA LAB GROWN DIAMONDS MARKET, BY SIZE, 2021-2031 ($MILLION)
- TABLE 92. LAMEA LAB GROWN DIAMONDS MARKET, BY NATURE, 2021-2031 ($MILLION)
- TABLE 93. LAMEA LAB GROWN DIAMONDS MARKET, BY APPLICATION, 2021-2031 ($MILLION)
- TABLE 94. LAMEA LAB GROWN DIAMONDS MARKET, BY COUNTRY, 2021-2031 ($MILLION)
- TABLE 95. BRAZIL LAB GROWN DIAMONDS MARKET, BY MANUFACTURING METHOD, 2021-2031 ($MILLION)
- TABLE 96. BRAZIL LAB GROWN DIAMONDS MARKET, BY SIZE, 2021-2031 ($MILLION)
- TABLE 97. BRAZIL LAB GROWN DIAMONDS MARKET, BY NATURE, 2021-2031 ($MILLION)
- TABLE 98. BRAZIL LAB GROWN DIAMONDS MARKET, BY APPLICATION, 2021-2031 ($MILLION)
- TABLE 99. ARGENTINA LAB GROWN DIAMONDS MARKET, BY MANUFACTURING METHOD, 2021-2031 ($MILLION)
- TABLE 100. ARGENTINA LAB GROWN DIAMONDS MARKET, BY SIZE, 2021-2031 ($MILLION)
- TABLE 101. ARGENTINA LAB GROWN DIAMONDS MARKET, BY NATURE, 2021-2031 ($MILLION)
- TABLE 102. ARGENTINA LAB GROWN DIAMONDS MARKET, BY APPLICATION, 2021-2031 ($MILLION)
- TABLE 103. SAUDI ARABIA LAB GROWN DIAMONDS MARKET, BY MANUFACTURING METHOD, 2021-2031 ($MILLION)
- TABLE 104. SAUDI ARABIA LAB GROWN DIAMONDS MARKET, BY SIZE, 2021-2031 ($MILLION)
- TABLE 105. SAUDI ARABIA LAB GROWN DIAMONDS MARKET, BY NATURE, 2021-2031 ($MILLION)
- TABLE 106. SAUDI ARABIA LAB GROWN DIAMONDS MARKET, BY APPLICATION, 2021-2031 ($MILLION)
- TABLE 107. UNITED ARAB EMIRATES LAB GROWN DIAMONDS MARKET, BY MANUFACTURING METHOD, 2021-2031 ($MILLION)
- TABLE 108. UNITED ARAB EMIRATES LAB GROWN DIAMONDS MARKET, BY SIZE, 2021-2031 ($MILLION)
- TABLE 109. UNITED ARAB EMIRATES LAB GROWN DIAMONDS MARKET, BY NATURE, 2021-2031 ($MILLION)
- TABLE 110. UNITED ARAB EMIRATES LAB GROWN DIAMONDS MARKET, BY APPLICATION, 2021-2031 ($MILLION)
- TABLE 111. SOUTH AFRICA LAB GROWN DIAMONDS MARKET, BY MANUFACTURING METHOD, 2021-2031 ($MILLION)
- TABLE 112. SOUTH AFRICA LAB GROWN DIAMONDS MARKET, BY SIZE, 2021-2031 ($MILLION)
- TABLE 113. SOUTH AFRICA LAB GROWN DIAMONDS MARKET, BY NATURE, 2021-2031 ($MILLION)
- TABLE 114. SOUTH AFRICA LAB GROWN DIAMONDS MARKET, BY APPLICATION, 2021-2031 ($MILLION)
- TABLE 115. REST OF LAMEA LAB GROWN DIAMONDS MARKET, BY MANUFACTURING METHOD, 2021-2031 ($MILLION)
- TABLE 116. REST OF LAMEA LAB GROWN DIAMONDS MARKET, BY SIZE, 2021-2031 ($MILLION)
- TABLE 117. REST OF LAMEA LAB GROWN DIAMONDS MARKET, BY NATURE, 2021-2031 ($MILLION)
- TABLE 118. REST OF LAMEA LAB GROWN DIAMONDS MARKET, BY APPLICATION, 2021-2031 ($MILLION)
- TABLE 119. ABD DIAMONDS PVT. LTD.: KEY EXECUTIVES
- TABLE 120. ABD DIAMONDS PVT. LTD.: COMPANY SNAPSHOT
- TABLE 121. ABD DIAMONDS PVT. LTD.: PRODUCT SEGMENTS
- TABLE 122. ABD DIAMONDS PVT. LTD.: PRODUCT PORTFOLIO
- TABLE 123. CLEAN ORIGIN LLC.: KEY EXECUTIVES
- TABLE 124. CLEAN ORIGIN LLC.: COMPANY SNAPSHOT
- TABLE 125. CLEAN ORIGIN LLC.: PRODUCT SEGMENTS
- TABLE 126. CLEAN ORIGIN LLC.: PRODUCT PORTFOLIO
- TABLE 127. CLEAN ORIGIN LLC.: KEY STRATERGIES
- TABLE 128. DE BEERS GROUP: KEY EXECUTIVES
- TABLE 129. DE BEERS GROUP: COMPANY SNAPSHOT
- TABLE 130. DE BEERS GROUP: PRODUCT SEGMENTS
- TABLE 131. DE BEERS GROUP: PRODUCT PORTFOLIO
- TABLE 132. DE BEERS GROUP: KEY STRATERGIES
- TABLE 133. DIAM CONCEPT: KEY EXECUTIVES
- TABLE 134. DIAM CONCEPT: COMPANY SNAPSHOT
- TABLE 135. DIAM CONCEPT: PRODUCT SEGMENTS
- TABLE 136. DIAM CONCEPT: PRODUCT PORTFOLIO
- TABLE 137. DIAMOND FOUNDRY INC.: KEY EXECUTIVES
- TABLE 138. DIAMOND FOUNDRY INC.: COMPANY SNAPSHOT
- TABLE 139. DIAMOND FOUNDRY INC.: PRODUCT SEGMENTS
- TABLE 140. DIAMOND FOUNDRY INC.: PRODUCT PORTFOLIO
- TABLE 141. DIAMOND FOUNDRY INC.: KEY STRATERGIES
- TABLE 142. HENAN HUANGHE WHIRLWIND CO., LTD.: KEY EXECUTIVES
- TABLE 143. HENAN HUANGHE WHIRLWIND CO., LTD.: COMPANY SNAPSHOT
- TABLE 144. HENAN HUANGHE WHIRLWIND CO., LTD.: PRODUCT SEGMENTS
- TABLE 145. HENAN HUANGHE WHIRLWIND CO., LTD.: PRODUCT PORTFOLIO
- TABLE 146. MITTAL DIAMONDS: KEY EXECUTIVES
- TABLE 147. MITTAL DIAMONDS: COMPANY SNAPSHOT
- TABLE 148. MITTAL DIAMONDS: PRODUCT SEGMENTS
- TABLE 149. MITTAL DIAMONDS: PRODUCT PORTFOLIO
- TABLE 150. NEW DIAMOND TECHNOLOGY LLC: KEY EXECUTIVES
- TABLE 151. NEW DIAMOND TECHNOLOGY LLC: COMPANY SNAPSHOT
- TABLE 152. NEW DIAMOND TECHNOLOGY LLC: PRODUCT SEGMENTS
- TABLE 153. NEW DIAMOND TECHNOLOGY LLC: PRODUCT PORTFOLIO
- TABLE 154. SWAROVSKI AG: KEY EXECUTIVES
- TABLE 155. SWAROVSKI AG: COMPANY SNAPSHOT
- TABLE 156. SWAROVSKI AG: PRODUCT SEGMENTS
- TABLE 157. SWAROVSKI AG: PRODUCT PORTFOLIO
- TABLE 158. SWAROVSKI AG: KEY STRATERGIES
- TABLE 159. WD LAB GROWN DIAMONDS: KEY EXECUTIVES
- TABLE 160. WD LAB GROWN DIAMONDS: COMPANY SNAPSHOT
- TABLE 161. WD LAB GROWN DIAMONDS: PRODUCT SEGMENTS
- TABLE 162. WD LAB GROWN DIAMONDS: PRODUCT PORTFOLIO
- TABLE 163. WD LAB GROWN DIAMONDS: KEY STRATERGIES
LIST OF FIGURES
- FIGURE 01. LAB GROWN DIAMONDS MARKET, 2021-2031
- FIGURE 02. SEGMENTATION OF LAB GROWN DIAMONDS MARKET, 2021-2031
- FIGURE 03. TOP INVESTMENT POCKETS IN LAB GROWN DIAMONDS MARKET (2022-2031)
- FIGURE 04. LOW BARGAINING POWER OF SUPPLIERS
- FIGURE 05. LOW BARGAINING POWER OF BUYERS
- FIGURE 06. LOW THREAT OF SUBSTITUTES
- FIGURE 07. LOW THREAT OF NEW ENTRANTS
- FIGURE 08. LOW INTENSITY OF RIVALRY
- FIGURE 09. DRIVERS, RESTRAINTS AND OPPORTUNITIES: GLOBALLAB GROWN DIAMONDS MARKET
- FIGURE 10. LAB GROWN DIAMONDS MARKET, BY MANUFACTURING METHOD, 2021(%)
- FIGURE 11. COMPARATIVE SHARE ANALYSIS OF LAB GROWN DIAMONDS MARKET FOR HPHT, BY COUNTRY 2021 AND 2031(%)
- FIGURE 12. COMPARATIVE SHARE ANALYSIS OF LAB GROWN DIAMONDS MARKET FOR CVD, BY COUNTRY 2021 AND 2031(%)
- FIGURE 13. LAB GROWN DIAMONDS MARKET, BY SIZE, 2021(%)
- FIGURE 14. COMPARATIVE SHARE ANALYSIS OF LAB GROWN DIAMONDS MARKET FOR BELOW 2 CARAT, BY COUNTRY 2021 AND 2031(%)
- FIGURE 15. COMPARATIVE SHARE ANALYSIS OF LAB GROWN DIAMONDS MARKET FOR 2-4 CARAT, BY COUNTRY 2021 AND 2031(%)
- FIGURE 16. COMPARATIVE SHARE ANALYSIS OF LAB GROWN DIAMONDS MARKET FOR ABOVE 4 CARAT, BY COUNTRY 2021 AND 2031(%)
- FIGURE 17. LAB GROWN DIAMONDS MARKET, BY NATURE, 2021(%)
- FIGURE 18. COMPARATIVE SHARE ANALYSIS OF LAB GROWN DIAMONDS MARKET FOR COLORLESS, BY COUNTRY 2021 AND 2031(%)
- FIGURE 19. COMPARATIVE SHARE ANALYSIS OF LAB GROWN DIAMONDS MARKET FOR COLORED, BY COUNTRY 2021 AND 2031(%)
- FIGURE 20. LAB GROWN DIAMONDS MARKET, BY APPLICATION, 2021(%)
- FIGURE 21. COMPARATIVE SHARE ANALYSIS OF LAB GROWN DIAMONDS MARKET FOR FASHION, BY COUNTRY 2021 AND 2031(%)
- FIGURE 22. COMPARATIVE SHARE ANALYSIS OF LAB GROWN DIAMONDS MARKET FOR INDUSTRIAL, BY COUNTRY 2021 AND 2031(%)
- FIGURE 23. LAB GROWN DIAMONDS MARKET BY REGION, 2021
- FIGURE 24. U.S. LAB GROWN DIAMONDS MARKET, 2021-2031 ($MILLION)
- FIGURE 25. MEXICO LAB GROWN DIAMONDS MARKET, 2021-2031 ($MILLION)
- FIGURE 26. CANADA LAB GROWN DIAMONDS MARKET, 2021-2031 ($MILLION)
- FIGURE 27. UK LAB GROWN DIAMONDS MARKET, 2021-2031 ($MILLION)
- FIGURE 28. GERMANY LAB GROWN DIAMONDS MARKET, 2021-2031 ($MILLION)
- FIGURE 29. FRANCE LAB GROWN DIAMONDS MARKET, 2021-2031 ($MILLION)
- FIGURE 30. ITALY LAB GROWN DIAMONDS MARKET, 2021-2031 ($MILLION)
- FIGURE 31. SPAIN LAB GROWN DIAMONDS MARKET, 2021-2031 ($MILLION)
- FIGURE 32. REST OF EUROPE LAB GROWN DIAMONDS MARKET, 2021-2031 ($MILLION)
- FIGURE 33. CHINA LAB GROWN DIAMONDS MARKET, 2021-2031 ($MILLION)
- FIGURE 34. JAPAN LAB GROWN DIAMONDS MARKET, 2021-2031 ($MILLION)
- FIGURE 35. INDIA LAB GROWN DIAMONDS MARKET, 2021-2031 ($MILLION)
- FIGURE 36. AUSTRALIA LAB GROWN DIAMONDS MARKET, 2021-2031 ($MILLION)
- FIGURE 37. SOUTH KOREA LAB GROWN DIAMONDS MARKET, 2021-2031 ($MILLION)
- FIGURE 38. REST OF ASIA-PACIFIC LAB GROWN DIAMONDS MARKET, 2021-2031 ($MILLION)
- FIGURE 39. BRAZIL LAB GROWN DIAMONDS MARKET, 2021-2031 ($MILLION)
- FIGURE 40. ARGENTINA LAB GROWN DIAMONDS MARKET, 2021-2031 ($MILLION)
- FIGURE 41. SAUDI ARABIA LAB GROWN DIAMONDS MARKET, 2021-2031 ($MILLION)
- FIGURE 42. UNITED ARAB EMIRATES LAB GROWN DIAMONDS MARKET, 2021-2031 ($MILLION)
- FIGURE 43. SOUTH AFRICA LAB GROWN DIAMONDS MARKET, 2021-2031 ($MILLION)
- FIGURE 44. REST OF LAMEA LAB GROWN DIAMONDS MARKET, 2021-2031 ($MILLION)
- FIGURE 45. TOP WINNING STRATEGIES, BY YEAR
- FIGURE 46. TOP WINNING STRATEGIES, BY DEVELOPMENT
- FIGURE 47. TOP WINNING STRATEGIES, BY COMPANY
- FIGURE 48. PRODUCT MAPPING OF TOP 10 PLAYERS
- FIGURE 49. COMPETITIVE DASHBOARD
- FIGURE 50. COMPETITIVE HEATMAP: LAB GROWN DIAMONDS MARKET
- FIGURE 51. TOP PLAYER POSITIONING, 2021
- FIGURE 52. DE BEERS GROUP: NET SALES, 2019-2021 ($MILLION)


