


 |
年間契約型資訊服務
商品編碼
1359149
交通網絡:研究服務Transport Networks Research Service |
||||||
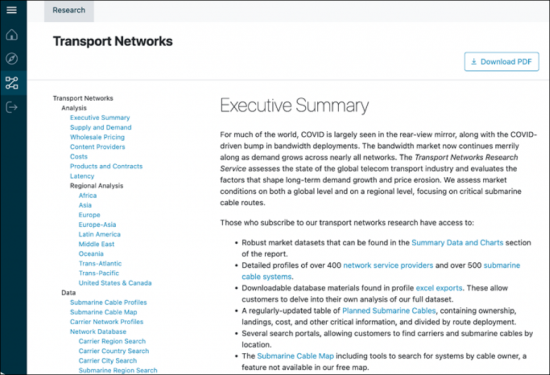
TeleGeography 自 1999 年以來一直在追蹤長途網路和海底電纜市場。 我們的數據顯示了像 Google 和 Meta 這樣的內容提供者如何改寫我們對市場的了解。 我們的服務提供以下內容來幫助您了解此類發展的流程。
- 詳細的網路和營運商概況:430 家營運商和500 多家有線電視營運商
- 頻寬供應和需求分析:按區域/路線
- 來自領先內容提供者的關鍵數據和分析,包括國際頻寬成長指標
- 綜合批發帶價格趨勢
它還包含許多其他資訊。
TeleGeography's Transport Networks Research Service has the pulse of the global network. This is fresh primary research, written analysis, and interactive tools for exploring long-haul network data and the undersea cable market.
SAMPLE VIEW
Networks Database
Easily find the information that matters to you. The latest version of the Networks Database allows users to:
- Search carriers by city, country, and region. You can also view wholesale product availability by location.
- Search submarine networks by country and region.
For additional flexibility, any successful search can be downloaded in an Excel-compatible format.
Cost Overview, Bandwidth Prices
This analysis provides an overview of the components of network cost as they relate to sub cables and terrestrial networks, including:
- Terrestrial network construction, upgrade, and operating costs
- Undersea cable construction, upgrade, operating, and costs
- Price trends for 10 Gbps and 100 Gbps wavelengths
Latency Statistics by Network
Get round-trip delay latency for nearly 2,300 submarine cable routes. Stats can be downloaded as a complete data set.
Submarine Cable Fault Dashboard
This new addition includes information on publicly-disclosed faults on subsea cables since 2017. The following data points are shown when available:
- Date of fault
- Date of repair
- Location of fault
Content Provider Trends & Analysis
Content providers like Google and Meta are changing the market. Our content providers section takes a closer look at the bandwidth on major cable routes attributed to these content providers and examines emerging trends.
Supply & Demand Analysis
Our experts are ready to help you understand the market better. Analysis includes:
- Supply-bandwidth by route and region
- International bandwidth usage from 2011 to 2021 for more than 170 countries
- Impact of upgrades and cable construction on supply, competition, and pricing
- Implications of network evolution on long-haul bandwidth demand
- Summary of planned cables, including ownership, potential capacity and construction cost, landing stations, and ready-for-service dates
Network Operator and Undersea Cable Profiles
- 430 carrier network profiles
- Over 500 submarine system profiles Maps, cities covered, landing points, capacity-it's all here.
 全球網路流量分析市場規模、佔有率、成長分析、按組件、按部署 - 產業預測 (2024-2031)
 網路流量分析 - 市場佔有率分析、產業趨勢與統計、成長預測(2024 - 2029)
 IP網路:調查服務
 網路流量分析的全球市場:現狀分析與預測(2022年~2028年)